

Abstract
Urinary proteins have been implicated as inhibitors of kidney stone formation (urolithiasis). As a proximal fluid, prefiltered by the kidneys, urine is an attractive biofluid for proteomic analysis in urologic conditions. However, it is necessary to correct for variations in urinary concentration. In our study, individual urine samples were normalized for this variation by using a total protein to creatinine ratio. Pooled urine samples were compared in two independent experiments. Differences between the urinary proteome of stone formers and nonstone-forming controls were characterized and quantified using label-free nano-ultraperformance liquid chromatography high/low collision energy switching analysis. There were 1063 proteins identified, of which 367 were unique to the stone former groups, 408 proteins were unique to the control pools, and 288 proteins were identified for comparative quantification. Proteins found to be unique in stone-formers were involved in carbohydrate metabolism pathways and associated with disease states. Thirty-four proteins demonstrated a consistent >twofold change between stone formers and controls. For ceruloplasmin, one of the proteins was shown to be more than twofold up-regulated in the stone-former pools, this observation was validated in individuals by enzyme-linked immunosorbent assay. Moreover, in vitro crystallization assays demonstrated ceruloplasmin had a dose-dependent increase on calcium oxalate crystal formation. Taken together, these results may suggest a functional role for ceruloplasmin in urolithiasis.
Kidney stone disease is a major clinical and economic burden for health care systems around the world. It is estimated that up to 13% of men and 7% of women present with kidney stones in their lifetime (1). Treatment is costly and often involves lithotripsy or surgical removal (2). The majority (∼80%) of urinary tract stones are predominantly calcium oxalate in composition (3). The etiology of kidney stone formation is unknown, but proteins have been implicated in crystal nucleation, regulation of crystal growth and aggregation, and regulation of adhesion to the renal tubule and urothelium (4–6). Thus, it is likely that there may be proteins in urine that either promote stone formation in stone formers or inhibit stone formation under normal circumstances. Identification and characterization of these proteins would have obvious potential diagnostic and possibly therapeutic benefits.
To date, few studies have been performed to compare the urinary proteome of stone-formers compared with controls (7, 8). Most research has focused either on proteins extracted from stones or proteins derived from urine fractions that have been shown to inhibit crystallization in vitro (9, 10). Using these methods, several putative inhibitory proteins have been identified (11).
Research into the urinary proteome is advantageous for urologic diseases for several reasons. First, many urologic pathologies are “downstream” of the kidney and in contact with urine. Therefore, urine is a proximal fluid and optimal for investigating disease etiology or identifying diagnostic markers. Second, the dynamic range of urine is not as broad as that of plasma (12), which obviates the need for extensive depletion processes before analysis. Third, urine is an abundant and readily obtainable biofluid. However, one challenge of urinary proteomics is normalizing the variation of protein concentration in urine samples because of fluid intake and renal function. The normalization process is crucial to obtaining meaningful comparative data. The ratio of urinary total protein to urinary creatinine in “spot” urine samples has been used to correct for variation in protein excretion and hydration status (13).
In this discovery stage study, we have performed two independent label-free quantitative proteomic comparisons on pooled urine of kidney stone-formers versus controls. This is the first study to provide a comprehensive quantitative proteomic comparison of urine from patients with urolithiasis and controls and to identify a protein which promotes the formation of calcium oxalate crystals.
EXPERIMENTAL PROCEDURES
Sample Collection and Patients
This study analyzed urine samples from 57 patients with radiologically confirmed urinary tract stones and 57 patients with unrelated benign urological conditions. All samples were obtained from patients attending the Urology Department, The Churchill Hospital, Oxford, UK for surgical pre-assessment as part of an ongoing bio-banking program. Samples were collected under ethics approval (Oxfordshire REC 09/H0606/5) and all patients gave informed consent. The stone-formers had a mean age of 54.9 years (range 19–91) and the controls had a mean age of 52 (range 29–82). Of the stone-formers, 38 were male and 19 female and in the control group 51 were male and 6 female. Twenty-four of the stone formers had a solitary stone and 33 had multiple stones at the time of sample collection. Subgrouping by stone analysis was not possible because patients were treated with ureteroscopy and laser fragmentation or extracorporeal shock wave lithotripsy and consequently stones were not routinely available for analysis. Control patients were attending for surgery for benign urological conditions (Table I). All patients in the study had a normal serum creatinine level. Spot urine samples from stone forming patients and nonstone formers were collected in 30-ml containers (Sterilin, Newport, UK) before any intervention. Samples were frozen at −80 °C within 2 h of collection. Samples were thawed and centrifuged for 5 min at 500 × g to remove any cellular material and aliquoted into 2-ml aliquots and stored at −80 °C before further processing. Each aliquot was used only once.
Table I. Patient demographics.
| Stone formers | Controls | |
|---|---|---|
| Number: | ||
| Total | 57 | 57 |
| Male | 38 | 51 |
| Female | 19 | 6 |
| Mean age | 54.9 | 52 |
| Stone burden: | ||
| Single stone | 24 | |
| Multiple stones | 33 | |
| Non-malignant urological problem: | ||
| Simple penile/scrotal surgery | 29 | |
| TURPa/optical urethrotomy/urethral dilatation | 18 | |
| Other | 10 |
a TURP, transurethral resection of prostate.
Urinary Protein Normalization and Quantification
Urinary total protein and creatinine levels were assayed on 1-ml aliquots from each sample using a clinical analyzer (Bayer Advia 2400, Siemens Medical Solutions, Deerfield, IL, USA). Total protein to creatinine ratios were calculated and used to determine the volume each sample contributed to the pool in each experiment. The pooled urine samples were concentrated to <500 μl by centrifugation at 3500 rpm in 5 kDa molecular weight cut-off concentration columns (Vivaspin 20, Sartorius, Goettingen, Germany) and proteins isolated by methanol-chloroform precipitation (14). Precipitated protein pellets were resuspended in isoelectric focusing buffer (6.3 m urea, 2.4 m thiourea, 45 mm dithiothreitol, 6% glycerol, and pH 4–7 carrier ampholytes (Agilent Technologies, Santa Clara, CA). The protein concentration was measured from 5-μl aliquots of these solutions using EZQ® protein quantitation kit (Invitrogen) according to the manufacturer's instructions.
Off-Gel Isoelectric Point Fractionation and SDS-Page analysis
Isoelectric point-based fractionation on precipitated urinary proteins was performed with the 3100 Off-gel fractionator (Agilent Technologies) using the manufacturer's protocol. Twelve protein fractions were generated over a pH gradient of 4–7. After a 5-μl aliquot had been taken for SDS-PAGE analysis, the fractions were methanol-chloroform precipitated. Five microliters from each fraction was mixed with 15 μl Laemmli sample buffer and run on a 4–12% precast gel (Bio-Rad) at 120 V for 2 h. Gels were fixed in 40% methanol 10% acetic acid stain using Sypro Ruby according to the manufacturer's instructions. Gels were destained in 10% methanol and 7% acetic acid and visualized using a UV Transilluminator (AutoChemi System, UVP bioimaging systems) at 570–640 nm and images were acquired using LabWorks 4.6.
In-solution Digestion and Peptide Purification
Precipitated protein pellets from each of the fractions were resuspended in 100 μl of denaturing buffer (6 m Urea, 100 mm Tris pH 7.8). The samples were reduced for 60 min with 30 mm dithiothreitol, 10 mm Tris p7.8, then alkylated for 60 min with 30 mm iodoacetamide. Excess reducing agent was added to consume unreacted iodoacetamide. The urea concentration was reduced by adding 775 μl water and the samples were digested with (1.5 μg) trypsin at 37 °C to completion. Peptide digests were purified using Sep-Pak C18 columns (Waters, Milford, MA). Columns were equilibrated before sample loading. Samples were washed with 10 ml of 3% acetonitrile, 0.1% formic acid (FA)1 and eluted with 2 × 750 μl of solution 80% acetonitrile, 0.1% FA. Purified peptides were lyophilized in a vacuum centrifuge and stored at −80 °C. Before mass spectrometry analysis, samples were resuspended in 50 μl of 3% acetonitrile, 0.1% FA.
Mass Spectrometry and Data Analysis
Tryptic digests of fractionated urinary proteins were subjected to nano-ultraperformance liquid chromatography-tandem mass spectrometry analysis (nano-UPLC-MS/MS) using a 75 μm I.D. 25 cm C18 column, 1.7 μm particle size and a 90 min gradient: 2% to 45% solvent B (solvent A: 99.9% H2O, 0.1% FA; solvent B: 99.9% acetonitrile, 0.1% FA) on a Waters Nano-AcquityTM UPLC system coupled to a Waters QTOFpremierTM tandem mass spectrometer (Waters), as described previously (15). Data was acquired in high-definition high/low collision energy switching (MSE) mode (high and low collision energy switching every 1.5 s) and processed with ProteinLynx Global Server (PLGS version 2.3, Waters) to reconstruct MS/MS spectra by combining all masses with a similar retention time. MS/MS spectra (peaklists) were searched against the SwissProt (version 56.9, 41,104 human protein entries) databases using PLGS (version 2.3) with the following parameters: peptide tolerance, 10 ppm (allowing for variation based on mass peak resolution); fragment tolerance 0.015 Da (allowing for variation based mass peak resolution); trypsin missed cleavages, 3; fixed modification, carbamidomethylation and variable modifications, Deamidation on NQ and Met oxidation, Acetyl N terminus and a false positive rate of 4%. Included were all protein hits that were identified with a confidence of >95%.
Quantitative analysis of MS data was performed using the Waters Expression Profiling System (WEPSTM). Where quantitative data was obtained for the same protein in multiple fractions, the median value of available ratio measurements from all fractions was calculated. Ingenuity Pathway Analysis software (Ingenuity Systems®) was used to research protein functions and associated networks.
Enzyme-Linked Immunosorbent Assay
Levels of urinary ceruloplasmin were measured by quantitative competitive sandwich ELISA (AssayPro, St Charles, USA) according to the manufacturer's guidelines. Urine volumes were normalized according to total protein: creatinine ratios with water and diluted 1:10 for the assay. Absorbance was measured at 450 nm using a monochromator microplate reader (Safire2, Tecan).
Crystallization Assay
Changes in calcium oxalate crystallization kinetics were investigated by monitoring the increase in absorbance after mixing solutions of calcium chloride and sodium oxalate to generate a supersaturated calcium oxalate solution as described (16). Stock solutions were prepared: stock solution A contained 8 mm calcium chloride (Sigma), 200 mm sodium chloride (Sigma), and 10 mm sodium acetate (Sigma) and stock solution B contained 1 mm sodium oxalate (Sigma), 200 mm sodium chloride (Sigma), and 10 mm sodium acetate (Sigma). These solutions were adjusted to pH 6 to represent physiologic urinary conditions. For crystallization experiments 100 μl of the stock solution A was transferred into each well of the 96-well plate. To this 100 μl of the stock solution B was added resulting in final assay concentrations of 4 mm calcium chloride, 0.5 mm sodium oxalate, 200 mm sodium chloride, and 10 mm sodium acetate, pH 6. Concentrated solutions of bovine serum albumin (Sigma, St Louis, MO, USA) or ceruloplasmin (Cell sciences, Canton, MA) were added to stock solution A before the addition of the stock solution B. In each experimental run, parallel conditions were run using a solution B lacking sodium oxalate. The plate was transferred to a monochromator microplate reader (Safire2, Tecan) preheated and maintained at 37 °C. Absorbance at 620 nm was measured every 2 min for 30 min with automated gentle agitation before each reading. Eight replicates of each condition were performed in each experiment. Graphs were generated by subtracting the results from the parallel conditions lacking sodium oxalate. Results presented are from three independent experiments.
RESULTS
Ratios of Total Protein to Creatinine Normalize for Variation in Protein Concentration because of Differences in Urine Dilution Between Individuals
To characterize and quantify the variation in urinary proteins from patients with kidney stones compared with nonstone forming controls, we performed two independent experiments using label-free nano-UPLC-MSE analysis on fractionated urinary proteins from a total of 57 patients and 57 controls. The first experiment was comprised of 22 stone-formers and 22 controls. The second cohort included 35 stone formers and 35 controls. A work-flow of the proteomic analysis is shown in Fig. 1. Total urinary protein concentrations varied from 5 to 771 mg/L in the stone-formers and 24 to 1332 mg/L in the nonstone formers because of variation in fluid intake between individuals. Consequently, we reasoned that proteomic comparison of equal volumes of urine would be erroneous.
Fig. 1.
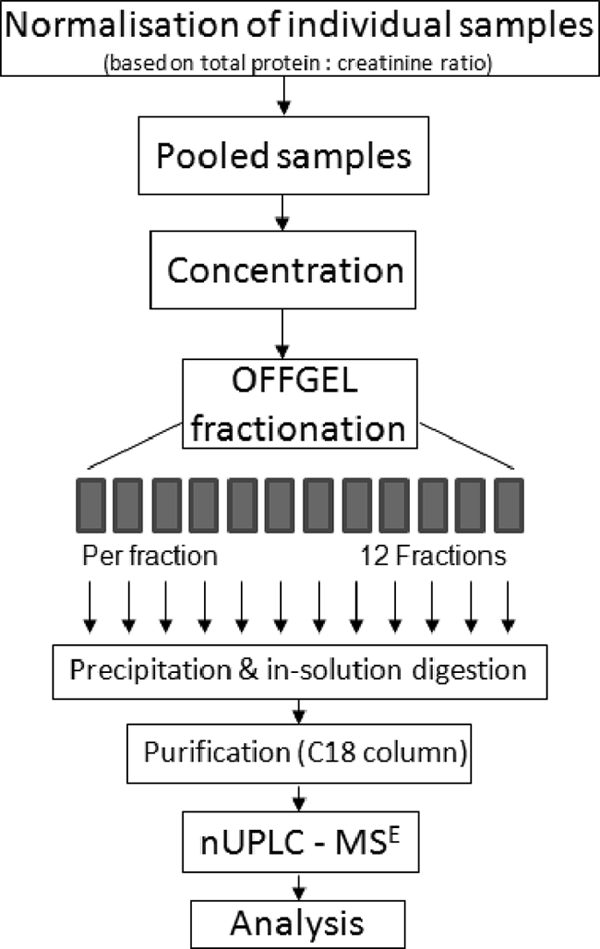
Workflow for urine sample preparation, fractionation, and analysis by mass spectrometry used in this study.
The ratio of total protein to creatinine in “spot” urine samples has been used clinically as a marker of renal impairment, correlates well with total protein excretion in a set timeframe and has been shown to correct for variations in urinary concentration due to hydration (13). Urinary total protein and creatinine levels were measured using a clinical analyzer for each sample. Total protein:creatinine ratios were calculated to determine the volume of urine each individual patient sample contributed to the pool of stone-former or nonstone former urine for both experiments.
The pools for the first proteomic profiling experiment contained samples from 22 individuals in both the stone-forming and control groups. In the second experiment, the stone-forming and control pools both contained samples from 35 individuals. The pool volumes ranged from 16.28 to 22.90 ml and were concentrated by centrifugation using 5 kDa molecular weight cutoff filters to a volume of <0.5 ml. Proteins were precipitated using methanol and chloroform from the concentrates and resuspended in fractionation buffer. Total protein concentration from each of the four pooled samples was assayed. Fig. 2A shows that the normalization using protein:creatinine ratios resulted in comparable total protein content in the stone-former and control pools at 283 μg and 304 μg in the first experiment and 439 μg and 436 μg in the second experiment, respectively.
Fig. 2.

Comparable protein content in urine from stone formers and controls. A, Protein concentrations in urine from nonstone formers (NSF) and stone formers (SF) after normalization using total protein to creatinine ratios. B, SDS-PAGE following fractionation using off-gel iso-electric focusing of control and stone former pools. The lanes (1–12) represent the fractions. C, Representative chromatogram showing total base peak intensity (BPI) of fraction 5 of stone formers (left panel) and non-stone formers (right panel) in experiment 2.
Isoelectric-point Fractionation Followed by Label-free Nano-UPLC MSE Mass Spectrometry Identifies Over 1000 Urinary Proteins
To increase the number of urinary proteins identified, off-gel fractionation based on isoelectric point focusing over a pH gradient of 4–7 was performed. Fig. 2B demonstrates the reproducibility of the fractionation by SDS-PAGE separation of the 12 fractions from the stone-formers and nonstone formers in the first experiment. Fractions were collected; proteins were precipitated using methanol and chloroform and subjected to in-solution tryptic digestion. Resulting peptide digests were purified over a C18 column before label-free nano-UPLC MSE analysis.
Following isoelectric focusing, tryptic digestion and peptide purification, all fractions from both experiments were analyzed in triplicate by mass spectrometry. Data from corresponding fractions from stone-former and control pools was acquired contemporaneously. The representative chromatograms shown in Fig. 2C demonstrate comparable amounts of peptide loading from the stone-former and control pools following fractionation and sample processing. In total, 1063 proteins were identified in urine from the two experiments.
Comparative Quantitative Abundance Analysis Shows 34 Proteins with Over Twofold Median Change
Of these 1063 proteins identified by the label-free nano-UPLC MSE analysis, 367 proteins were found only in the stone former pools, 408 proteins were uniquely identified to the control pools, and 288 proteins were identified in both the stone-formers and nonstone formers. Comparative pathway analysis was conducted on proteins unique to both the stone formers and controls, to assess and compare their functions. Fig. 3A shows that significant pathways (p < 0.05) comprised of proteins unique to the stone-formers involve metabolic processes, specifically carbohydrate metabolism, whereas significant pathways comprised of proteins unique to the controls are involved in growth and development signaling processes. The most significant functions assigned to the unique control proteins identified normal cellular processes, whereas the most significant functions associated with proteins unique to the stone formers consisted of disease states (Fig. 3B). When analyzed together in this way, proteins found uniquely in either the stone forming or nonstone-forming groups suggests a difference in biology between the groups. To determine if these proteins are a cause or result of stone disease would require a longitudinal study. Although individual proteins found uniquely in one group may be of clinical interest, the quantitative liquid chromatography-MS (LC-MS) approach can only provide relative quantification for proteins found in both groups. Consequently, we focused on those proteins identified in both groups for further analysis. From the comparative quantitative data obtained on the 288 proteins identified in both the stone-formers and controls, median fold changes ranged from 6.25-fold lower expression to 5.9-fold higher expression in stone formers. For the majority of these proteins, the difference in abundance was under twofold (Fig. 3C). The 34 proteins that demonstrated over a twofold change are listed in Table II. A twofold change was chosen as a threshold to be well above observed technical variations in MSE experiments (15). Several of these proteins with an increased abundance in the stone forming group are derived from blood (e.g. hemoglobin α and β-chains, haptoglobin related protein, haptoglobin), which is consistent with the clinical finding that the majority of patients with kidney stones have detectable hematuria. Recent work has suggested that red blood cell fragments can promote stone growth and aggregation (17). Other urinary proteins with greater relative abundance in the stone formers are serum derived (e.g. α-2-macroglobulin, fibrinogen, and ceruloplasmin), which may suggest a loss of renal integrity. Animal studies have demonstrated that nephrotoxicity can induce kidney stones and that mitigation of this renal damage can reduce crystal formation (18, 19). However, in this study, it is not possible to determine whether these proteins contribute to stone formation (secondary to renal damage) or whether they are present as a result of local trauma to the urinary tract. A longitudinal study would be required to address this question.
Fig. 3.

(A and B) Pathway analysis of proteins identified in urine from nonstone formers (light blue bars) and stone formers (dark blue bars). Proteins uniquely found in stone formers are involved in metabolic processes (A) and disease states (B). C, Relative abundance ratios of proteins found in stone versus control urine samples. D, Reconstituted MS/MS spectrum from MSE raw data corresponding to the tryptic peptide fragment 188–201 derived from human ceruloplasmin (UniProt KB P00450).
Table II. Urinary proteins showing a median change of over 2 fold in stone-formers.
| IDa | Stone formers to Control ratiob | Entrez Gene Name | Representative PLGS score | Fraction number observedc | Seq cov % | # of distinct peptides | Subcellular location | Function |
|---|---|---|---|---|---|---|---|---|
| Q86V85 | 0.16 | G protein-coupled receptor 180 | 141.37 | 5, control | 9.5 | 3 | unknown | Receptor |
| Q86SR0 | 0.29 | Ly6/neurotoxin 1 | 230.11 | 12, control | 46.4 | 6 | Plasma Membrane | Ion channel inhibitor |
| P19652 | 0.33 | orosomucoid 2 | 160.5 | 1, control | 32.8 | 6 | Extracellular Space | Acute phase plasma protein |
| P14780 | 0.35 | matrix metallopeptidase 9 | 688.54 | 3, control | 36.2 | 18 | Extracellular Space | Protease |
| Q9Y646 | 0.365 | plasma glutamate carboxypeptidase | 326.22 | 7, control | 25.6 | 8 | Extracellular Space | Protease |
| Q9NQ84 | 0.37 | RAIG-3 | 187.34 | 3, control | 19.7 | 6 | Plasma Membrane | Receptor |
| P08246 | 0.4 | elastase, neutrophil expressed | 139.6 | 9, control | 27.3 | 4 | Extracellular Space | Protease |
| P56537 | 0.41 | eukaryotic translation initiation factor 6 | 309.1 | 5, control | 46.1 | 8 | Cytoplasm | translation regulator |
| P05451 | 0.41 | Lithostathin | 112 | 7, control | 43.4 | 6 | Extracellular Space | growth factor |
| P25815 | 0.43 | S100 calcium binding protein P | 324.9 | 5, control | 35.8 | 3 | Cytoplasm | Calcium/Magnesium ion binding |
| P07911 | 0.44 | Uromodulin | 2778.14 | 3, control | 55.6 | 31 | Extracellular Space | Calcium ion binding |
| P31025 | 0.44 | lipocalin 1 (tear prealbumin) | 180.1 | 5, control | 30.7 | 4 | Extracellular Space | Protease inhibitor |
| P11021 | 0.45 | HSP70–5 | 313.51 | 6, control | 24.8 | 11 | Cytoplasm | Chaperone |
| Q8WVV5 | 0.46 | butyrophilin, subfamily 2, member A2 | 178.11 | 1, control | 13.4 | 3 | unknown | Unknown |
| P02763 | 0.475 | orosomucoid 1 | 388.88 | 1, control | 42.3 | 5 | Extracellular Space | Acute phase plasma protein |
| Q9H3G5 | 0.49 | carboxypeptidase, vitellogenic-like | 477.35 | 6, control | 20 | 8 | unknown | Carboxypeptidase |
| P12273 | 0.495 | prolactin-induced protein | 569.98 | 6, control | 44.5 | 6 | Extracellular Space | Unknown |
| P28066 | 2.01 | PSC5 | 105.4 | 5, stone | 36.9 | 6 | Cytoplasm | Peptidase |
| P04792 | 2.015 | heat shock 27kDa protein 1 | 107.2 | 6, stone | 21 | 3 | Cytoplasm | Chaperone |
| P13727 | 2.12 | proteoglycan 2, bone marrow | 82 | 1, stone | 28.8 | 6 | Extracellular Space | Immune response |
| P02750 | 2.14 | leucine-rich alpha-2-glycoprotein 1 | 928.8 | 3, stone | 39.8 | 13 | Extracellular Space | Unknown |
| P00739 | 2.16 | haptoglobin-related protein | 659.4 | 8, stone | 39.4 | 10 | Extracellular Space | Peptidase |
| P08185 | 2.16 | serpin peptidase inhibitor | 292.6 | 5, stone | 26.2 | 8 | Extracellular Space | Protease inhibitor |
| P07737 | 2.18 | profilin 1 | 218.6 | 6, stone | 58.6 | 5 | Cytoplasm | Actin binding |
| Q96S96 | 2.335 | phosphatidylethanolamine-binding protein 4 | 166.2 | 11, stone | 12.8 | 3 | Cytoplasm | Lipid binding |
| P00738 | 2.59 | Haptoglobin | 1582.4 | 8, stone | 48.3 | 18 | Extracellular Space | proteolysis & iron homeostasis |
| P69891 | 2.64 | hemoglobin, gamma A | 142.3 | 2, stone | 36.1 | 4 | Cytoplasm | oxygen transport |
| P69892 | 3.06 | hemoglobin, gamma G | 140 | 2, stone | 25.2 | 3 | Cytoplasm | oxygen transport |
| P00450 | 3.13 | ceruloplasmin (ferroxidase) | 1846.8 | 10, stone | 54.2 | 39 | Extracellular Space | metal ion binding |
| P00441 | 3.42 | superoxide dismutase 1 | 278.6 | 8, stone | 34.4 | 3 | Cytoplasm | metal ion binding |
| P02675 | 3.47 | fibrinogen beta chain | 318.9 | 8, stone | 37.7 | 16 | Extracellular Space | clotting |
| P02679 | 3.53 | fibrinogen gamma chain | 265.5 | 2, stone | 30.7 | 9 | Extracellular Space | clotting |
| Q9BVK6 | 3.82 | transmembrane emp24 protein transport domain containing 9 | 74.7 | 7, stone | 25.7 | 4 | Cytoplasm | Unknown |
| P01023 | 5.87 | alpha-2-macroglobulin | 827.27 | 12, stone | 33.6 | 31 | Extracellular Space | Protease inhibitor/cytokine transporter |
a Accession number from the SwissProt Database.
b Median of quantitative data values obtained from two independent experiments.
c Fraction number with a representative PLGS score for this protein.
Several differentially abundant proteins were found to be consistent with previous findings, including uromodulin, osteopontin, and α-1-microglobulin that were detected at lower levels in the stone forming group and superoxide dismutase and ceruloplasmin that were found at higher levels (20–24). Ceruloplasmin, which showed a median fold-change of 3.1, has been observed to be up-regulated in gene expression microarray studies using rodent models of urolithiasis (21, 25). A MS/MS fragmentation spectrum of one of the ceruloplasmin peptides identified is shown in Fig. 3D.
Urinary Ceruloplasmin Levels are Elevated in Stone Formers
Ceruloplasmin, has been demonstrated to be an early urinary marker of renal tubular dysfunction caused by diabetes and renotoxic chemicals (26–28) and is elevated in the serum of patients with metabolic syndrome (29). In addition, a strong association between metabolic syndrome and stone formation has been reported (30). Using ELISA, we investigated whether ceruloplasmin levels in individuals would corroborate the proteomic data generated from pooled samples. Urinary ceruloplasmin levels were determined in 34 stone-formers and 30 controls. Ceruloplasmin levels were found to be significantly higher in the individual stone-forming patients (p = 0.026), (Fig. 4). This data from both pooled and individual samples using two independent methods suggests that stone-formers have higher levels of urinary ceruloplasmin. It is evident that there is a difference in the estimated differences in ceruloplasmin between the ELISA and LC-MS methods. This is not surprising as the relative quantification of abundance determined by LC-MS is a calculation based on the differences in isoelectric focusing fractions. Ceruloplasmin was detected in multiple fractions, probably reflecting an overall high abundance of this protein, polymorphisms or modifications that prevent discrete fractionation. Furthermore, The ELISA antibody will only recognize a single epitope, maybe representing a subset of ceruloplamin. As both LC-MS and ELISA demonstrated higher levels of ceruloplasmin in the urine of stone formers we proceeded to investigate whether it may have a functional role in calcium oxalate crystal formation using an in vitro assay.
Fig. 4.

Mean (left) and distribution (right) of urinary ceruloplasmin levels in 34 stone formers and 30 nonstone formers (student t test, p = 0. 026) determined by enzyme linked immunosorbant assay (ELISA).
Ceruloplasmin Promotes Calcium Oxalate Crystallization In Vitro
Around 80% of all urinary stones are predominantly composed of calcium oxalate (3). In vitro assays of calcium oxalate crystallization have been developed based on increased light absorbance because of precipitation of microcrystals (16, 31). Such assays using artificial urine solutions at physiologic pH and temperature permit evaluation of the effects of individual molecules on this crystallization process. We employed an assay to compare the effects of increasing concentrations of ceruloplasmin on calcium oxalate crystallization.
Addition of physiologic levels of ceruloplasmin resulted in a time and dose-dependent increase in absorption whereas addition of physiological levels of the control protein (bovine serum albumin) resulted in absorption reduction (Fig. 5). After 30 min, ceruloplasmin concentrations of 1.25 and 2.5 μm resulted in a 16.0- and 46.8-fold increase in absorption over the control conditions respectively. Supra-physiologic levels of bovine serum albumin (100 μm) demonstrated time-independent increased absorption.
Fig. 5.

In vitro calcium oxalate crystallization assay. Addition of 1.25 and 2.5 μm ceruloplasmin to a supersaturated artificial urine solution demonstrated a dose-dependent promotion of crystalization as measured by absorbance at 620 nm. All experimental curves and control 1, were generated by subtracting values obtained in parallel experiments in which sodium oxalate was omitted from the solution B. Control 1, combination of solutions A and B. In control 2, solution A with ceruloplasmin 2.5 μm was combined with solution B lacking sodium oxalate. Absorption values obtained by combining solution A with solution B lacking sodium oxalate were subtracted from these values. All results are from triplicate independent experiments.
DISCUSSION
Passing a kidney stone is painful and debilitating. In some patients kidney stones can result in kidney failure. Kidney stone disease affects around 10% of the population (1, 32, 33) worldwide and is increasing in prevalence (34). Epidemiologic studies have suggested that stone disease is linked to diet, fluid consumption, and obesity (30, 35–37), which impact both on kidney function and urinary composition. As a proximal fluid, with a simpler dynamic range than plasma, urine is particularly amenable to proteomic analysis for renal and urologic conditions. This is the first study to employ a comprehensive label-free platform to the urinary proteome of patients with urolithiasis. Among the differentially regulated proteins identified, ceruloplasmin, an acute phase copper binding metalloprotein, was validated independently in individual samples using ELISA. Ceruloplasmin also demonstrated a dose-dependent effect on calcium oxalate crystallization in vitro.
To date, few proteomics studies have been conducted to investigate stone disease. Surface-enhanced laser desorption/ionization-mass spectrometry has been used to compare the urinary protein profiles of stone forming men with controls (8) and a diagnostic algorithm developed from these results had a sensitivity of 72% and specificity of 100% although the proposed model was not tested against a blinded validation group. A study using two-dimensional electrophoresis and LC-MS/MS demonstrated that uromodulin is down-regulated in the urine of patients who have developed a renal calculus for the first time compared with healthy controls (20). However, recurrent stone formers and healthy controls had similar levels of urinary uromodulin making it unsuitable for use as a diagnostic marker in this group.
A potential challenge of using urine for clinical proteomic investigations is the variability in protein dilution according to fluid intake and individual physiology. Thus, normalization of samples is required and a standard protocol has yet to be established. Total protein to creatinine ratios on spot urine samples have been demonstrated to correlate with total urinary protein concentration from a 24-hour collection (38), and have been adopted by physicians in the detection of early renal impairment. Before normalization, stone formerss demonstrated significantly higher total protein to creatinine ratios than the nonstone formers (data not shown), because of increased total protein levels in the stone formers. This observation is consistent with both studies that have suggested total urinary protein levels are higher in stone formers than nonstone formers (8, 39) and studies in rats, which have correlated stone risk with increasing urinary protein concentration (40).
This increase in urinary protein concentration may be due to renal impairment and may form the basis of a link between nephrotoxicity and urolithiasis. To correct for this variation, we calculated the contributing volume of urine from each individual sample according to its total protein to creatinine ratio. This resulted in comparable total protein levels in the stone former and nonstone-former pools in both experiments. This is the first study to couple isoelectric off-gel fractionation with label-free nano-UPLC MSE tandem mass spectrometry analysis in the study of urinary proteomics. This platform allowed us to identify over 1000 proteins in urine and obtain relative quantitative data on over 250 proteins. This normalization protocol and proteomics platform is well suited to analyzing urine and could be readily applied to other conditions in which urine is a proximal fluid.
Proteomic analysis of calcium oxalate stones themselves have identified over 150 proteins including uromodulin, albumin, osteopontin, and a significant number of inflammatory proteins such as immunoglobulins, complement C3a, and kininogen (10, 41–44). Interestingly, we observed a down-regulation of osteopontin and α-1-microglobulin in the stone former pools in both our experiments, which have been shown to inhibit calcium oxalate crystal formation in vitro (45). We also observed a down-regulation of uromodulin in the stone-formers which has been reported previously (20), although this protein has been shown to both inhibit and promote stone crystallization (46). Among the proteins we observed to be up-regulated in the stone-formers, both ceruloplasmin and superoxide dismutase have been reported to be up-regulated in gene microarrays of rodent models of stone disease (21, 47). Both superoxide dismutase and ceruloplasmin have multiple cationic binding sites (48) and it has been suggested that urinary cationic concentration alters the solubility of stone crystals (49, 50). Ceruloplasmin has been best characterized for its role in copper transport and iron metabolism (9), however, we have not explored the role of these mechanisms in stone crystallization. Mutations in ceruloplasmin, which are associated with aceruloplasminaemia (51), abrogate copper binding and could be exploited to investigate whether this mechanism is relevant to stone crystallization.
Ceruloplasmin is also an acute-phase protein but its mechanistic role in the inflammatory response remains to be elucidated. It is unclear from our study whether the observed increase in urinary ceruloplasmin is a primary factor contributing to the crystallization of the stone or an inflammatory response to a stone in the urinary tract. Longitudinal studies to measure urinary ceruloplasmin levels in patients with recurrent stones in the presence and absence of urinary tract stones are required to address this question.
In conclusion, we have employed a method to control for natural variation in urine protein concentration, which has facilitated the qualitative and quantitative comparison of the urinary proteome between patients with urolithiasis and controls. Our study has confirmed previous findings and is the first to identify a protein that increases calcium oxalate crystallization formation in vitro. Further investigation of the role of this protein in vivo may have implications for both disease diagnosis and treatment.
Acknowledgments
We thank the members of the Kessler group and Prof Chris Pugh for helpful discussions.
Footnotes
* This study was supported by funding provided by the Biomedical Research Centre (NIHR) Oxford, and the Oxford Urology Foundation. The in-house mascot server used for proteomics data analysis is supported by the Computational Biology Research Group (CBRG) at the University of Oxford.
1 The abbreviations used are:
- FA
- formic acid
- MSE
- high/low collision energy switching
- NSF
- nonstone former
- SF
- stone former
- UPLC
- ultra-performance liquid chromatography
- MS/MS
- tandem MS
- LC-MS
- liquid chromatography-MS.
REFERENCES
- 1. Stamatelou K., Francis M., Jones C., Nyberg L., Curhan G. (2003) Time trends in reported prevalence of kidney stones in the United States: 1976–1994. Kidney Int. 63, 1817–1823 [DOI] [PubMed] [Google Scholar]
- 2. Miller N., Lingeman J. (1968) Management of kidney stones. BMJ. 334, 468–472 [DOI] [PMC free article] [PubMed] [Google Scholar]
- 3. Boyce W. (1968) Organic matrix of human urinary concretions. Am. J. Med. 45, 673–683 [DOI] [PubMed] [Google Scholar]
- 4. Sugimoto T., Funae Y., Rübben H., Nishio S., Hautmann R., Lutzeyer W. (1985) Resolution of proteins in the kidney stone matrix using high-performance liquid chromatography. Eur. Urol. 11, 334–340 [DOI] [PubMed] [Google Scholar]
- 5. Ryall R. (1993) The scientific basis of calcium oxalate urolithiasis. Predilection and precipitation, promotion and proscription. World J. Urol. 11, 59–65 [DOI] [PubMed] [Google Scholar]
- 6. Khan S., Kok D. (2004) Modulators of urinary stone formation. Front Biosci. 9, 450–82 [DOI] [PubMed] [Google Scholar]
- 7. Grover P., Resnick M. (1995) Evidence for the presence of abnormal proteins in the urine of recurrent stone formers. J. Urol. 153, 1716–1721 [PubMed] [Google Scholar]
- 8. Cadieux P., Beiko D., Watterson J., Burton J., Howard J., Knudsen B., et al. (2004) Surface-enhanced laser desorption/ionization-time of flight-mass spectrometry (SELDI-TOF-MS): a new proteomic urinary test for patients with urolithiasis. J. Clin. Lab. Anal. 18, 170–175 [DOI] [PMC free article] [PubMed] [Google Scholar]
- 9. Ryall R. (2004) Macromolecules and urolithiasis: parallels and paradoxes. Nephron. Physiol. 98, 37–42 [DOI] [PubMed] [Google Scholar]
- 10. Merchant M., Cummins T., Wilkey D., Salyer S., Powell D., Klein J., et al. (2008) Proteomic analysis of renal calculi indicates an important role for inflammatory processes in calcium stone formation. Am. J. Physiol. Renal. Physiol. 295, F1254–8 [DOI] [PMC free article] [PubMed] [Google Scholar]
- 11. Ryall R. (1997) Urinary inhibitors of calcium oxalate crystallization and their potential role in stone formation. World J. Urol. 15, 155–164 [DOI] [PubMed] [Google Scholar]
- 12. Adachi J., Kumar C., Zhang Y., Olsen J., Mann M. (2006) The human urinary proteome contains more than 1500 proteins, including a large proportion of membrane proteins. Genome Biol. 7, R80. [DOI] [PMC free article] [PubMed] [Google Scholar]
- 13. Ginsberg J., Chang B., Matarese R., Garella S. (1983) Use of single voided urine samples to estimate quantitative proteinuria. N. Engl. J. Med. 309, 1543–6 [DOI] [PubMed] [Google Scholar]
- 14. Wessel D., Flügge U. (1984) A method for the quantitative recovery of protein in dilute solution in the presence of detergents and lipids. Anal. Biochem. 138, 141–3 [DOI] [PubMed] [Google Scholar]
- 15. Xu D., Suenaga N., Edelmann M., Fridman R., Muschel R., Kessler B. (2008) Novel MMP-9 substrates in cancer cells revealed by a label-free quantitative proteomics approach. Mol. Cell Proteomics 7, 2215–2228 [DOI] [PMC free article] [PubMed] [Google Scholar]
- 16. Kulaksizoglu S., Sofikerim M., Cevik C. (2007) Impact of various modifiers on calcium oxalate crystallization. Int. J. Urol. 14, 214–218 [DOI] [PubMed] [Google Scholar]
- 17. Chutipongtanate S., Thongboonkerd V. Red blood cell membrane fragments but not intact red blood cells promote calcium oxalate monohydrate crystal growth and aggregation. J. Urol. 184, 743–749 [DOI] [PubMed] [Google Scholar]
- 18. Tsujihata M., Momohara C., Yoshioka I., Tsujimura A., Nonomura N., Okuyama A. (2008) Atorvastatin inhibits renal crystal retention in a rat stone forming model. J. Urol. 180, 2212–2217 [DOI] [PubMed] [Google Scholar]
- 19. Yoshioka I., Tsujihata M., Akanae W., Nonomura N., Okuyama A. (2011) Angiotensin type-1 receptor blocker candesartan inhibits calcium oxalate crystal deposition in ethylene glycol-treated rat kidneys. Urology, 2011 77, 1007.e9–1007.e14 [DOI] [PubMed] [Google Scholar]
- 20. Wai-Hoe L., Wing-Seng L., Ismail Z., Lay-Harn G. (2009) Proteomics and detection of uromodulin in first-time renal calculi patients and recurrent renal calculi patients. Appl. Biochem. Biotechnol. 159, 221–232 [DOI] [PubMed] [Google Scholar]
- 21. Chen D., Kaung H., Miller C., Resnick M., Marengo S. (2004) Microarray analysis of changes in renal phenotype in the ethylene glycol rat model of urolithiasis: potential and pitfalls. BJU Int. 94, 637–650 [DOI] [PubMed] [Google Scholar]
- 22. Mo L., Liaw L., Evan A., Sommer A., Lieske J., Wu X. (2007) Renal calcinosis and stone formation in mice lacking osteopontin, Tamm-Horsfall protein, or both. Am. J. Physiol. Renal Physiol. 293, F1935–43 [DOI] [PubMed] [Google Scholar]
- 23. Kleinman J., Wesson J., Hughes J. (2004) Osteopontin and calcium stone formation. Nephron Physiol. 98, 43–47 [DOI] [PubMed] [Google Scholar]
- 24. Tardivel S., Médétognon J., Randoux C., Kébédé M., Drüeke T., Daudon M., et al. (1999) Alpha-1-microglobulin: inhibitory effect on calcium oxalate crystallization in vitro and decreased urinary concentration in calcium oxalate stone formers. Urol. Res. 27, 243–249 [DOI] [PubMed] [Google Scholar]
- 25. Okada A., Yasui T., Hamamoto S., Hirose M., Kubota Y., Itoh Y., et al. (2009) Genome-wide analysis of genes related to kidney stone formation and elimination in the calcium oxalate nephrolithiasis model mouse: detection of stone-preventive factors and involvement of macrophage activity. J. Bone Miner. Res. 24, 908–924 [DOI] [PubMed] [Google Scholar]
- 26. Das L., Brunner H. (2009) Biomarkers for renal disease in childhood. Curr. Rheumatol. Rep. 11, 218–225 [DOI] [PubMed] [Google Scholar]
- 27. Kondo C., Minowa Y., Uehara T., Okuno Y., Nakatsu N., Ono A., et al. (2009) Identification of genomic biomarkers for concurrent diagnosis of drug-induced renal tubular injury using a large-scale toxicogenomics database. Toxicology 265, 15–26 [DOI] [PubMed] [Google Scholar]
- 28. Narita T., Hosoba M., Kakei M., Ito S. (2006) Increased urinary excretions of immunoglobulin g, ceruloplasmin, and transferrin predict development of microalbuminuria in patients with type 2 diabetes. Diabetes Care 29, 142–144 [DOI] [PubMed] [Google Scholar]
- 29. Kim C., Park J., Kim J., Choi C., Kim Y., Chung Y., et al. (2002) Elevated serum ceruloplasmin levels in subjects with metabolic syndrome: a population-based study. Metabolism 51, 838–842 [DOI] [PubMed] [Google Scholar]
- 30. Asplin J. (2009) Obesity and urolithiasis. Adv. Chronic Kidney Dis. 16, 11–20 [DOI] [PubMed] [Google Scholar]
- 31. Hennequin C., Lalanne V., Estepa L., Drueke T., Daudon M., Lacour B. (1997) Validation by image analysis of a turbidimetric method to study calcium oxalate crystallization. Clin. Nephrol. 48, 292–299 [PubMed] [Google Scholar]
- 32. Boyce C., Pickhardt P., Lawrence E., Kim D., Bruce R. (2010) Prevalence of urolithiasis in asymptomatic adults: objective determination using low dose noncontrast computerized tomography. J. Urol. 183, 1017–1021 [DOI] [PubMed] [Google Scholar]
- 33. Akoudad S., Szklo M., McAdams M., Fulop T., Anderson C., Coresh J., et al. (2010) Correlates of kidney stone disease differ by race in a multi-ethnic middle-aged population: The ARIC study. Prev. Med. 51, 416–420 [DOI] [PMC free article] [PubMed] [Google Scholar]
- 34. Pearle M., Calhoun E., Curhan G. (2005) Urologic diseases in America project: urolithiasis. J. Urol. 173, 848–857 [DOI] [PubMed] [Google Scholar]
- 35. Borghi L., Meschi T., Amato F., Briganti A., Novarini A., Giannini A. (1996) Urinary volume, water and recurrences in idiopathic calcium nephrolithiasis: a 5-year randomized prospective study. J. Urol. 155, 839–843 [PubMed] [Google Scholar]
- 36. Taylor E., Stampfer M., Curhan G. (2005) Obesity, weight gain, and the risk of kidney stones. JAMA 293, 455–462 [DOI] [PubMed] [Google Scholar]
- 37. Taylor E., Fung T., Curhan G. (2009) DASH-style diet associates with reduced risk for kidney stones. J. Am. Soc. Nephrol. 20, 2253–2259 [DOI] [PMC free article] [PubMed] [Google Scholar]
- 38. Ruggenenti P., Gaspari F., Perna A., Remuzzi G. (1998) Cross sectional longitudinal study of spot morning urine protein:creatinine ratio, 24 hour urine protein excretion rate, glomerular filtration rate, and end stage renal failure in chronic renal disease in patients without diabetes. BMJ 316, 504–509 [DOI] [PMC free article] [PubMed] [Google Scholar]
- 39. Schwille P., Manoharan M., Schmiedl A. (2005) Is idiopathic recurrent calcium urolithiasis in males a cellular disease? Laboratory findings in plasma, urine and erythrocytes, emphasizing the absence and presence of stones, oxidative and mineral metabolism: an observational study. Clin. Chem. Lab. Med. 43, 590–600 [DOI] [PubMed] [Google Scholar]
- 40. Tannehill-Gregg S., Dominick M., Reisinger A., Moehlenkamp J., Waites C., Stock D., et al. (2009) Strain-related differences in urine composition of male rats of potential relevance to urolithiasis. Toxicol. Pathol. 37, 293–305 [DOI] [PubMed] [Google Scholar]
- 41. Canales B., Anderson L., Higgins L., Slaton J., Roberts K., Liu N., et al. (2008) Second prize: Comprehensive proteomic analysis of human calcium oxalate monohydrate kidney stone matrix. J. Endourol. 22, 1161–1167 [DOI] [PubMed] [Google Scholar]
- 42. Mushtaq S., Siddiqui A., Naqvi Z., Rattani A., Talati J., Palmberg C., et al. (2007) Identification of myeloperoxidase, alpha-defensin and calgranulin in calcium oxalate renal stones. Clin. Chim. Acta. 384, 41–47 [DOI] [PubMed] [Google Scholar]
- 43. Kaneko K., Yamanobe T., Nakagomi K., Mawatari K., Onoda M., Fujimori S. (2004) Detection of protein Z in a renal calculus composed of calcium oxalate monohydrate with the use of liquid chromatography-mass spectrometry/mass spectrometry following two-dimensional polyacrylamide gel electrophoresis separation. Anal. Biochem. 324, 191–196 [DOI] [PubMed] [Google Scholar]
- 44. Kaneko K., Yamanobe T., Onoda M., Mawatari K., Nakagomi K., Fujimori S. (2005) Analysis of urinary calculi obtained from a patient with idiopathic hypouricemia using micro area x-ray diffractometry and LC-MS. Urol. Res. 33, 415–421 [DOI] [PubMed] [Google Scholar]
- 45. Atmani F., Khan S. (1999) Role of urinary bikunin in the inhibition of calcium oxalate crystallization. J. Am. Soc. Nephrol. 10 Suppl 14, S385–8 [PubMed] [Google Scholar]
- 46. Knörle R., Schnierle P., Koch A., Buchholz N., Hering F., Seiler H., et al. (1994) Tamm-Horsfall glycoprotein: role in inhibition and promotion of renal calcium oxalate stone formation studied with Fourier-transform infrared spectroscopy. Clin. Chem. 40, 1739–1743 [PubMed] [Google Scholar]
- 47. Okada A., Nomura S., Higashibata Y., Hirose M., Gao B., Yoshimura M., et al. (2007) Successful formation of calcium oxalate crystal deposition in mouse kidney by intraabdominal glyoxylate injection. Urol. Res. 35, 89–99 [DOI] [PubMed] [Google Scholar]
- 48. Bento I., Peixoto C., Zaitsev V., Lindley P. (2007) Ceruloplasmin revisited: structural and functional roles of various metal cation-binding sites. Acta Crystallogr. D 63, 240–248 [DOI] [PMC free article] [PubMed] [Google Scholar]
- 49. Bilobrov V., Bogdan N., Bilobrov S., Roy A. (2002) Influence of cations and total protein of urine on the solubility and probability of urate stone formation in kidneys. Urol. Int. 68, 118–121 [DOI] [PubMed] [Google Scholar]
- 50. Atakan I., Kaplan M., Seren G., Aktoz T., Gül H., Inci O. (2007) Serum, urinary and stone zinc, iron, magnesium and copper levels in idiopathic calcium oxalate stone patients. Int. Urol. Nephrol. 39, 351–356 [DOI] [PubMed] [Google Scholar]
- 51. di Patti M., Maio N., Rizzo G., De Francesco G., Persichini T., Colasanti M., et al. (2009) Dominant mutants of ceruloplasmin impair the copper loading machinery in aceruloplasminemia. J. Bio. Chem. 284, 4545–4554 [DOI] [PubMed] [Google Scholar]