

Abstract
Studies of the Plasmodium falciparum transcriptome have shown that the tightly controlled progression of the parasite through the intra-erythrocytic developmental cycle (IDC) is accompanied by a continuous gene expression cascade in which most expressed genes exhibit a single transcriptional peak. Because the biochemical and cellular functions of most genes are mediated by the encoded proteins, understanding the relationship between mRNA and protein levels is crucial for inferring biological activity from transcriptional gene expression data. Although studies on other organisms show that <50% of protein abundance variation may be attributable to corresponding mRNA levels, the situation in Plasmodium is further complicated by the dynamic nature of the cyclic gene expression cascade. In this study, we simultaneously determined mRNA and protein abundance profiles for P. falciparum parasites during the IDC at 2-hour resolution based on oligonucleotide microarrays and two-dimensional differential gel electrophoresis protein gels. We find that most proteins are represented by more than one isoform, presumably because of post-translational modifications. Like transcripts, most proteins exhibit cyclic abundance profiles with one peak during the IDC, whereas the presence of functionally related proteins is highly correlated. In contrast, the abundance of most parasite proteins peaks significantly later (median 11 h) than the corresponding transcripts and often decreases slowly in the second half of the IDC. Computational modeling indicates that the considerable and varied incongruence between transcript and protein abundance may largely be caused by the dynamics of translation and protein degradation. Furthermore, we present cyclic abundance profiles also for parasite-associated human proteins and confirm the presence of five human proteins with a potential role in antioxidant defense within the parasites. Together, our data provide fundamental insights into transcript-protein relationships in P. falciparum that are important for the correct interpretation of transcriptional data and that may facilitate the improvement and development of malaria diagnostics and drug therapy.
Malaria is a devastating disease caused by parasitic protozoa of the genus Plasmodium, with Plasmodium falciparum representing the most lethal species. Despite some welcome recent reductions in malaria morbidity and mortality, there were an estimated 243 million cases and up to one million deaths worldwide in 2008 (1). In addition, parasite resistance to currently available drugs is spreading while intense efforts to develop an effective and widely applicable vaccine have so far come up empty-handed. Hence, to keep the momentum in combating malaria, a much broader understanding of the parasite's biology that may lead to new intervention strategies is crucial.
During their complex life cycle, malaria parasites undergo extensive biochemical and physiological transformations that represent functional adaptations of each developmental stage to its host environment. Some forms, such as merozoites in the vertebrate host and sporozoites in the mosquito salivary glands, are specialized in host cell invasion whereas liver and blood stage schizonts and oocysts are well adapted for efficient replication and cell division. Over the last decade extensive transcriptional analyses have established that the progression of the life cycle is associated with broad transcriptional regulation that affects essentially the entire Plasmodium genome (2–5). The best studied example is the 48-hour asexual intra-erythrocytic developmental cycle (IDC)1 during which the parasites expand via multiple rounds of division (schizogony) within the blood of the vertebrate host. The extent of this transcriptome variability—whereby more than 50% of all genes exhibit a cyclic expression pattern with typically one peak in transcript abundance during the IDC—is unique among eukaryotes (2, 5). The transcription studies of the Plasmodium life cycle have given rise to the notion of a “just-in-time” induction of gene expression whereby the transcription of most genes occurs just at the time when they are needed. Yet this model is based on the implicit and so far unproven assumption that changes in transcript abundance translate instantly and directly into changes in the corresponding protein abundance. Furthermore, the notion of “just-in-time” gene expression has been challenged by several studies that show translational repression of genes during sexual stage development (in gametocytes) (6, 7), of liver stage-specific transcripts in salivary gland sporozoites (8), and of genes involved in antigenic variation of the asexual blood forms of the parasites (the var gene family) (9). In addition, the enzyme DHFR-TS e.g. has been shown to be up-regulated on a translational but not on a transcriptional level following drug treatment (10). Other studies have evaluated the links between transcription and translation during the Plasmodium life cycle progression in more general terms by employing different types of large scale proteomics assays (7, 11–19). These studies thus complemented the transcriptome analyses and demonstrated that each developmental stage of Plasmodium is characterized also by a unique protein content that is linked to the specialized functionalities of that particular stage. Intriguingly, results from essentially all of these studies implied a complex relationship between transcripts and corresponding proteins in Plasmodium, with the prevailing trend being a time delay between the steady-state concentrations of mRNA transcripts and the corresponding protein products. It was therefore proposed that Plasmodium cells employ an intricate system of post-transcriptional regulation that modulates the overall gene expression pattern associated with the parasite life cycle. Yet with the exception of special cases (e.g. var-gene expression) the nature of this presumed widespread post-transcriptional regulation during the IDC has not been thoroughly investigated. Neither has the extent of the transcript-protein discrepancies been mapped in detail on a larger scale, because most studies analyze broadly defined parasite stages with low temporal resolution (i.e. rings, trophozoites, and schizonts). Hence, examining the Plasmodium proteome and transcriptome in a high resolution temporal manner, e.g. in a time course with a large number of time points from a highly synchronous parasite population, would provide a solid baseline for a better evaluation of the role of post-transcriptional regulation during the IDC in malaria parasites. Such a study would also provide crucial information for a more accurate interpretation of transcriptome analyses, in particular to estimate the impact of changes in mRNA levels on parasite physiology.
Functional analyses of the Plasmodium proteome indicate that human host protein factors play crucial roles in specific processes of parasite biochemistry and physiology. One such remarkable example is the human protease calpain-1 whose activity is essential for egress of the P. falciparum parasites from the host erythrocyte at the end of the IDC (20). Maybe even more intriguingly, host proteins and their enzymatic activity have been reported to be present within the parasite cytoplasm during the IDC. These examples include superoxide dismutase and catalase (21–23), delta-aminolevulinate dehydratase (ALAD) (24), ferrochelatase (25), and peroxiredoxin 2 (26). Although some of the earlier reports may have been somewhat controversial, the latest work by Koncarevic et al. (2009) firmly established the localization of an enzymatically active human protein (peroxiredoxin 2) within the parasite cytoplasm and suggested a crucial functional role of this enzyme for the parasite (26). Human proteins are also listed in some larger proteomic inventories of P. falciparum (17, 18). Although these human proteins include some cytoskeletal proteins that may be detected because they are part of the insoluble erythrocyte material (the red blood cell “ghosts”) that remains even after the separation of the parasites from the host erythrocytes, others include soluble cytosolic or secreted human enzymes and chaperones such as flavin reductase (biliverdin reductase B), paraoxonase 1, thioredoxin peroxidase B, T-complex protein 1 subunit alpha, and heat shock proteins (17, 18). Although direct evidence for an intraparasitic localization of these proteins has so far been missing these results suggest that the Plasmodium parasite may scavenge a larger spectrum of human proteins and use them for crucial functions associated with parasite biology.
In this study, we employ DNA microarrays and a quantitative proteomics technique (two-dimensional differential gel electrophoresis, 2D-DIGE) to analyze the transcriptome and proteome of the 48-hour P. falciparum IDC at 2 h resolution. Our data demonstrate that, in analogy to the transcriptome, proteins also have cyclic abundance profiles and that functional groups of proteins exhibit similar profiles. Based on comparisons of 237 pairs of transcript and corresponding protein profiles we further show that in most cases the wave-like protein and corresponding transcript abundance profiles are not correlated “one-to-one” but instead are phase-shifted along the time axis by a median time lapse of 11 h. Our analyses suggest that these observed transcript-protein discrepancies are caused largely by the dynamics of translation and protein degradation. Surprisingly, more than 20 proteins of the human host also show cyclic abundance variations over the IDC that sometimes closely mirror the abundance of their parasite homologs. We confirm the presence of five of these human proteins (catalase, superoxide dismutase 1, flavin reductase, paraoxonase, and lactoferrin) within the parasites by immunofluorescence microscopy and suggest that malaria parasites use these and other enzymes of the human host for antioxidant defense.
EXPERIMENTAL PROCEDURES
Cell Culture and Parasite Sampling
Parasites of P. falciparum strain Dd2 (MR4, http://www.mr4.org/) were initially grown at 1–14% parasitaemia in plastic flasks under standard conditions (27) and as described previously (13). Parasites were synchronized by sorbitol treatments (5% sorbitol for 5–10 min at room temperature) over several generations at 4–5 or at 20 h after the start of erythrocyte invasion. After a final round of erythrocyte invasion in flasks the culture was expanded to a total volume of 6.5 liters and transferred to a biofermentor where it was maintained at a parasitaemia of 10.3%. Samples for both mRNA and protein abundance determination were taken every 2 h throughout one entire IDC. For further details please see the Supplemental Data.
Two-dimensional Protein Gel Electrophoresis and DIGE
Protein preparations were carried out as described (13). Further details and the DIGE CyDye labeling regimen employed are described in the Supplemental Data. Isoelectric focusing (IEF) was performed using 24 cm Immobiline DryStrips (GE Healthcare) with pH ranges of pH3–7NL (non-linear) and pH6–9. For DIGE analysis strips were loaded with 50 μg protein per CyDye (i.e. a total of 150 μg protein per strip) during rehydration, whereas for preparative silver-stained gels each strip was loaded with 500–1000 μg protein. Addition of IPG buffer and DeStreak Solution (GE Healthcare), strip rehydration, IEF, strip equilibration, and second-dimension protein separation by SDS-PAGE were carried out as described (13). Gels were scanned on a Typhoon Trio scanner (GE Healthcare) at 100 μm resolution and the resulting images analyzed with DeCyder 2D software, Version 6.5 (GE Healthcare). Further details can be found in the Supplemental Data.
Two-dimensional Protein Gel Spot Identification by Tandem Mass Spectrometry
Protein spots were excised from preparative gels and further processed either manually or in 96-well microtitre plates using a Shimadzu Xcise gel processing robot. The protocol to prepare the peptides for, matrix-assisted laser desorption ionization/time-of-flight (MALDI-TOF(/TOF)) mass spectrometry (i.e. destaining, washing, in-gel trypsin-digestion, concentration using micro-C18-ZipTips, and spotting onto MALDI target plates) was as described (13) except that here 0.1% trifluoroacetic acid was used instead of 0.5% formic acid during the ZipTip-procedure. Peptide mass fingerprints and tandem MS (MS/MS) fragment ion masses were recorded by MALDI-TOF/TOF mass spectrometry with a 4800 Plus MALDI TOF/TOF Analyzer (Applied Biosystems, Forster City, CA) at the proteomics core center of Nanyang Technological University, Singapore. Peptide and ion masses were converted into peak lists using Mascot Distiller (version 2.2.1; www.matrixscience.com; Matrix Science, London, UK) with default parameters except requiring a minimum signal to noise ratio S/N = 3 for peak picking (MS and MS/MS). Peak lists were queried against both general (GenBank non-redundant) and custom-made protein databases including P. falciparum sequences from PlasmoDB (strain 3D7; http://plasmodb.org) and the Broad Institute (strain Dd2; http://www.broadinstitute.org) as well as human proteins (GenBank, NCBI) using Mascot Server software (version 2.2.1; Matrix Science). The search parameters used with Mascot were as described (13) except that peptide tolerance was set to between ±60 ppm and ±350 ppm depending on the quality of MS-calibration as observed with a bovine serum albumin peptide standard during the same MS-run. Further details are provided in the Supplemental Data.
Microarray Analysis
RNA extraction, cDNA synthesis and labeling, spotted long oligonucleotide microarray hybridizations against a reference RNA pool, as well as data acquisition were carried out as described (2, 13, 28). Linear normalization and subsequent filtering for quality control were carried out using Acuity 4.0 (Axon Instruments), with the median pixel intensity of a spot required to be greater than the background pixel intensity + 100 (in both red and green channel) for the spot to be included in the analysis. Data relating to one gene obtained with different oligonucleotide probes were averaged, and genes for which data for six or more of the 24 time points were missing were excluded from the analysis. The complete microarray data are available at the Gene Expression Omnibus database at the National Center for Biotechnology Information (GEO: GSE24416) (pre-publication access to the data is available via http://www.ncbi.nlm.nih.gov/geo/query/acc.cgi?token = fralxmsogkgmcda&acc = GSE24416).
Immunofluorescence Assays (IFA) and Western Blot Analysis
Human proteins were detected by IFA and on Western blots using the following commercial primary antibodies (Santa Cruz Biotechnology, Santa Cruz, CA): sc-11407 anti-SOD-1 (FL-154); sc-25791 anti-PON1–3 (H-300); sc-25622 anti-lactoferrin (H-65); sc-54576 anti-BLVRB (P-15); sc-34281 anti-catalase (G-16). For IFA, fresh blood smears of parasitized erythrocytes were fixed in fresh methanol for 1min at ambient temperature, air-dried, blocked (3% bovine serum albumin in phosphate-buffered saline), labeled with primary and secondary antibodies (anti-rabbit conjugated to Alexa 594 and anti-goat conjugated to Alexa 488, Invitrogen) as well as with DAPI DNA stain, and observed using an Olympus fluorescence microscope. For Western blots, 30 μg protein from saponin-lysed parasites in SDS-loading buffer including 5% β-mercaptoethanol were loaded per lane and separated by SDS-PAGE. After overnight transfer to nitrocellulose, visualization with Ponceau stain, and blocking in 5% milk powder (Bio-Rad, Hercules, CA) in TBS-T buffer, blots were incubated with primary and secondary antibodies (anti-rabbit conjugated to horseradish peroxidase, GE Healthcare) and visualized using SuperSignal chemiluminescent substrates (Pierce, Waltham, MA) and x-ray film (Kodak, Rochester, NY).
Data Analysis
A fourth-degree polynomial curve was fitted to the data points of every mRNA and protein abundance profile using the Perl package “PDL::Fit::Polynomial” from CPAN (http://search.cpan.org/). Fourier transformation was carried out using the R programming language and by KNN-imputing missing data using the package “impute” which is available from CRAN (http://cran.r-project.org/). The “expected MW” (i.e. the theoretical molecular weight or mass) and the “expected pI” (i.e. the theoretical isoelectric point) of protein sequences were calculated using the Perl packages “Bio::Tools::pICalculator” and “Bio::Tools::SeqStats” (http://www.bioperl.org). The “apparent MW” of protein spots on the two-dimensional gels was determined based on comparison with a protein marker comprising eight visible molecular masses (17–130 kDa; Fermentas SM0671). The “apparent pI” of protein spots was exported from DeCyder 2D after calibration with several proteins that appeared as single strong spots on the gel. Absolute protein abundance was estimated for each protein spot by ranking “normalized spot volumes” (calculated by DeCyder 2D). A measure of absolute protein abundance of rings, trophozoites, and schizonts was then calculated by averaging the ranks per spot relating to protein samples from time points 1–8 (rings), 9–16 (trophozoites), and 17–24 (schizonts), followed by assigning the ranks to one of 10 bins of absolute abundance with bin 10 representing the most abundant protein spots. Relative abundance profiles per protein (as opposed to relative abundance profiles per individual protein spot/isoform) were determined by calculating a weighted average of the corresponding data points from the individual protein isoforms. Please see the Supplemental Data for further details.
Mathematical Modeling of Protein Abundance
The model employed to calculate protein abundance based on (hypothetical) mRNA abundance derived from the differential equation
where ktransl and kdegrad represent gene- and protein isoform-specific coefficients of translation and protein degradation, respectively (29), such that for a given time point tx the protein abundance was determined as follows:
This model was employed to calculate protein abundance based on either (1) a sine curve as a substitute for a typical log2-transformed mRNA abundance profile (for supplemental Fig. S5) or on (2) actual observed mRNA profiles (for Figs. 4F–4H and supplemental Fig. S6). Running the model on a given pair of mRNA and protein abundance profiles the algorithm calculated many protein abundance profiles based on the mRNA profile while each time (1) varying the rates of translation and protein degradation ktransl and kdegrad, and (2) estimating the congruence between the modeled protein profile PModel and the respective observed protein profile PObs by computing a model score as
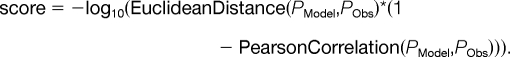 |
The algorithm thus systematically varied the two rates of translation and protein degradation in an iterative manner to maximize the model score. For further details please see the Supplemental Data.
Fig. 4.

Transcript and protein abundance tk;4profiles, transcript-protein correlations, and mathematical modeling. A–C show log2-transformed polynomial-fitted (“smoothed”) abundance profiles for individual proteins. The dots indicate the averaged raw data values while the lines represent polynomial curves fitted through the data. D, The distribution of Pearson correlation coefficients in pairwise comparisons of protein profiles and their corresponding transcript abundance profiles. The black bars represent the Pearson correlation coefficients as calculated from the original transcript and protein abundance data. The gray bars indicate the pairwise Pearson correlations when all protein profiles are shifted ahead-in-time (to the left along the time-axis) by 12 h. The red bars represent the Pearson correlations of the transcript abundance profiles versus the derivative of the protein abundance profiles. Similar results were obtained (data not shown) when transcript abundance was compared with profiles of a combined measure of protein abundance from all identified isoforms of a given protein (see Experimental Procedures and the panels “Combined Protein Data” in supplemental Fig. S4). E, A simple mathematical algorithm was employed to test whether the observed protein abundance profiles could be modeled from the observed mRNA abundance data (see main text and Experimental Procedures for further details). The graph shows the distribution of model scores for all 237 full-length protein isoforms in comparison to a bootstrap experiment (see text). F–H show three examples of modeled protein abundance profiles, i.e. the graphs for the best (F), an intermediate (G), and the worst fit of modeled to observed protein profiles. Graphs of the modeled protein profiles for all 237 protein isoforms included in these analyses are presented in supplemental Fig. S6.
RESULTS
RNA and Protein Expression Profiling of the IDC
In this study, RNA and protein expression profiles were generated from a single tightly synchronized P. falciparum culture that allowed measurements of both mRNA and protein abundance from identical samples collected at 2-hour intervals throughout the 48 h of the IDC. The starting biofermenter culture consisted of 6.5 liters medium containing 3% purified human erythrocytes, of which 8.4% were infected with P. falciparum ring stage parasites (see Experimental Procedures). The progression of the synchronous parasite population through the intraerythrocytic parasite stages was monitored by microscopy of Giemsa stained blood smears (Fig. 1). Using the spotted oligonucleotide DNA microarray that represents all 5554 genes of P. falciparum (28), we obtained high quality IDC transcription profiles for 4670 genes (Fig. 1, supplemental Table S1). The newly assembled transcriptome correlates well with the previously reported IDC transcriptomes (2, 30) with >85% of gene expression profiles exhibiting a Pearson correlation coefficient >0.5 in pairwise comparisons. The average amplitude of the expression profiles in this transcriptome is 4.3-fold (±2.4). This is higher than the average amplitudes of two of the three previously assembled transcriptomes, which are 3.6-fold (±1.9) for 3D7 and 3.5-fold (±2.4) for Dd2, but lower than the average amplitude of 9.4-fold (±2.7) for Hb3. The high reproducibility of the transcription profiles and, in particular, the mRNA amplitudes is a direct reflection of the parasite culture synchronicity. This indicates that similar to previous transcriptomes, this biofermentor culture consisted of highly synchronized cells with ∼80% of the parasite cells originating from a narrow (2 h) invasion window (2, 30). Throughout the experiment, the Plasmodium culture maintained its synchronicity throughout the 48 h IDC with both morphological stage transitions (rings to trophozoites, and trophozoites to schizonts) occurring within 4–5 h windows (Fig. 1).
Fig. 1.

Overview of the transcript and protein abundance profiles. The left half of the central main figure depicts 4,670 transcript abundance profiles whereas the right half shows 1183 protein abundance profiles. In these central panels each line represents one distinct gene (for the transcripts) on the left or one protein isoform on the right, whereas the 24 columns indicate the time point (in hpi = hours postinvasion) of the sample. Importantly, in this figure the lines representing transcripts (on the left) and proteins (on the right) do not correspond to one another, and the abundance profiles were sorted according to their Fourier phase. The profiles shown derive from log2-transformed and mean-centered quantitative data that were polynomial-fitted and then converted back to a nonlogarithmic scale. The color scale indicating relative transcript or protein abundance is provided at the bottom of the figure, whereas the progression of the parasite population through the IDC is indicated at the top. Six examples of transcript abundance profiles and selected corresponding protein abundance profiles are shown at the sides. Lower left panel: the distribution of relative abundance amplitudes. Lower right panel: the distribution over time of abundance peaks as calculated by Fourier transformation and as evidenced by the major peak of the polynomial fit.
For the quantitative proteomic analyses we employed the 2D-DIGE protein gel approach. Total parasite protein lysates were prepared by first releasing P. falciparum cells from their host erythrocytes using saponin. Saponin lysis is presently the most robust and reliable fractionation technique for generating cytoplasmic protein fractions from all IDC developmental stages. Hence this approach provides highly representative samples for quantitative measurements of protein abundance, and in this time course experiment it allowed us to carry out rigorous RNA-protein abundance comparisons. Focusing on the cytoplasmic fraction also reduced the protein sample complexity by eliminating proteins transported to the parasite-derived structures in the host cell cytoplasm that were not the subject of this study. Protein lysates were labeled with CyDye fluorophores and resolved by two-dimensional polyacrylamide gel electrophoresis (2D-PAGE). The subsequent laser scanning provides robust quantitative measurements of all protein isoforms resolved by the two-dimensional gel (13, 31). Cy2-labeled protein standards (mixtures of individual protein samples) included on every gel facilitated the gel-to-gel reproducibility of the quantitative measurements and the matching of protein spots across all gels of the experimental time course. The entire data set of protein abundance across the P. falciparum IDC was derived from a total of 66 large-format 2D-DIGE gels (24 cm wide) that were run at two different pH ranges (pH3–7NL and pH6–9) (supplemental Fig. S1). Similar to the transcript profiles, the protein abundance profiles of the 1183 protein isoforms detected by 2D-DIGE exhibit an unambiguous periodicity over the 48-hour IDC (Fig. 1, right panel). The majority of both transcripts and protein isoforms exhibit one peak in abundance during the IDC, and both data sets have a similar median amplitude of profiles (5.4-fold and 5.6-fold for the transcripts and protein isoforms, respectively) (Fig. 1, lower left panel). In contrast, the proteome profiles differ from the transcriptome regarding the timing of their abundance peaks. The transcripts exhibit an even progression through the 48 h of the IDC whereas the protein profiles show a more discontinuous pattern with a trend for maximum abundance to occur either at the trophozoite and schizont transition (26–34 hpi) or at early ring stage (6–14 hpi) (Fig. 1, lower right panel). This suggests that the parasites undergo a significant transition in late ring stage that is marked by substantial synthesis of many proteins that replace the original protein content of the early ring stage. This switch in protein content likely represents a major transition in the metabolic and cellular activities of the parasite.
Analysis of the IDC Proteome
We carried out protein spot identification using MALDI-TOF/TOF mass spectrometry. In total, we identified 412 protein spots of which 363 and 49 spots represent 125 P. falciparum and 24 human proteins, respectively (supplemental Figs. S2 and S3). Each parasite protein identified in our analysis therefore corresponds on average to 2.9 discernible protein isoforms. This likely reflects extensive post-translational modifications that occur during the P. falciparum IDC. In accordance with the two-dimensional gel methodology the majority of the identified proteins represent soluble and highly abundant proteins with molecular weights between 15 and 143 kDa (supplemental Table S2). Fig. 2 presents an overview set of 95 parasite proteins (represented by 296 protein isoforms and corresponding transcript abundance profiles) that belong to 10 key functional groups representing major biochemical and cellular pathways in the parasite (for the entire data set see supplemental Fig. S4).
Fig. 2.


Expression and other data arranged by major groups of protein function as indicated on the left. The two main columns titled “mRNA” and “Protein” show log2-transformed relative transcript and protein abundance based on oligonucleotide microarray and 2D-DIGE data. Within each of the functional groups the protein isoforms are subsequently sorted according to their molecular weight as apparent by 2D-gel electrophoresis, which is presented as a ratio of apparent/expected molecular weight (column “MW”). Black and gray bars indicate “full-length” and “truncated” protein isoforms, respectively (see Experimental Procedures). An estimation of absolute protein abundance for each protein isoform observed on the two-dimensional gels has been carried out independently for ring-, trophozoite-, and schizont-stage parasites (column “Protein abund.”). The correlation between each pair of transcript and corresponding protein abundance profiles is indicated by their respective peak time difference (i.e. the difference of the peak time of the protein profile minus the peak time of the transcript profile; column “Peak time diff.”), their respective Pearson correlation coefficient (column “Correlation RNA and prot”), and the Pearson correlation coefficient of the transcript abundance profile and the mathematical derivative of the corresponding protein abundance profile (column “Correlation RNA and protDeriv”). The best modeling score (see main text and Experimental Procedures) is shown with scores greater than the high-quality cutoff score of 0.8 highlighted in orange (column “Model score”). The difference between the expected and the apparent (as estimated from the two-dimensional gels) isoelectric point of each protein isoform is depicted in the last column. For abbreviations of protein names please refer to supplemental Table S2.
Because the abundance profiles of transcripts that encode proteins of similar function are known to be well correlated (2, 5), we also sought to assess the correlation of the abundance profiles of proteins that share similar functions. To do so we calculated the median of all pairwise Pearson correlations for all abundance profiles that belong to a given functional group (supplemental Table S4). For glycolysis e.g. the median Pearson correlation for all 62 respective protein profiles is 0.427, whereas the median Pearson correlation for the corresponding nine mRNA abundance profiles is 0.981. Importantly, though, when putative full-length protein isoforms were distinguished from apparently truncated isoforms (see Experimental Procedures) and the analysis was repeated with only the 44 full-length glycolytic protein isoforms the median Pearson correlation increased to 0.917, i.e. almost as high as for the transcripts. Similar results were obtained (supplemental Table S4) when the analysis was performed on a combined measure of protein abundance from multiple isoforms of a given protein (see Supplemental Experimental Procedures and Table S3). Summarizing these analyses, the median value of the Pearson correlation coefficients for the combined full-length protein abundance profiles of all 10 functional groups is nearly as high (rP = 0.854) as that for the corresponding transcript profiles (rP = 0.890) (supplemental Table S4). This shows that full length proteins that serve the same biochemical pathway or physiological function are almost as highly coordinated in their abundance within the cell as the corresponding mRNA transcripts. Moreover, these analyses also indicate that the full length protein isoforms differ significantly in their abundance pattern from the respective truncated isoforms.
Estimating absolute protein abundance based on protein spot intensity on 2D-gels, we find that the molecular chaperones, the glycolytic enzymes, and enzymes related to methionine and polyamine metabolism represent the most abundant parasite proteins expressed throughout the IDC. In addition, proteins that are part of or are involved in ribosome formation and protein synthesis, hemoglobin digestion, the proteasome, and purine and pyrimidine synthesis exhibited somewhat lower expression levels throughout the IDC. We also detected a number of proteins involved in parasite specific functions including proteins associated with the remodeling of the host cell cytoplasm and with host cell invasion (Fig. 2).
The group of molecular chaperones in our analysis comprises 15 heat shock proteins and T-complex protein 1-associated proteins including the homolog of ER-resident binding immunoglobulin protein (BiP; PFI0875w), a mitochondrial HSP60 (PF10_0153) (32), as well as proteins previously detected in the parasitophorous vacuole, i.e. a peptidyl-prolyl isomerase (PFL2275c) and a disulfide isomerase (MAL8P1.17) (33). Full length isoforms of these proteins exhibit a sharp increase in their abundance between 14–24 hpi, reaching the peak 10–12 h later and subsequently remaining at high levels during the second half of the IDC. Similar expression patterns can be observed for the majority of full length proteins associated with glycolysis, methionine and polyamine metabolism, purine and pyrimidine synthesis, and hemoglobin degradation. These results suggest that the main metabolic and biosynthetic pathways are highly coordinated, with protein expression being initiated in late ring stage and protein abundance being sustained for the rest of the IDC. In addition, we identify a large number of truncated isoforms that are likely to originate from the full-length proteins associated with these functions. In contrast to their full-length counterparts, the truncated isoforms show more variable abundance profiles with the majority of these peaking in early rings (6–16 hpi) (Fig. 2). It is currently unclear whether these isoforms represent intermediate degradation products or whether they facilitate specific metabolic or other cellular functions.
The 10 proteasome subunits detected in our analysis represent examples of highly abundant proteins that show a relatively small amplitude of change across the IDC. The absolute abundance estimates place eight of these proteins within the top 30% most abundant proteins whereas seven of them exhibit an amplitude <2.5-fold. Interestingly, the less abundant Skp1 family protein (MAL13P1.337; absolute abundance within the bottom 30–40%), which in analogy to other eukaryotes may play a role in specifically targeting proteins for proteasome-dependent degradation, exhibits an abundance profile that follows closely its corresponding mRNA profile (Pearson correlation coefficient rP = 0.987; Fig. 4B), with an 8.4-fold amplitude of change. Together, this suggests that the proteasome is present at relatively constant and high abundance throughout the IDC but that its activity is modulated by specific accessory factors (such as PfSkp1) whose protein expression is tightly linked to the corresponding transcript abundance.
We also observed 16 erythrocyte invasion-related proteins in our analysis. Of these, 7 are present as at least one full-length protein isoform (actin I, actin-like protein homolog ALP1, GAP50, profilin, RON4, SERA-5, and PFD1130w) expressed mainly in late schizonts, with their protein profiles relatively closely matching their mRNA abundance profiles. In contrast, other invasion molecules such as CLAG3.1, the rhoptry-associated proteins (RAPs), the high molecular weight rhoptry proteins (RhopHs), merozoite surface proteins (MSP1 and MSP7) were encountered only as truncated protein isoforms that exhibit abundance maxima mostly in early ring stage despite their mRNA peaking in late schizont stage. These short polypeptides are likely a result of proteolytic processing of the respective full-length proteins during merozoite maturation and/or the invasion process. It is noteworthy that many of these truncated isoforms remain detectable throughout the IDC (Fig. 2), suggesting that they may carry out additional functions beyond their role in host cell invasion. Such functions have already been ascribed e.g. to the C-terminal fragment of MSP1 (MSP1–19) (34) and in Toxoplasma gondii to AMA1 (35).
Human Proteins Within the Parasite
Intriguingly, apart from parasite proteins we identify 24 human proteins that are present in significant quantities in the parasite protein lysates and exhibit specific abundance profiles across the IDC (Fig. 3C and supplemental Fig. S4 and Table S2). An intraparasitic localization could indicate a potential functional role of these human proteins for the parasite, as has previously been reported for the human erythrocyte protein peroxiredoxin 2, which is imported into the P. falciparum cytosol in a functionally active form (26). To test whether the host proteins identified by 2D-DIGE are indeed located in the parasite cytoplasm, we carried out immunofluorescence microscopy with infected erythrocytes with antibodies against five of these proteins: superoxide dismutase 1 (SOD1), paraoxonase (PON; while the mass spectrometry analysis had unambiguously identified human PON1 but neither PON2 nor PON3, the commercial antibody cannot distinguish between PON1, PON2, and PON3), lactoferrin (lactotransferrin), biliverdin reductase B (BLVRB), and catalase (Fig. 3A). In all five cases the human proteins show strong accumulation within the parasites with the immunofluorescence (IF) staining pattern suggesting their presence throughout the parasite cytoplasm. Interestingly there is a considerably stronger IF signal for the human proteins in the parasites than in the red blood cells. This is especially evident at the developmental stages where the human proteins show their peak abundance in the parasites (e.g. in rings for lactoferrin, trophozoites for catalase, and schizonts for SOD1, PON1, and BLVRB). Western blot analysis also indicated much higher concentrations of two of the human proteins (SOD1 and PON) in P. falciparum parasites released from the erythrocytes by saponin lysis compared with erythrocyte ghosts generated by an identical lysis protocol using uninfected erythrocytes (Fig. 3B). The red blood cell controls ruled out that the signal observed in the parasite preparations was caused by contaminating erythrocyte ghosts, whereas the weak bands of the same apparent molecular weight as in the parasite samples confirmed the specificity of the antibodies (Fig. 3B). It will be intriguing to quantitatively analyze the host protein accumulation within as well as the mode of transport into the parasites in the future.
Fig. 3.

Human proteins. Immunofluorescence microscopy confirmed the presence of five human proteins (A, Alexa channel) within intraerythrocytic P. falciparum parasites. It is noteworthy that these proteins are so abundant in the parasites that they are in most cases almost invisible in the surrounding erythrocytes at the aperture settings and exposure times chosen to take these images. In the overlay panels DAPI staining is indicated in blue while the Alexa signal is shown in red or green. Western blots (B) confirm the presence of full-length SOD1 and paraoxonase in the parasites (Ri, rings; Tr, trophozoites; Sch, schizonts; uRBC, uninfected red blood cells; a total of 30 μg protein was loaded in each lane, all lanes containing SDS protein lysates of the pellet fraction after saponin lysis of the red blood cells). In contrast, the antibodies yielded significantly weaker signals on the same amount of protein (30 μg per lane) extracted from the pellet fraction of saponin-lysed uninfected erythrocytes (uRBC). The latter was chosen as a control protein preparation because it contains those erythrocyte proteins that are most likely to constitute “contaminating” human proteins expected to also be present in the parasite protein preparations without necessarily being localized within the parasites or parasite-derived structures such as Maurer's clefts. The relative abundance profiles of a selection of human proteins are depicted in panel C. All abundance profiles can be found in supplemental Fig. S4.
The human proteins also exhibit a variety of relative abundance profiles that may be caused by variable degradation over time by parasite proteases, or by variable abundance or activity of parasite proteins that are important for the import of the human proteins (e.g. membrane transporters or chaperones), or a combination of both. For example, peroxiredoxin 2 and lactoferrin have abundance peaks in ring-stage parasites (<16 hpi) whereas the highest level of catalase is found during trophozoite stage (20–30 hpi) (Fig. 3C and supplemental Fig. S4).
RNA-Protein Correlations and Mathematical Modeling
Visual inspection of the obtained data suggests a complex relationship between transcript and protein levels during the P. falciparum IDC protein with broad variations between timing of peak of mRNA and protein abundance (Figs. 2, 3A–3C, and supplemental Fig. S4). For the majority of the proteins we observe a considerable delay of protein abundance compared with the corresponding mRNA levels (Fig. 4A) whereas there is only a small proportion of protein for which the protein abundance followed its mRNA transcript closely (Fig. 4B). Moreover, several Plasmodium proteins exhibited large variation in abundance profiles among their different isoforms (Fig. 4C). Focusing on a subset of 237 full-length protein isoforms (more likely the nascent polypeptides) we find that more than half of these (63.7%) exhibit an abundance peak 6–16 h after their corresponding mRNA (median = 11 h, supplemental Fig. S5A). This disparity is also evident in low Pearson correlation coefficients for pairs of protein and corresponding mRNA profiles (Fig. 4D; median Pearson correlation coefficient rP = –0.16 and rP = +0.09 for 237 full-length and 122 truncated protein isoforms, respectively). Indeed, when all protein profiles are shifted ahead-in-time by 12 h relative to the mRNA profiles the distribution of the Pearson correlation coefficient shift significantly toward high values with median rP = +0.76 (Fig. 4D) (rP = +0.30 for the truncated isoforms, data not shown). Analogously, comparing transcript abundance to the mathematical derivative of the corresponding protein abundance also improves the Pearson correlations, to a median rP = +0.52 (Fig. 4D) (rP = +0.35 for the truncated protein isoforms). Because the derivative of a protein abundance profile is a measure of the increase or decrease of protein abundance at a given point in time, this result indicates that maximum transcript abundance coincides with a maximum increase in corresponding protein abundance rather than with peak protein abundance itself. This finding is biologically plausible because mRNA is a necessary substrate for protein translation, so that a maximum rate of translation coincides with a peak in mRNA levels. This could indicate that the observed delay between mRNA and protein abundance is mainly caused by the dynamics of protein synthesis during the IDC rather than other post-translational regulatory processes.
To test this further, we carried out mathematical modeling of protein abundance that assumes that the translation and turnover rates are the major determinants of protein levels. This model can be captured by a differential equation d[Protein]/d[Time] = (ktransl × mRNA) – (kdegrad × Protein), where ktransl and kdegrad represent gene and protein isoform-specific coefficients of translation and protein degradation, respectively (29) (Experimental Procedures). Using a sine curve as a substitute for a typical log2-transformed mRNA abundance profile, the protein profiles calculated by this numerical model for various combinations of rates of translation and protein degradation represent a range of different shapes, amplitudes, and peak time differences (supplemental Fig. S5B). The modeled protein abundance is congruent with the mRNA profile only in the case of relatively high rates of protein translation and degradation. In contrast, lower rates of both translation and degradation generate protein profiles that differ significantly from the underlying mRNA profiles (Pearson correlation as low as rP = –0.59) with a peak time difference that reaches up to 15 h. In their overall parameters the modeled profiles are reminiscent of the protein profiles detected by our proteomics approach and overall it suggests that this mathematical modeling could generate a consistent approximation of the generated data set. To test this, we examined whether such a mathematical model could derive the protein abundance profiles that were observed in proteomic set from the observed mRNA profiles. To do so the model searched for suitable rates of translation and protein degradation such that the modeled abundance profile for a given protein isoform approximated the observed protein profile as closely as possible. The congruence between a pair of modeled and observed protein profiles was quantified by calculating a model score that incorporated both the Euclidean distance and the Pearson correlation. The distribution of all model scores (Fig. 4E) shows that a score of 0.8 is a suitable cutoff where the model scores obtained with the original data set significantly exceed those that result from bootstrapping (i.e. 100 rounds of randomly assigning mRNA to protein profiles and performing the modeling for these jumbled profile pairs). The mathematical model thus produced close approximations (score >0.8) of the observed protein abundance data for 149 of the 237 full-length protein isoforms (62.9%), which represents 82 of the 101 proteins (81.2%) for which at least one full-length isoform had been detected. Hence, for nearly two thirds of full-length protein isoforms a simple mathematical model can derive the observed protein profiles from the corresponding observed mRNA abundance with good accuracy by assuming suitable gene- and protein-specific rates of translation and protein degradation. Three examples of modeled protein profiles—representing the best, an intermediate, and the worst model score—are shown in Fig. 4F–4H (all modeled protein profiles are shown in supplemental Fig. S6).This indicates that the dynamics of translation and degradation alone could account for a large fraction of the observed transcript-protein relationships encountered in our P. falciparum data set.
Taken together, the correlation analyses and modeling experiments described here show that the dynamics of protein translation and degradation may in large part account for a variety of transcript-protein correlations and a typical delay of protein abundance compared with the corresponding transcript of up to 15 h. They furthermore illustrate that a high congruence between transcript and corresponding protein profiles over the course of the P. falciparum IDC represents but a special case that is encountered only when the rates of protein degradation and translation (and of protein isoform interconversion) are high.
DISCUSSION
The relationship of transcript levels and corresponding protein abundance is often complex, with studies investigating this issue in bacteria, yeast, and mammalian cells reaching a broad spectrum of conclusions and reporting mRNA-protein correlations that range from “strong” to “weak” (29, 36–45). The most common explanations for observed mRNA-protein level discrepancies include post-transcriptional and translational regulation or varying protein half-life. Other relevant factors include the presence of protein isoforms because of alternative splicing or post-translational modifications, and a time component e.g. in the case of drug treatment where changes in transcript levels may lead to changes in the respective protein levels with a delay of several hours (41). In malaria parasites, the cyclic nature of transcript levels for virtually all genes that are expressed during the IDC adds another layer of complexity and is at the same time essential to our understanding of these pathogens in regard to gene function, biochemistry, and cell biology. Yet to be able to correctly interpret the impact of the malaria parasite's unique gene expression cascade on its phenotype it is also crucial to understand the temporal dynamics of how transcript levels translate into protein abundance, and the data reported here represent a significant advancement in our understanding of these aspects in the malaria parasite.
In this study, we identify and analyze a cross-section of proteins from many subcellular compartments of the parasite such as the cytoplasm (e.g. glycolytic enzymes), endoplasmic reticulum (ER; e.g. HSP70–2 = BiP), Golgi (e.g. phosphoethanolamine N-methyltransferase) (46), mitochondrion (e.g. HSP60) (47), apicoplast (e.g. falcilysin) (48), food vacuole (e.g. plasmepsins and falcipains), inner membrane complex (e.g. GAP50), rhoptry (e.g. RhopH2, RhopH3, and RAP1–3) as well as several proteins with a putative localization in the parasitophorous vacuole (PV) and the host erythrocyte (33, 49) (e.g. HSP40). This suggests that many aspects of the Plasmodium proteome observed in this study are representative and may be extrapolated to a larger proportion of the proteome. These aspects include: (1) the occurrence of a single peak (or a plateau of high abundance) in cyclic protein abundance profiles that most likely indicates a “just-in-time” gene expression at the protein level such that the presence of each protein is timed to the specific part of the Plasmodium life cycle when its function is required; (2) coregulation of protein presence such that many functionally related proteins share similar abundance profiles; (3) an often significant deviation of the protein abundance profile from that of the corresponding transcript, usually manifest as a time delay between the steady state levels of transcripts and their protein products and/or as an extended high protein abundance until long after the corresponding transcript abundance has peaked and declined. This implies that in many cases the timing of a gene's function may not be precisely assessed by only observing the abundance profile of its transcript. After all, a time discrepancy between transcript and protein levels of 11 h (the median value) e.g. represents approximately a quarter of the entire IDC.
So what causes the incongruence between transcript and protein levels? We show that the dynamics of protein translation and degradation alone are not only consistent with but may in fact be expected to give rise to a variety of transcript-protein relationships. The major factor responsible for this variety is that rates of translation and protein degradation differ between genes and proteins. This notion has been established in model organisms and is because of the fact that such rates are affected by codon composition, gene length, poly(A) tail length, protein structure, susceptibility to proteolytic cleavage and other factors affecting translation initiation, elongation, and protein degradation (45, 50–53). Furthermore, protein isoform interconversion by post-translational modifications as well as global changes in e.g. the translational “base rate” (because of fluctuations in abundance and function of the mRNA splicing and protein translation machineries) add further complexity to individual transcript-protein relationships. Any effects of transcript stability on the other hand are already implicit in the observed steady-state mRNA abundance.
Although it cannot be completely ruled out that the observed transcript-protein incongruence during the IDC may to some extent also be caused by a translational delay mechanism such as translational repression, such a mechanism would have to occur in conjunction with simultaneously high rates of protein translation and degradation, which would be biologically wasteful. In addition, such a translational delay mechanism would have to occur on a large scale in order for it to make a significant contribution to the widespread transcript-protein incongruence, which would represent a highly complex system of gene expression control. In contrast, it is more parsimonious and therefore likely that the observed transcript-protein incongruence is largely caused by the dynamics of translation, degradation, and isoform interconversion as these processes could lead to the observed incongruence quasi automatically at comparatively low rates of translation and degradation, thereby representing a much simpler and biologically more efficient system. Taken together we therefore conclude that the asexual development of Plasmodium during the IDC and the proteome changes associated with this process are driven to a large extent by transcriptional regulation and protein turnover, and in particular without additional “checkpoints” between transcription and translation. This contrasts with the significant post-transcriptional control of the cellular proteome by translational repression during the transition from the mammalian host to the mosquito and from the mosquito back to the mammalian host (6, 8). Although this latter mechanism is well suited to trigger an extremely rapid shift in the proteomic content of the parasite after the virtually instantaneous switch of host organisms, our data suggest that the continuously changing proteome during the IDC is brought about largely by the transcriptional cascade followed by the processes of protein translation, degradation, and isoform interconversion whose dynamics are finely tuned to impart every protein (isoform) with its appropriate abundance profile. This also means that transcriptional differences observed in perturbation or comparative transcriptomic studies of Plasmodium parasites are likely to be associated with corresponding differences in protein content and downstream metabolic and physiological consequences, albeit probably with a potentially significant time delay.
Although human proteins have been encountered in parasite protein preparations before, many authors have explicitly or implicitly dismissed them as contaminants (13, 17, 18, 33, 54–56). Cytoskeletal proteins (e.g. spectrin, actin, tropomyosin) in particular are likely to have found their way into parasite preparations mostly by way of the empty red cell ghosts generated by saponin-lysis of the infected erythrocytes. In contrast, this study provides direct evidence for a significant intraparasitic localization of five human proteins. Superoxide dismutase (SOD) of host cell origin was first suggested to be present in murine malaria parasites (21, 54), but later also in P. falciparum (22, 57). Our Western blot and immunofluorescence data now provide additional strong evidence that this human protein is indeed present within malaria parasites. Similar evidence is presented for an intraparasitic localization of human paraoxonase, which had previously been encountered in other proteomic studies of P. falciparum (17, 55). An intraparasitic localization of flavin reductase and catalase is also consistent with previous studies (18, 22, 33, 55, 56), whereas lactoferrin has—to the best of our knowledge—not been reported to be present in malaria parasites before.
The function of the scavenged host peroxiredoxin 2 for P. falciparum has been proposed to be in antioxidant defense, and an increased abundance of this protein in the parasite was found after chloroquine treatment (26). Our data now support the notion that malaria parasites may rely on a number of human proteins for its defense against oxidative stress: peroxiredoxin 2, SOD1, and catalase are well known antioxidant enzymes, whereas oxidative stress-related activities have been established to varying degrees also for paraoxonase 1 (especially in regard to lipid peroxidation) (58, 59), lactoferrin (60), and flavin reductase (61). In fact, flavin reductase has recently also been reported to exhibit increased abundance in the parasite after drug treatment, in this case with doxycycline (18). Furthermore, we and others (33, 56) have detected human selenium-binding-protein 1 in parasite preparations which could potentially facilitate the activity of selenocysteine-containing proteins with a redox function such as human glutathione peroxidase or the parasite protein Sel2 (62). In principle, the use of human enzymes by P. falciparum to bolster its antioxidant defense is especially plausible because these parasites lack the genes for both catalase and a genuine glutathione peroxidase (63).
One of the most striking observations resulting from the two-dimensional gel proteomics analysis is the extent of post-translational modifications (PTMs) that characterize the proteome of the IDC and possibly the entire life cycle. In agreement with two previous studies (12, 13) more than half (71 out of 125) of P. falciparum proteins were represented by more than one protein spot. In this study the 363 identified protein spots represented 125 Plasmodium proteins which correspond to an average 2.9 discernible protein isoforms per protein. In many cases the individual isoforms exhibit abundance profiles (Fig. 2, supplemental Table S1) that are distinct from those of the full-length nascent polypeptides. This suggests that PTMs play a role in further diversifying the Plasmodium proteome during the IDC. A wide variety of PTMs have been reported for P. falciparum over the last two decades including phosphorylation, acetylation, methylation, ubiquitination, glycosylation, lipidation as well as proteolytic cleavage (reviewed in (64)). One of the most widely abundant PTMs is phosphorylation, which has been implicated in various functions including cell growth, differentiation, cell division as well as the regulation of metabolic pathways, enzyme activities, cytoskeleton organization and chromatin remodeling. Two-dimensional gel technology as well as LC-MS/MS analysis have uncovered close to 170 proteins that are phosphorylated at serine or tyrosine residues (65). Using specific antibodies it was shown that differential phosphorylations commonly appear on two-dimensional gels as lateral shifts along the pH gradient. In our study 118 protein spots correspond to lateral shifts of protein isoforms, and many of these could therefore represent different phosphorylation status of the corresponding proteins (Fig. 2 and supplemental Table S2).
Another highly important PTM in P. falciparum is proteolytic processing which is known to play a major role in the regulation of several crucial parasite functions including hemoglobin degradation, merozoite egress, and host cell invasion. Out of the 125 proteins identified by this two-dimensional gel-based study, truncated isoforms were detected for 46 proteins with on average 2.7 truncated isoforms for each of these proteins. Indeed, several hemoglobinases including falcipain 2A and 2B, as well as plasmepsins I, II, III (HAP), and IV were detected at lower than expected molecular weights, which likely represent their proteolytically activated isoforms. Several proteins involved in host cell invasion were also identified among the truncated isoforms including merozoite surface proteins (MSP1, MSP7), rhoptry associated proteins (RAP1, RAP2, RAP3), and members of the CLAG gene family (RhopH1, RhopH2, RhopH3) as well as a glideosome associated protein (GAP50). Furthermore, there are some proteins that are represented by a large number of protein spots/isoforms. These include (1) glycolytic enzymes such as enolase (PF10_0155, represented by 18 isoforms of which nine are truncated), glyceraldehyde-3-phosphate dehydrogenase (GAPDH) (PF14_0598, 14/7), phosphoglycerate kinase (PFI1105, 8/1), and lactate dehydrogenase (PF13_0141, 4/1); (2) molecular chaperones as e.g. HSP 70-1 (PF08_0054, 11/2), HSP70–2 (BiP, PFI0875w, 20/13), HSP86 (PF07_0029, 14/12); and (3) elongation factors such as EF1beta (PF13_0304, 4/0) and EF-2 (PF14_0486, 7/5). At present very little is known about the biological significance of these posttranslational modifications. It has however been recently suggested that different isoforms of enolase may be associated with different subcellular compartments where they facilitate different functions (66). Our results therefore provide clues for future functional analyses that may unearth novel functions for otherwise highly conserved proteins.
Malaria represents a serious disease and a massive health and social burden in large parts of the world. Although a number of drugs against diverse molecular targets are in use, developing and spreading resistance to existing medicines is a grave problem (1, 67). Our analyses include and advance our basic understanding of many parasite proteins that are existing or potential drug targets, including proteasome subunits (68), heat shock proteins (69), lactate dehydrogenase (70), hemoglobin digestive enzymes (71), enzymes of the purine salvage pathway (72), of methionine and polyamine metabolism (73), and host cell invasion molecules (74). Moreover, the possibility that several human proteins may contribute significantly to parasite functions critical to drug treatment such as antioxidant defense has important implications for drug intervention strategies. In fact, two studies have already shown increased abundance of human proteins within the parasites following drug treatment (18, 26). On the other hand, the timely and correct diagnosis of malaria is equally important. Although diagnosis by Giemsa stain-based microscopy requires highly skilled personnel and is labor intensive and time consuming, rapid diagnostic tests are a relatively recent alternative that are easier and faster to perform. Unfortunately, current rapid diagnostic tests suffer from insufficient sensitivity and unacceptable rates of false results (75, 76) so that rapid diagnostic tests based on parasite proteins other than LDH and histidine-rich protein 2 (HRP2) could be valuable new tools in the fight against malaria. This study identifies 12 parasite proteins (supplemental Table S5) that are readily soluble and exhibit high absolute abundance levels, two important prerequisites for any new RTD candidate protein. Analyzing sequence similarity to orthologs from other human malaria species and from the human genome (supplemental Table S5), we identify phosphoethanolamine N-methyltransferase (MAL13P1.214), hypothetical protein PFI1270w, and a protein disulfide isomerase (PDI-8; MAL8P1.17) as potential new RTD candidate proteins that might provide good sensitivity for multiple human malaria species at low cross reactivity against the human proteome. We thus hope that the advancement in our understanding of basic aspects of the Plasmodium proteome reported here will ultimately help to control these parasites and the associated disease.
Footnotes
* This work was funded by grant BMRC 05/1/22/19/398 and 09/1/22/19/614 from the Biomedical Research Council, Singapore.
 This article contains supplemental material.
1 The abbreviations used are:
- IDC
- intra-erythrocytic developmental cycle
- 2D-DIGE
- two-dimensional differential gel electrophoresis
- PTM
- post-translational modification.
REFERENCES
- 1. WHO (2009) World Health Organization, Geneva, World Malaria Report 2009 [Google Scholar]
- 2. Bozdech Z., Llinás M., Pulliam B. L., Wong E. D., Zhu J., DeRisi J. L. (2003) The transcriptome of the intraerythrocytic developmental cycle of Plasmodium falciparum. PLoS Biol. 1, E5. [DOI] [PMC free article] [PubMed] [Google Scholar]
- 3. Bozdech Z., Mok S., Hu G., Imwong M., Jaidee A., Russell B., Ginsburg H., Nosten F., Day N. P., White N. J., Carlton J. M., Preiser P. R. (2008) The transcriptome of Plasmodium vivax reveals divergence and diversity of transcriptional regulation in malaria parasites. Proc. Natl. Acad. Sci. U.S.A. 105, 16290–16295 [DOI] [PMC free article] [PubMed] [Google Scholar]
- 4. Bozdech Z., Zhu J., Joachimiak M. P., Cohen F. E., Pulliam B., DeRisi J. L. (2003) Expression profiling of the schizont and trophozoite stages of Plasmodium falciparum with a long-oligonucleotide microarray. Genome Biol. 4, R9. [DOI] [PMC free article] [PubMed] [Google Scholar]
- 5. Le Roch K. G., Zhou Y., Blair P. L., Grainger M., Moch J. K., Haynes J. D., De La Vega P., Holder A. A., Batalov S., Carucci D. J., Winzeler E. A. (2003) Discovery of gene function by expression profiling of the malaria parasite life cycle. Science 301, 1503–1508 [DOI] [PubMed] [Google Scholar]
- 6. Mair G. R., Braks J. A., Garver L. S., Wiegant J. C., Hall N., Dirks R. W., Khan S. M., Dimopoulos G., Janse C. J., Waters A. P. (2006) Regulation of sexual development of Plasmodium by translational repression. Science 313, 667–669 [DOI] [PMC free article] [PubMed] [Google Scholar]
- 7. Hall N., Karras M., Raine J. D., Carlton J. M., Kooij T. W., Berriman M., Florens L., Janssen C. S., Pain A., Christophides G. K., James K., Rutherford K., Harris B., Harris D., Churcher C., Quail M. A., Ormond D., Doggett J., Trueman H. E., Mendoza J., Bidwell S. L., Rajandream M. A., Carucci D. J., Yates J. R., 3rd, Kafatos F. C., Janse C. J., Barrell B., Turner C. M., Waters A. P., Sinden R. E. (2005) A comprehensive survey of the Plasmodium life cycle by genomic, transcriptomic, and proteomic analyses. Science 307, 82–86 [DOI] [PubMed] [Google Scholar]
- 8. Zhang M., Fennell C., Ranford-Cartwright L., Sakthivel R., Gueirard P., Meister S., Caspi A., Doerig C., Nussenzweig R. S., Tuteja R., Sullivan W. J., Jr., Roos D. S., Fontoura B. M., Ménard R., Winzeler E. A., Nussenzweig V. (2010) The Plasmodium eukaryotic initiation factor-2alpha kinase IK2 controls the latency of sporozoites in the mosquito salivary glands. J. Exp. Med. 207, 1465–1474 [DOI] [PMC free article] [PubMed] [Google Scholar]
- 9. Mok B. W., Ribacke U., Rasti N., Kironde F., Chen Q., Nilsson P., Wahlgren M. (2008) Default Pathway of var2csa switching and translational repression in Plasmodium falciparum. PLoS One 3, e1982. [DOI] [PMC free article] [PubMed] [Google Scholar]
- 10. Nirmalan N., Sims P. F., Hyde J. E. (2004) Translational up-regulation of antifolate drug targets in the human malaria parasite Plasmodium falciparum upon challenge with inhibitors. Mol. Biochem. Parasitol. 136, 63–70 [DOI] [PubMed] [Google Scholar]
- 11. Le Roch K. G., Johnson J. R., Florens L., Zhou Y., Santrosyan A., Grainger M., Yan S. F., Williamson K. C., Holder A. A., Carucci D. J., Yates J. R., 3rd, Winzeler E. A. (2004) Global analysis of transcript and protein levels across the Plasmodium falciparum life cycle. Genome Res. 14, 2308–2318 [DOI] [PMC free article] [PubMed] [Google Scholar]
- 12. Nirmalan N., Sims P. F., Hyde J. E. (2004) Quantitative proteomics of the human malaria parasite Plasmodium falciparum and its application to studies of development and inhibition. Mol. Microbiol. 52, 1187–1199 [DOI] [PubMed] [Google Scholar]
- 13. Foth B. J., Zhang N., Mok S., Preiser P. R., Bozdech Z. (2008) Quantitative protein expression profiling reveals extensive post-transcriptional regulation and post-translational modifications in schizont-stage malaria parasites. Genome Biol. 9, R177. [DOI] [PMC free article] [PubMed] [Google Scholar]
- 14. Gilson P. R., Nebl T., Vukcevic D., Moritz R. L., Sargeant T., Speed T. P., Schofield L., Crabb B. S. (2006) Identification and stoichiometry of glycosylphosphatidylinositol-anchored membrane proteins of the human malaria parasite Plasmodium falciparum. Mol. Cell Proteomics 5, 1286–1299 [DOI] [PubMed] [Google Scholar]
- 15. Florens L., Washburn M. P., Raine J. D., Anthony R. M., Grainger M., Haynes J. D., Moch J. K., Muster N., Sacci J. B., Tabb D. L., Witney A. A., Wolters D., Wu Y., Gardner M. J., Holder A. A., Sinden R. E., Yates J. R., Carucci D. J. (2002) A proteomic view of the Plasmodium falciparum life cycle. Nature 419, 520–526 [DOI] [PubMed] [Google Scholar]
- 16. Lasonder E., Ishihama Y., Andersen J. S., Vermunt A. M., Pain A., Sauerwein R. W., Eling W. M., Hall N., Waters A. P., Stunnenberg H. G., Mann M. (2002) Analysis of the Plasmodium falciparum proteome by high-accuracy mass spectrometry. Nature 419, 537–542 [DOI] [PubMed] [Google Scholar]
- 17. Gelhaus C., Fritsch J., Krause E., Leippe M. (2005) Fractionation and identification of proteins by 2-DE and MS: towards a proteomic analysis of Plasmodium falciparum. Proteomics 5, 4213–4222 [DOI] [PubMed] [Google Scholar]
- 18. Briolant S., Almeras L., Belghazi M., Boucomont-Chapeaublanc E., Wurtz N., Fontaine A., Granjeaud S., Fusaï T., Rogier C., Pradines B. (2010) Plasmodium falciparum proteome changes in response to doxycycline treatment. Malar J. 9, 141. [DOI] [PMC free article] [PubMed] [Google Scholar]
- 19. Tarun A. S., Peng X., Dumpit R. F., Ogata Y., Silva-Rivera H., Camargo N., Daly T. M., Bergman L. W., Kappe S. H. (2008) A combined transcriptome and proteome survey of malaria parasite liver stages. Proc. Natl. Acad. Sci. U.S.A. 105, 305–310 [DOI] [PMC free article] [PubMed] [Google Scholar]
- 20. Chandramohanadas R., Davis P. H., Beiting D. P., Harbut M. B., Darling C., Velmourougane G., Lee M. Y., Greer P. A., Roos D. S., Greenbaum D. C. (2009) Apicomplexan parasites co-opt host calpains to facilitate their escape from infected cells. Science 324, 794–797 [DOI] [PMC free article] [PubMed] [Google Scholar]
- 21. Fairfield A. S., Meshnick S. R., Eaton J. W. (1983) Malaria parasites adopt host cell superoxide dismutase. Science 221, 764–766 [DOI] [PubMed] [Google Scholar]
- 22. Fairfield A. S., Abosch A., Ranz A., Eaton J. W., Meshnick S. R. (1988) Oxidant defense enzymes of Plasmodium falciparum. Mol. Biochem. Parasitol. 30, 77–82 [DOI] [PubMed] [Google Scholar]
- 23. Sharma A. (1993) Subcellular distribution of superoxide dismutase and catalase in human malarial parasite Plasmodium vivax. Indian J. Exp. Biol. 31, 275–277 [PubMed] [Google Scholar]
- 24. Bonday Z. Q., Dhanasekaran S., Rangarajan P. N., Padmanaban G. (2000) Import of host delta-aminolevulinate dehydratase into the malarial parasite: identification of a new drug target. Nat. Med. 6, 898–903 [DOI] [PubMed] [Google Scholar]
- 25. Varadharajan S., Sagar B. K., Rangarajan P. N., Padmanaban G. (2004) Localization of ferrochelatase in Plasmodium falciparum. Biochem. J. 384, 429–436 [DOI] [PMC free article] [PubMed] [Google Scholar]
- 26. Koncarevic S., Rohrbach P., Deponte M., Krohne G., Prieto J. H., Yates J., 3rd, Rahlfs S., Becker K. (2009) The malarial parasite Plasmodium falciparum imports the human protein peroxiredoxin 2 for peroxide detoxification. Proc. Natl. Acad. Sci. U.S.A. 106, 13323–13328 [DOI] [PMC free article] [PubMed] [Google Scholar]
- 27. Trager W., Jensen J. B. (1976) Human malaria parasites in continuous culture. Science 193, 673–675 [DOI] [PubMed] [Google Scholar]
- 28. Hu G., Llinás M., Li J., Preiser P. R., Bozdech Z. (2007) Selection of long oligonucleotides for gene expression microarrays using weighted rank-sum strategy. BMC Bioinformatics 8, 350. [DOI] [PMC free article] [PubMed] [Google Scholar]
- 29. Greenbaum D., Colangelo C., Williams K., Gerstein M. (2003) Comparing protein abundance and mRNA expression levels on a genomic scale. Genome Biol. 4, 117. [DOI] [PMC free article] [PubMed] [Google Scholar]
- 30. Llinás M., Bozdech Z., Wong E. D., Adai A. T., DeRisi J. L. (2006) Comparative whole genome transcriptome analysis of three Plasmodium falciparum strains. Nucleic Acids Res. 34, 1166–1173 [DOI] [PMC free article] [PubMed] [Google Scholar]
- 31. Marouga R., David S., Hawkins E. (2005) The development of the DIGE system: 2D fluorescence difference gel analysis technology. Anal. Bioanal. Chem. 382, 669–678 [DOI] [PubMed] [Google Scholar]
- 32. Das A., Syin C., Fujioka H., Zheng H., Goldman N., Aikawa M., Kumar N. (1997) Molecular characterization and ultrastructural localization of Plasmodium falciparum Hsp 60. Mol. Biochem. Parasitol. 88, 95–104 [DOI] [PubMed] [Google Scholar]
- 33. Nyalwidhe J., Lingelbach K. (2006) Proteases and chaperones are the most abundant proteins in the parasitophorous vacuole of Plasmodium falciparum-infected erythrocytes. Proteomics 6, 1563–1573 [DOI] [PubMed] [Google Scholar]
- 34. Dluzewski A. R., Ling I. T., Hopkins J. M., Grainger M., Margos G., Mitchell G. H., Holder A. A., Bannister L. H. (2008) Formation of the food vacuole in Plasmodium falciparum: a potential role for the 19 kDa fragment of merozoite surface protein 1 (MSP1(19)). PLoS One 3, e3085. [DOI] [PMC free article] [PubMed] [Google Scholar]
- 35. Santos J. M., Ferguson D. J., Blackman M. J., Soldati-Favre D. (2011) Intramembrane cleavage of AMA1 triggers Toxoplasma to switch from an invasive to a replicative mode. Science 331, 473–477 [DOI] [PubMed] [Google Scholar]
- 36. Griffin T. J., Gygi S. P., Ideker T., Rist B., Eng J., Hood L., Aebersold R. (2002) Complementary profiling of gene expression at the transcriptome and proteome levels in Saccharomyces cerevisiae. Mol. Cell Proteomics 1, 323–333 [DOI] [PubMed] [Google Scholar]
- 37. Tian Q., Stepaniants S. B., Mao M., Weng L., Feetham M. C., Doyle M. J., Yi E. C., Dai H., Thorsson V., Eng J., Goodlett D., Berger J. P., Gunter B., Linseley P. S., Stoughton R. B., Aebersold R., Collins S. J., Hanlon W. A., Hood L. E. (2004) Integrated genomic and proteomic analyses of gene expression in Mammalian cells. Mol. Cell Proteomics 3, 960–969 [DOI] [PubMed] [Google Scholar]
- 38. Schmidt M. W., Houseman A., Ivanov A. R., Wolf D. A. (2007) Comparative proteomic and transcriptomic profiling of the fission yeast Schizosaccharomyces pombe. Mol. Syst. Biol. 3, 79. [DOI] [PMC free article] [PubMed] [Google Scholar]
- 39. Wu G., Nie L., Zhang W. (2008) Integrative analyses of posttranscriptional regulation in the yeast Saccharomyces cerevisiae using transcriptomic and proteomic data. Curr. Microbiol. 57, 18–22 [DOI] [PubMed] [Google Scholar]
- 40. Washburn M. P., Koller A., Oshiro G., Ulaszek R. R., Plouffe D., Deciu C., Winzeler E., Yates J. R., 3rd (2003) Protein pathway and complex clustering of correlated mRNA and protein expression analyses in Saccharomyces cerevisiae. Proc. Natl. Acad. Sci. U.S.A. 100, 3107–3112 [DOI] [PMC free article] [PubMed] [Google Scholar]
- 41. Fournier M. L., Paulson A., Pavelka N., Mosley A. L., Gaudenz K., Bradford W. D., Glynn E., Li H., Sardiu M. E., Fleharty B., Seidel C., Florens L., Washburn M. P. (2010) Delayed correlation of mRNA and protein expression in rapamycin-treated cells and a role for Ggc1 in cellular sensitivity to rapamycin. Mol. Cell Proteomics 9, 271–284 [DOI] [PMC free article] [PubMed] [Google Scholar]
- 42. Rossignol T., Kobi D., Jacquet-Gutfreund L., Blondin B. (2009) The proteome of a wine yeast strain during fermentation, correlation with the transcriptome. J. Appl. Microbiol. 107, 47–55 [DOI] [PubMed] [Google Scholar]
- 43. Jayapal K. P., Philp R. J., Kok Y. J., Yap M. G., Sherman D. H., Griffin T. J., Hu W. S. (2008) Uncovering genes with divergent mRNA-protein dynamics in Streptomyces coelicolor. PLoS One 3, e2097. [DOI] [PMC free article] [PubMed] [Google Scholar]
- 44. Rogers S., Girolami M., Kolch W., Waters K. M., Liu T., Thrall B., Wiley H. S. (2008) Investigating the correspondence between transcriptomic and proteomic expression profiles using coupled cluster models. Bioinformatics 24, 2894–2900 [DOI] [PMC free article] [PubMed] [Google Scholar]
- 45. Beyer A., Hollunder J., Nasheuer H. P., Wilhelm T. (2004) Post-transcriptional expression regulation in the yeast Saccharomyces cerevisiae on a genomic scale. Mol. Cell Proteomics 3, 1083–1092 [DOI] [PubMed] [Google Scholar]
- 46. Witola W. H., Pessi G., El Bissati K., Reynolds J. M., Mamoun C. B. (2006) Localization of the phosphoethanolamine methyltransferase of the human malaria parasite Plasmodium falciparum to the Golgi apparatus. J. Biol. Chem. 281, 21305–21311 [DOI] [PubMed] [Google Scholar]
- 47. Sato S., Rangachari K., Wilson R. J. (2003) Targeting GFP to the malarial mitochondrion. Mol. Biochem. Parasitol. 130, 155–158 [DOI] [PubMed] [Google Scholar]
- 48. Ponpuak M., Klemba M., Park M., Gluzman I. Y., Lamppa G. K., Goldberg D. E. (2007) A role for falcilysin in transit peptide degradation in the Plasmodium falciparum apicoplast. Mol. Microbiol. 63, 314–334 [DOI] [PubMed] [Google Scholar]
- 49. Vincensini L., Richert S., Blisnick T., Van Dorsselaer A., Leize-Wagner E., Rabilloud T., Braun Breton C. (2005) Proteomic analysis identifies novel proteins of the Maurer's clefts, a secretory compartment delivering Plasmodium falciparum proteins to the surface of its host cell. Mol. Cell Proteomics 4, 582–593 [DOI] [PubMed] [Google Scholar]
- 50. Belle A., Tanay A., Bitincka L., Shamir R., O'Shea E. K. (2006) Quantification of protein half-lives in the budding yeast proteome. Proc. Natl. Acad. Sci. U.S.A. 103, 13004–13009 [DOI] [PMC free article] [PubMed] [Google Scholar]
- 51. Beilharz T. H., Preiss T. (2007) Widespread use of poly(A) tail length control to accentuate expression of the yeast transcriptome. Rna 13, 982–997 [DOI] [PMC free article] [PubMed] [Google Scholar]
- 52. Brockmann R., Beyer A., Heinisch J. J., Wilhelm T. (2007) Posttranscriptional expression regulation: what determines translation rates? PLoS Comput. Biol. 3, e57. [DOI] [PMC free article] [PubMed] [Google Scholar]
- 53. Arava Y., Wang Y., Storey J. D., Liu C. L., Brown P. O., Herschlag D. (2003) Genome-wide analysis of mRNA translation profiles in Saccharomyces cerevisiae. Proc. Natl. Acad. Sci. U.S.A. 100, 3889–3894 [DOI] [PMC free article] [PubMed] [Google Scholar]
- 54. Fairfield A. S., Eaton J. W., Meshnick S. R. (1986) Superoxide dismutase and catalase in the murine malaria, Plasmodium berghei: content and subcellular distribution. Arch. Biochem. Biophys. 250, 526–529 [DOI] [PubMed] [Google Scholar]
- 55. Wu Y., Craig A. (2006) Comparative proteomic analysis of metabolically labelled proteins from Plasmodium falciparum isolates with different adhesion properties. Malar J. 5, 67. [DOI] [PMC free article] [PubMed] [Google Scholar]
- 56. Smit S., Stoychev S., Louw A. I., Birkholtz L. M. (2010) Proteomic profiling of Plasmodium falciparum through improved, semiquantitative two-dimensional gel electrophoresis. J. Proteome Res. 9, 2170–2181 [DOI] [PubMed] [Google Scholar]
- 57. Arias A. E., Walter R. D. (1988) Plasmodium falciparum: association with erythrocytic superoxide dismutase. J. Protozool. 35, 348–351 [DOI] [PubMed] [Google Scholar]
- 58. Otocka-Kmiecik A., Orlowska-Majdak M. (2009) The role of genetic (PON1 polymorphism) and environmental factors, especially physical activity, in antioxidant function of paraoxonase. Postepy. Hig. Med. Dosw. 63, 668–677 [PubMed] [Google Scholar]
- 59. Mackness M. I., Arrol S., Durrington P. N. (1991) Paraoxonase prevents accumulation of lipoperoxides in low-density lipoprotein. FEBS Lett. 286, 152–154 [DOI] [PubMed] [Google Scholar]
- 60. Letchoumy P. V., Mohan K. V., Stegeman J. J., Gelboin H. V., Hara Y., Nagini S. (2008) In vitro antioxidative potential of lactoferrin and black tea polyphenols and protective effects in vivo on carcinogen activation, DNA damage, proliferation, invasion, and angiogenesis during experimental oral carcinogenesis. Oncol. Res. 17, 193–203 [DOI] [PMC free article] [PubMed] [Google Scholar]
- 61. Sedlak T. W., Saleh M., Higginson D. S., Paul B. D., Juluri K. R., Snyder S. H. (2009) Bilirubin and glutathione have complementary antioxidant and cytoprotective roles. Proc. Natl. Acad. Sci. U.S.A. 106, 5171–5176 [DOI] [PMC free article] [PubMed] [Google Scholar]
- 62. Lobanov A. V., Delgado C., Rahlfs S., Novoselov S. V., Kryukov G. V., Gromer S., Hatfield D. L., Becker K., Gladyshev V. N. (2006) The Plasmodium selenoproteome. Nucleic Acids Res. 34, 496–505 [DOI] [PMC free article] [PubMed] [Google Scholar]
- 63. Sztajer H., Gamain B., Aumann K. D., Slomianny C., Becker K., Brigelius-Flohé R., Flohé L. (2001) The putative glutathione peroxidase gene of Plasmodium falciparum codes for a thioredoxin peroxidase. J. Biol. Chem. 276, 7397–7403 [DOI] [PubMed] [Google Scholar]
- 64. Chung D. W., Ponts N., Cervantes S., Le Roch K. G. (2009) Post-translational modifications in Plasmodium: more than you think! Mol. Biochem. Parasitol. 168, 123–134 [DOI] [PubMed] [Google Scholar]
- 65. Wu Y., Nelson M. M., Quaile A., Xia D., Wastling J. M., Craig A. (2009) Identification of phosphorylated proteins in erythrocytes infected by the human malaria parasite Plasmodium falciparum. Malar J. 8, 105. [DOI] [PMC free article] [PubMed] [Google Scholar]
- 66. Pal-Bhowmick I., Vora H. K., Jarori G. K. (2007) Sub-cellular localization and post-translational modifications of the Plasmodium yoelii enolase suggest moonlighting functions. Malar J. 6, 45. [DOI] [PMC free article] [PubMed] [Google Scholar]
- 67. Wells T. N., Alonso P. L., Gutteridge W. E. (2009) New medicines to improve control and contribute to the eradication of malaria. Nat. Rev. Drug Discov. 8, 879–891 [DOI] [PubMed] [Google Scholar]
- 68. Chung D. W., Le Roch K. G. (2010) Targeting the Plasmodium ubiquitin/proteasome system with anti-malarial compounds: promises for the future. Infect. Disord. Drug Targets 10, 158–164 [DOI] [PubMed] [Google Scholar]
- 69. Pesce E. R., Cockburn I. L., Goble J. L., Stephens L. L., Blatch G. L. (2010) Malaria heat shock proteins: drug targets that chaperone other drug targets. Infect. Disord. Drug Targets 10, 147–157 [DOI] [PubMed] [Google Scholar]
- 70. Granchi C., Bertini S., Macchia M., Minutolo F. (2010) Inhibitors of lactate dehydrogenase isoforms and their therapeutic potentials. Curr. Med. Chem. 17, 672–697 [DOI] [PubMed] [Google Scholar]
- 71. Naughton J. A., Nasizadeh S., Bell A. (2010) Downstream effects of haemoglobinase inhibition in Plasmodium falciparum-infected erythrocytes. Mol. Biochem. Parasitol. 173, 81–87 [DOI] [PubMed] [Google Scholar]
- 72. Donaldson T., Kim K. (2010) Targeting Plasmodium falciparum purine salvage enzymes: a look at structure-based drug development. Infect. Disord. Drug Targets 10, 191–199 [DOI] [PubMed] [Google Scholar]
- 73. Clark K., Niemand J., Reeksting S., Smit S., van Brummelen A. C., Williams M., Louw A. I., Birkholtz L. (2010) Functional consequences of perturbing polyamine metabolism in the malaria parasite, Plasmodium falciparum. Amino Acids 38, 633–644 [DOI] [PubMed] [Google Scholar]
- 74. Kappe S. H., Vaughan A. M., Boddey J. A., Cowman A. F. (2010) That was then but this is now: malaria research in the time of an eradication agenda. Science 328, 862–866 [DOI] [PubMed] [Google Scholar]
- 75. Moody A. (2002) Rapid diagnostic tests for malaria parasites. Clin. Microbiol. Rev. 15, 66–78 [DOI] [PMC free article] [PubMed] [Google Scholar]
- 76. Chiodini P. L., Bowers K., Jorgensen P., Barnwell J. W., Grady K. K., Luchavez J., Moody A. H., Cenizal A., Bell D. (2007) The heat stability of Plasmodium lactate dehydrogenase-based and histidine-rich protein 2-based malaria rapid diagnostic tests. Trans. R Soc. Trop. Med. Hyg. 101, 331–337 [DOI] [PubMed] [Google Scholar]