

Abstract
In vitro vesicle fusion assays that monitor lipid mixing between t-SNARE and v-SNARE vesicles in bulk solution exhibit remarkably slow fusion on the nonphysiological timescale of tens of minutes to several hours. Here, single-vesicle, fluorescence resonance energy transfer-based assays cleanly separate docking and fusion steps for individual vesicle pairs containing full-length SNAREs. Docking is extremely inefficient and is the rate-limiting step. Of importance, the docking and fusion kinetics are comparable in the two assays (one with v-SNARE vesicles tethered to a surface and the other with v-SNARE vesicles free in solution). Addition of the VC peptide synaptobrevin-2 (syb(57–92)) increases the docking efficiency by a factor of ∼30, but docking remains rate-limiting. In the presence of VC peptide, the fusion step occurs on a timescale of ∼10 s. In previous experiments involving bulk fusion assays in which the addition of synaptotagmin/Ca2+, Munc-18, or complexin accelerated the observed lipid-mixing rate, the enhancement may have arisen from the docking step rather than the fusion step.
Introduction
Ca2+-stimulated synaptic vesicle fusion (exocytosis) releases neurotransmitters from vesicles into the synaptic cleft, enabling communication between neurons. Several lines of evidence indicate that N-ethylmaleimide-sensitive-factor attachment protein receptors (SNAREs) play a central role in the membrane fusion process. The neuronal SNAREs involved in Ca2+-stimulated exocytosis are syntaxin-1 (syx), SNAP-25, and synaptobrevin-2 (syb). Syx and SNAP-25 are anchored in the presynaptic target plasma membrane and together are referred to as the t-SNARE proteins. Syb, also called the vesicle associated membrane protein (VAMP), is known as the v-SNARE protein (1). Four ∼70-amino-acid-long SNARE motifs from the three SNARE proteins assemble into a parallel ternary bundle of four α-helices (one each from syb and syx, and two from SNAP-25) (2,3). Such trans-SNARE complexes form an extraordinarily stable bridge (4) between two opposing membranes, perhaps exerting mechanical stress on the bilayers (2). Mutation or removal of genes encoding the SNARE proteins or proteolysis of SNARE proteins by clostridial neurotoxin proteases compromises neurotransmission in cells due to defects in exocytosis (5,6). However, it is likely that hundreds of proteins are involved in exocytosis (7). Therefore, it is challenging to design and interpret live-cell studies aimed at elucidating the molecular fusion machinery and its mechanism for driving neuronal exocytosis.
The results of in vitro experiments on the fusion of SNARE-bearing proteoliposomes have provided strong, direct support for SNAREs as the minimal membrane fusion machinery. Weber and co-workers (8) were the first to our knowledge to show that v-SNARE-containing vesicles and t-SNARE-containing vesicles spontaneously fuse together in solution. Many labs have subsequently corroborated this result (9–18). Apparently, the formation of trans-vesicle SNARE complexes provides sufficient energy to overcome the intrinsic barrier to vesicle-vesicle fusion. However, the timescale of these bulk fusion reactions (minutes to hours) does not begin to mimic the timescale of Ca2-triggered neuronal exocytosis (high microseconds to milliseconds) (19). Either the SNAREs are not fully functional in these in vitro assays or some key component is missing. The overall fusion timescale is reduced by more than an order of magnitude upon addition of a soluble peptide comprising residues 57–92 of syb in the vesicle mixture (20). This peptide is commonly referred to as VC peptide because it is a C-terminal fragment of the syb SNARE motif.
A major shortcoming of bulk SNARE-driven vesicle fusion assays developed thus far is their inability to separate in time the vesicle-vesicle docking step from the subsequent lipid mixing, or fusion, step (Fig. 1). Either step could be rate-limiting and thus the underlying cause of the slow overall reaction rate. In contrast, single-vesicle fusion assays are able to observe docking and fusion of individual vesicles in real time, thus providing a clean separation of the docking and fusion kinetics.
Figure 1.
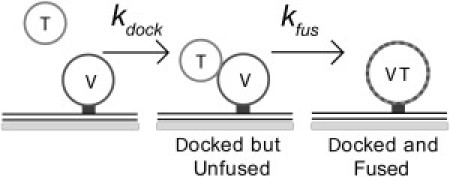
Two-step model of SNARE-driven vesicle-vesicle docking and fusion. The t-SNARE vesicles (T) dock (second-order rate constant kdock) and fuse (first-order rate constant kfus) with v-SNARE vesicles (V). The single-vesicle assay resolves these two steps. Docked but unfused pairs of vesicles differ from docked and fused pairs in the measured FRET efficiency from green labels in the t-SNARE vesicles to red labels in the v-SNARE vesicles.
In this work, we employ a tethered single-vesicle assay that closely mimics the assay previously developed by Yoon et al. (21). By using identical proteoliposomes in both bulk and single-vesicle fusion assays, we show directly that docking is by far the rate-limiting step. In fact, for full-length neuronal SNARE proteins, some 170,000 close encounters between a v-SNARE and a t-SNARE vesicle are required to form one docked vesicle pair. The primary effect of VC peptide is to enhance docking efficiency, but docking remains rate-limiting. In the presence of VC peptide, some 7000 close encounters are required to form one docked pair, and most docked pairs subsequently fuse on a 10-s timescale. These results strongly indicate that one should use caution when interpreting the acceleration of bulk fusion assays by addition of synaptotagmin with Ca2+, Munc-18, complexin, and other auxiliary proteins. The acceleration may arise from enhancement of the docking efficiency rather than the rate of the fusion step.
Materials and Methods
Single-vesicle fluorescence resonance energy transfer measurements
We determined the fluorescence resonance energy transfer (FRET) efficiency of a single-vesicle pair from two dual-color, 50-ms camera exposures obtained in rapid succession. The first exposure used 1.4 W/cm2 of 633 nm excitation and the second used 1.44 W/cm2 of 514 nm excitation (22). During the 633 nm excitation, only DiD fluorescence was detected, permitting unambiguous localization of each v-SNARE vesicle (Fig. 2). For each v-SNARE vesicle, we measured the fluorescence intensity in the red channel during 633 nm and 514 nm excitation ( and , respectively) and the fluorescence intensity in the green channel during 514 nm excitation () by integrating the background-corrected intensity in a 7×7 pixel region. We determined the background-corrected fluorescence intensity due to FRET, , after correcting for two sources of cross-talk, as described in the Supporting Material. The location of a single t-SNARE vesicle was inferred from the position of a punctal or signal (Fig. 2). For each colocalized v-SNARE/t-SNARE vesicle pair, we calculated the efficiency of DiI FRET to DiD using the following equation:
| (1) |
where γ is a detection sensitivity ratio that places DiI and DiD fluorescence on a common intensity scale (see Supporting Material).
Figure 2.
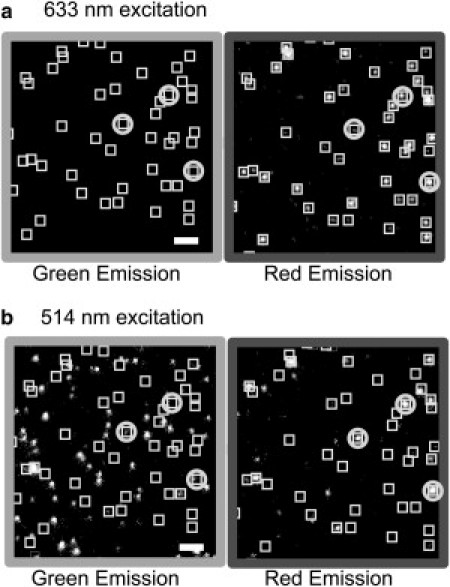
Alternating laser excitation of tethered vesicles with two-color imaging. Example images from the tethered vesicle assay after incubation of tethered v-SNARE vesicles with t-SNARE vesicles for 140 min. (a) On excitation at 633 nm, DiD fluorescence from each tethered v-SNARE vesicle gives rise to puncta in the red emission channel, enabling location of each tethered v-SNARE vesicle. Boxes mark positions of tethered v-SNARE vesicles in both the red and green images. No green emission appears. (b) Subsequent excitation at 514 nm locates green t-SNARE vesicles (DiI green emission), most of which are nonspecifically bound and do not colocalize with the v-SNARE vesicle locations. For those t-SNARE vesicles that colocalize with v-SNARE vesicles, fusion is detected as a greatly enhanced brightening of the red emission on 514 nm excitation. Several examples of docked and fused vesicle pairs are circled. Scale bar = 3.0 μm.
Results
Our strategy is to label v-SNARE vesicles with red-fluorescent lipid labels, and t-SNARE vesicles with green-fluorescent lipid labels. In this single-vesicle assay, the extent of FRET from the green labels to the red labels can then be used to distinguish docked but unfused t-SNARE/v-SNARE vesicle pairs from docked and fused pairs (21). First, we carried out a traditional bulk fusion assay (8) that monitors the progress of overall lipid mixing but does not dissect docking from fusion. Next, to evaluate the kinetics of the docking reaction (second-order rate constant kdock) separately from the subsequent fusion reaction (first-order rate constant kfus; Fig. 1), we studied free t-SNARE vesicles docking and fusing with individual v-SNARE vesicles tethered to a passivated surface. Finally, to directly compare the tethered vesicle results with the traditional bulk experiment, we monitored the progress of docking and fusion in the bulk assay by periodically plating a sample of the vesicle mixture sparsely onto glass and directly counting instances of docking and fusion using the same single-vesicle FRET measurements as in the tethered vesicle assay.
Bulk fusion assay and controls
Using a FRET-based bulk fusion assay, we found that full-length neuronal SNARE proteins drive lipid mixing between unilamellar phospholipid vesicles of ∼50 nm diameter at 37°C (Fig. S1 and Fig. S2), as reported previously by other laboratories (8,20,23,24). As shown in Fig. S1, we detected lipid mixing by exciting DiI (green-fluorescent FRET donor labels present at 2% in the t-SNARE vesicle membranes) and measuring the red-fluorescence intensity from FRET to DiD (FRET acceptor labels, present at 2% in the v-SNARE vesicle membranes). FRET occurs efficiently once the v- and t-SNARE vesicles have undergone lipid mixing and both labels are present in the same membrane (Supporting Material). When we mixed together t- and v-SNARE vesicles at 10 nM and 5 nM (in vesicles per liter), respectively, the amount of fluorescence intensity from FRET increased over the course of the 120-min experiment (curve −VC in Fig. S1 a). By replacing the DiD labels in the v-SNARE vesicles with NBD and Rhodamine, and removing the DiI labels from the t-SNARE vesicles, we were able to test our vesicles using a standard dequenching assay in which the extent of lipid mixing is reported on a calibrated scale. The composite rate of docking and fusion of our vesicles is consistent with previous published results obtained with similar materials and conditions (Fig. S2) (8,20,23,24).
The addition of VC peptide to the v- and t-SNARE vesicle mixture greatly enhanced the rate of lipid mixing (curve +VC in Fig. S1 a). The optimized VC peptide concentration of 4 μM (Fig. S1 b) (20,25) caused a ∼30-fold enhancement in the FRET signal after 35 min. We did not detect FRET for the following control mixtures (overlapping curves labeled controls in Fig. S1 a): 1), v-SNARE vesicles mixed with protein-free vesicles; 2), v-SNARE vesicles mixed with syx-only vesicles (lacking SNAP-25); and 3 and 4), v-SNARE vesicles mixed with vesicles containing syx plus SNAP-25 missing its 26 most C-terminal amino-acid residues (t-SNAREs designed to mimic the BoNT/E cleavage product) in the absence or presence, respectively, of 4 μM VC peptide. Evidently, all three SNARE proteins (syb, syx, and SNAP-25) are required for vesicle fusion on a 120-min timescale.
Docking and fusion assay using tethered v-SNARE vesicles
To monitor docking and fusion between individual pairs of SNARE-bearing vesicles (Fig. 1), we tethered the v-SNARE vesicles to a polymer-containing lipid bilayer via biotin-NeutrAvidin interactions (Fig. 2 and Fig. S3) (21). We incubated a sparse field of tethered v-SNARE vesicles with 10 nM t-SNARE vesicles in the presence or absence of 5 μM VC peptide. After reaction time intervals of 5–140 min, we rinsed the sample and imaged the surface at several locations to generate a single data set involving 1500–3000 tethered v-SNARE vesicles at each reaction time. Each reaction interval involved an entirely new surface. We took two images of the sample in rapid succession using a sensitive CCD camera. The first image was obtained during laser excitation at 633 nm and the second was acquired at 514 nm (see details in Materials and Methods) (22,26). The first image located the tethered v-SNARE vesicles, and the second image located t-SNARE vesicles. From these images we directly counted instances of v- and t-SNARE colocalization and determined the FRET efficiency between colocalized pairs (Fig. 2).
Tethered vesicle docking and fusion rate constants with and without VC peptide
Histograms summarizing the absolute FRET efficiency E of colocalized vesicle pairs at three different reaction times in the absence or presence of VC peptide are shown in Fig. 3, a and b, respectively. In each FRET efficiency histogram, there is a sharp peak centered at E = 0 and also a broad distribution of nonzero values centered at E = 0.6–0.7. The amplitude of the nonzero FRET peak grows as a function of reaction time. Histograms showing the distributions of the v-SNARE vesicle FRET intensities are shown in Fig. S4.
Figure 3.
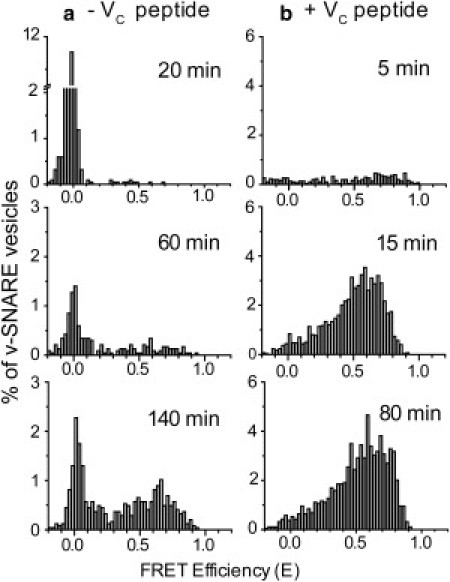
FRET efficiency histograms versus reaction time. Sparsely tethered v-SNARE vesicles were incubated with a 10 nM solution of t-SNARE vesicles in the (a) absence and (b) presence of 5 μM VC peptide. After the specified reaction time, excess (undocked) t-SNARE vesicles were rinsed away. Histograms of DiI to DiD FRET efficiency E (Eq. 1) are presented only for the subset of v-SNARE vesicles that were colocalized with a t-SNARE vesicle. Normalization accounts for variations in the total number of v-SNARE vesicles observed for each sample. Reaction times as shown. The strong peaks at E = 0 are due to false colocalization events (see Supporting Material).
To interpret the FRET efficiency data, we used Förster theory and model configurations to calculate the range of FRET efficiencies that arise from three different conditions for a vesicle pair: 1), docked but unfused; 2), docked and hemifused (outer leaflets mixed); or 3), docked and fully fused (complete lipid mixing). The calculations (described in detail in the Supporting Material) take into account the size distributions of the v- and t-SNARE vesicles (Fig. S5) and the Förster radius of the DiI-DiD FRET pair (Supporting Material and Fig. S6). The modeling predicts a wide range of FRET efficiency values for each condition due to the distribution of vesicle sizes. However, for the vast majority of pairs, vesicles in a docked but unfused state will have E ≤ 0.25 (Fig. S7), whereas vesicles that are docked and fused will have E > 0.25 (Fig. S8). Our calculations indicate that for any particular vesicle pair, the FRET efficiency after full fusion is only 0.05–0.2 greater than the FRET efficiency after hemifusion. Depending on the size combination of a specific vesicle pair, the range of FRET efficiencies expected for hemifusion is E = 0.15–0.9, whereas the range of FRET efficiencies expected for full fusion is E = 0.25–0.95 (Fig. S8). Thus, one cannot clearly distinguish a population of hemifused vesicle pairs from a population of fully fused vesicle pairs using the DiI/DiD FRET pair at 2% mol/mol labeling fraction (see Supporting Material and Fig. S8).
The E = 0.25 FRET efficiency threshold suggested by the modeling is consistent with real-time observations of vesicle pairs as they dock and fuse (Fig. S9). Docked vesicle pairs make an abrupt transition from a low-FRET state (E = 0–0.25) to a stable high-FRET state (E = 0.5–0.95). The observed range of low FRET efficiencies is consistent with the model estimates for vesicle pairs in a docked but unfused state, and the observed range of high FRET efficiencies is consistent with the model estimates for the docked and fused (or hemifused) state. Accordingly, we use E = 0.25 as the value that separates v-SNARE/t-SNARE vesicle pairs that are docked but unfused from those that are docked and fused (Fig. 3). Again, the docked and fused condition may include vesicle pairs that have undergone partial lipid mixing, including hemifusion. The docked but unfused curves are corrected statistically for the probability that a nonspecifically bound t-SNARE vesicle happens to colocalize with a v-SNARE vesicle within our spatial resolution (false colocalizations; see Supporting Material). The corrected docking curves are determined in both the absence (Fig. 4, a and b) and presence (Fig. 4, c and d) of VC peptide. The Total Docked curves in Fig. 4, b and d, are the sum of the Docked and Fused and the Docked but Unfused curves in Fig. 4, a and c.
Figure 4.

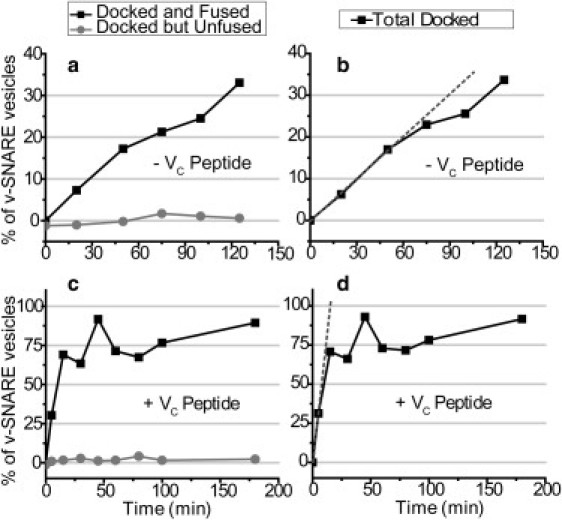
Docking and fusion versus time in tethered-vesicle assay. Percentage of tethered v-SNARE vesicles that docked but did not fuse with a t-SNARE vesicle (gray data points) or docked and fused with a t-SNARE vesicle (black data points) at each reaction time, as determined by the absolute FRET efficiency. The t-SNARE vesicle concentration was 10 nM. (a) Without VC peptide. (c) In the presence of 5 μM VC peptide. Docked but unfused curves are corrected for false colocalizations between a tethered v-SNARE vesicle and a t-SNARE vesicle (see SupportingMaterial). The total docking curves in panels b and d are the sum of the docked but unfused plus the docked and fused curves in panels a and c. Docked but unfused curves are corrected for false colocalizations between a v-SNARE vesicle and a t-SNARE vesicle (see Supporting Material). The dotted lines represent the linear fits used to determine kdock,teth.
The percentage of v-SNARE vesicles that are docked and fused grows to ∼10% over 120 min without VC peptide (Fig. 4 a) and to ∼70% over 30 min with VC peptide (Fig. 4 c). The latter curve plateaus at that level, and ∼30% of tethered v-SNARE vesicles never dock a t-SNARE vesicle on an 80-min timescale. Strikingly, in neither case do we clearly observe docked but unfused vesicle pairs within any of the 5-min measurement time intervals. The E = 0 peak of the FRET efficiency histograms (Fig. 3) arises almost entirely from false colocalization events, and its variability in amplitude reflects variability in the passivation of the surface. Significantly fewer E = 0 events occur in the presence of VC peptide. This is expected because the density of docked and fused pairs is much higher with VC peptide. False colocalization of a t-SNARE vesicle with a docked and fused pair (which includes 50% of the tethered v-SNARE vesicles by t = 15 min) will give rise not to E = 0 but to a lower apparent E for the docked and fused pair. With or without VC peptide, docking essentially always leads to fusion within the 5-min timescale of the measurement intervals.
We used the known t-SNARE vesicle concentration to convert the initial slope of the total docking curves (Fig. 4, b and d) into an approximate bimolecular rate constant kdock,teth for docking between t-SNARE vesicles and tethered v-SNARE vesicles. The linear fits are indicated by the dotted lines in Fig. 4, b and d. In the absence of VC peptide kdock,teth = (1.2 ± 0.1) × 103 M−1·s−1, where the concentration is expressed as moles of vesicles per liter. In the presence of VC peptide, the same analysis gives kdock,teth = (4.2 ± 0.3) × 104 M−1·s−1. VC peptide enhances the docking efficiency in the tethered-vesicle assay by a factor of ∼35.
Next, to estimate the fusion rate kfus in the presence of VC peptide, we directly observed individual docking and fusion events between free t-SNARE vesicles and tethered v-SNARE vesicles. Using 200-ms exposures and a 3-s cycle time, we observed individual t-SNARE vesicles dock (colocalize) and fuse with individual tethered v-SNARE vesicles. Fusion was observed as the sudden appearance of red fluorescence from FRET simultaneous with a loss of colocalized green intensity. See Movie S1 for a sample fusion event. The observed fusion was sensitive to the presence of intact SNAP-25. Incubation of tethered v-SNARE vesicles with vesicles whose t-SNAREs mimic the BoNT/E cleavage product in the presence of VC peptide resulted in no observable fusion over 15 min of observation time.
We observed dozens of individual docking and fusion events. A histogram of τfus-values (Fig. 5) was generated for 36 fusion events for which the docking time could be clearly discerned. For 85% of the fusion events, the delay time between docking and fusion ranged from <3 s to 42 s. More than half of the fusion events occurred <10 s after docking, and a few events occurred on a 2–5-min timescale. The fusion kinetics are inhomogeneous, but evidently the majority of the sample has kfus ∼ 0.1 s−1. In the absence of VC peptide, the very slow rate of docking precluded observation of individual fusion events.
Figure 5.
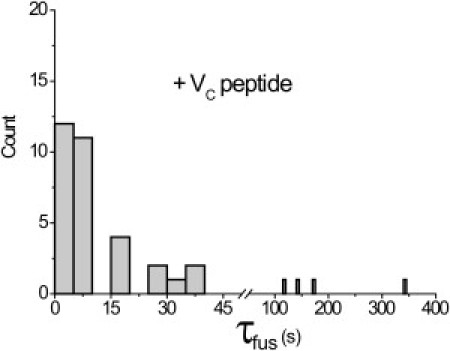
Histogram of τfus for single-vesicle fusion events with VC peptide. The histogram shows the dwell time in the docked but unfused state for 36 fusion events observed in real time with the tethered vesicle assay in the presence of VC peptide at 5 μM. Data were obtained with 3 s time resolution. See Fig. S9 for six examples of real-time FRET traces. Movie S1 shows an example of a single fusion event.
Single-vesicle FRET analysis of bulk vesicle mixtures
Finally, to directly compare results from the bulk assay and the tethered vesicle assay, we mixed together v- and t-SNARE vesicles in the usual bulk conditions (as in Fig. S1 a). At various reaction times over the course of 2–3 h, we removed a small sample from the mixture, quickly diluted it by a factor of 1000, and then plated the vesicles and vesicle pairs sparsely onto a glass coverslip for two-color imaging with alternating laser excitation. The time lag between dilution of the sample and imaging was <10 min for each data point. At each reaction time point, ∼100–500 individual v-SNARE vesicles contributed to the data set. Histograms showing the FRET efficiencies E of colocalized v- and t-SNARE vesicle pairs were obtained in the absence (Fig. S10 a) and presence (Fig. S10 b) of VC peptide. Histograms of all of v-SNARE vesicle FRET intensities are shown in Fig. S11, a and b. The main feature of each FRET efficiency histogram is a broad distribution of nonzero values centered at E = 0.6–0.7, which grows as a function of reaction time. There is little or no E = 0 peak in Fig. S10 because the sparse plating of the bulk mixture essentially eliminates false colocalization of undocked vesicle pairs.
We distinguished docked but unfused from docked and fused (or hemifused) pairs using the same E = 0.25 FRET efficiency threshold. After correcting for E = 0 events that arise from false colocalizations between vesicles, we determined docking curves for v- and t-SNARE vesicles in both the absence (Fig. 6, a and b) and presence (Fig. 6, c and d) of VC peptide. The bulk assay docking curves (Fig. 6) are qualitatively similar to those obtained from the tethered-vesicle assay (Fig. 4). Again, we found no statistically significant evidence of any docked but unfused vesicle pairs, indicating that docking is also the slow step in the bulk vesicle fusion assay. The initial slope of the docking curve without VC peptide (Fig. 6 b) gives the estimate kdock,bulk = (4.7 ± 0.2) × 103 M−1·s−1. In the presence of VC peptide (Fig. 6 d), kdock,bulk = (11 ± 2) × 104 M−1·s−1. Both with and without VC peptide, the kdock-values in bulk are three to four times greater than those obtained from the tethered-vesicle assay, suggesting that tethering hinders the docking efficiency.
Figure 6.
Docking and fusion versus time in bulk assay. The percentage of free v-SNARE vesicles that docked but did not fuse with a free t-SNARE vesicle (gray data points) or docked and fused with a free t-SNARE vesicle (black data points) at each reaction time is shown, as determined by a vesicle pair's absolute FRET efficiency. Mixtures were 10 nM t-SNARE vesicles and 5 nM v-SNARE vesicles without VC peptide (a and b) and in the presence of 5 μM VC peptide (c and d). The total docking curves in panels b and d are the sum of the docked and fused plus the docked but unfused curves in panels a and c. Docked but unfused curves are corrected for false colocalizations between a v-SNARE vesicle and a t-SNARE vesicle (see Supporting Material). The dotted lines represent the linear fits to the total docking curves that were used to determine kdock,bulk.
As a control, we incubated v-SNARE vesicles with DiI-labeled, protein-free vesicles in bulk for 3 h and then plated a diluted sample onto glass. This yielded no significant FRET between labels (Fig. S11, c and d). We also incubated v-SNARE vesicles with VC peptide plus DiI-labeled t-SNARE vesicles that mimic the t-SNAREs after BoNT/E cleavage (Fig. S11 e) and again found no significant FRET. Evidently, no significant exchange of donor/acceptor labels occurs between vesicles on a 3-h timescale, and immobilization onto a glass surface does not induce substantial lipid mixing. These controls suggest that our method may prove useful for analyzing docking and fusion kinetics in bulk fusion assays in the future.
Discussion
Experimental docking rate
In 1998, Weber and co-workers (8) were the first to our knowledge to show that full-length neuronal SNARE proteins are capable of catalyzing vesicle-vesicle fusion in vitro. We estimate that in the ensuing 12 years, 33 articles describing neuronal SNARE-induced bulk vesicle fusion were published. These studies reported the effects of SNARE truncations (27,28); of adding presynaptic proteins such as synaptotagmins (11,12,16–18,24,25,29,30), double C2 domain (doc2) proteins (31), Munc-18 (14,32), the Ca2+-dependent activator protein for secretion (CAPS) (9,33), complexins (15,34–36), calmodulin (37), and synaptophysin (37); of adding synthetic PEG polymers (38) and peptides (13,20,25); and of changing the lipid content (39), reconstitution method (23), or protein/lipid ratio (40). One result these studies had in common was an extremely slow composite timescale of docking and fusion (tens of minutes to a few hours) relative to the timescale of fusion in vivo (hundreds of microseconds to a few milliseconds) (19).
Here, we repeated the bulk fusion assay using vesicles reconstituted with a syb concentration that approximates the surface density in synaptic vesicles (41). The v-SNARE vesicles dock and fuse with t-SNARE vesicles in bulk solution on a 1–2-h timescale (Fig. S2), in qualitative agreement with bulk fusion experiments performed under similar conditions in other labs (8,20,23,24). To dissect the vesicle-vesicle docking kinetics, we sampled the bulk fusion mixture at ∼15-min intervals over a 120-min period, plated the vesicles sparsely onto glass, and directly interrogated them using alternating laser excitation two-color fluorescence microscopy (42). This enabled us to directly count instances of colocalization between single t- and v-SNARE vesicles, yielding an effective bimolecular docking rate constant kdock,bulk = (4.7 ± 0.2) × 103 M−1·s−1.
At concentrations of 5 nM v-SNARE vesicles and 10 nM t-SNARE vesicles, half of the v-SNARE vesicles underwent at least one docking event to a t-SNARE vesicle in ∼200 min. Quantitative measurement of the FRET efficiency of single-vesicle pairs, and interpretation of the FRET efficiency values using Förster theory and model configurations showed that 589 of 606 (97%) of the docked v- and t-SNARE vesicle pairs had fused together before the 10-min timescale of the measurement. Addition of VC peptide, syb(57–92), to the SNARE-bearing vesicle mixture resulted in kdock,bulk = (11 ± 2) × 104 M−1·s−1, a ∼25-fold enhancement of the docking rate constant. Similarly, 2336 of 2398 docked pairs (97%) fused before the measurement was obtained. Our modeling showed that we could not distinguish between populations of hemifused and fully fused vesicle pairs using a DiI/DiD FRET pair at a 2% labeling fraction. Therefore, our docked and fused population may include vesicles that are hemifused/partially mixed. This argues against a previous assignment of E = 0.35 to the hemifusion state (21,43).
For comparison, we also studied free t-SNARE vesicles docking and fusing with v-SNARE vesicles that had been tethered to a passivated PEG surface. The resulting docking rate constants were kdock,teth = (1.2 ± 0.1) × 103 M−1·s−1 in the absence of VC peptide and kdock,teth = (4.2 ± 0.3) × 104 M−1·s−1 in the presence of VC peptide. Again, we did not observe any appreciable accumulation of docked but unfused intermediates. We estimate that 648 of 672 (96%) of docked pairs without VC peptide, and 8364 of 8799 (95%) of docked pairs with VC peptide fused within the 5-min time resolution of the measurement. Together, these results indicate that in the bulk sampling experiments, the glass surface did not induce the observed fusion to an appreciable extent. The near absence of docked but unfused v-SNARE/t-SNARE vesicle pairs in both experiments clearly demonstrates that docking is the rate-limiting step in the vesicle-vesicle fusion reaction.
Finally, by directly monitoring single docking and fusion events in the tethered-vesicle assay in the presence of VC peptide in real time, we found that the majority of docked vesicles fused in ∼10 s. For comparison, the characteristic timescale on which a single tethered v-SNARE vesicle docks its first t-SNARE vesicle in the presence of VC peptide at a concentration of 10 nM is τdock = (10 nM × 4.2 × 104 M−1·s−1)−1 = 2400 s = 40 min, ∼200 times longer than the fusion timescale. Direct observation of kfus ∼0.1 s−1 further demonstrates that docking is the slow step in the presence of VC peptide. We were unable to study individual docking and fusion events in the absence of VC because the docking efficiency was too low.
Simple docking model
Here we compare the experimental docking rate constants with a simple estimate of the rate kV+T of vesicle-vesicle close encounters to estimate the docking efficiency per encounter. The diffusion-limited rate constant for collisions between two freely diffusing spheres in bulk solution is given by (44):
| (2) |
The rate constant has units of M−1·s−1 (here the molarity is defined as moles of vesicles per L, NA is Avogadro's number, RV and RT are the v- and t-SNARE vesicle radii, and DV and DT are their diffusion coefficients). For our vesicles, RV ∼ RT ∼25 nm and DV ∼ DT ∼3.3 × 10⁻⁸ cm2·s−1 (42), yielding kdiff ∼2.5 × 10⁹ M−1·s−1.
However, the incomplete surface coverage of v- and t-SNARE protein causes kV+T to be smaller than kdiff. We define kV+T as the rate constant for complementary t-SNARE and v-SNARE proteins on two different vesicles to come close enough to touch and potentially form a SNARE complex. To better estimate this close-encounter rate, we use a simple model that treats t-SNAREs and v-SNAREs as immobile, disk-shaped absorbing patches with common radius si = 2 nm (Fig. S12). As previously shown by Berg (44), a fairly sparse set of such absorbing disks on the surface of a sphere can cause diffusive flux onto the sphere, in similarity to the case in which the entire sphere is absorbing (as in Eq. 2 above). In comparison with a completely absorbing sphere, the diffusive flux for a sphere partially covered by absorbing patches is diminished by a correction factor of (1 + πRi/Nisi)−1, where Ri is the target vesicle radius, Ni is the number of absorbing disks, si is the radius of each disk, and i = T or V labels the type of vesicle. This factor approaches one as Nisi becomes large, approaches zero as Nisi approaches zero; and is 1/2 when Nisi = πRi.
Our refined formula for the rate constant for vesicle-vesicle encounters in which a t-SNARE touches a v-SNARE in bulk solution becomes
| (3) |
In our case, using NT = 65 t-SNAREs per vesicle, NV = 45 v-SNAREs per vesicle, and using the rough estimate sT = sV = 2 nm, the correction factor becomes ∼0.6 for t-SNARE vesicles and ∼0.5 for the v-SNARE vesicles. The overall close-encounter rate constant is kV+T ∼ 0.3 kdiff ∼ 8 × 10⁸ M−1·s−1. The estimated probability of successful docking per effective encounter event (pdock) is then the ratio of our experimentally derived docking rate constant kdock to kV+T.
In the bulk fusion assay, this yields pdock = kdock,bulk /kV+T ∼ 6 × 10⁻⁶ without VC peptide and pdock ∼ 1.4 × 10⁻⁴ with VC peptide. In the absence of VC peptide, ∼170,000 close encounters are required to form one docked vesicle pair, and with VC peptide, ∼7000 close encounters are required. Such low values of pdock strongly suggest that typical v-SNARE/ t-SNARE pairs are highly inert, i.e., unable to form trans-vesicle SNARE complexes on the timescale of the collision. The estimated values of pdock for the tethered-vesicle assay would be even smaller, perhaps due to geometric constraints on the approach of t-SNARE vesicles to tethered v-SNARE vesicles or to some degree of interference by the nearby passivated surface.
Mechanistic implications
By using the same materials in bulk and single-vesicle assays, we were able to clearly show that docking is the rate-limiting step in a bulk vesicle-vesicle fusion reaction driven by full-length neuronal SNARE proteins. In our assay, enhancement of the overall fusion kinetics by addition of VC peptide is entirely due to enhancement of the docking efficiency, and not to any direct effect on the fusion step. A clean comparison with experiments performed in other laboratories is frustrated by the wide variability in the proteins, lipid compositions, protein/lipid ratios, detergents, protein and vesicle purification procedures, vesicle concentrations, and temperatures used to study this reaction. Nevertheless, our results may have widespread significance for proper interpretation of other bulk fusion assays.
Previous studies have reported enhancement of the lipid mixing rate between vesicles containing full-length neuronal SNAREs in the presence of 1), synaptotagmin1 (syt1) (11,45); 2), the soluble domain of syt1, C2AB, in the absence (11) or presence of Ca2+ (12,15,17,24,25,29,30,34,46); 3), the soluble domains of other synaptotagmin isoforms (29,46); 4), CAPS, the Ca2+-dependent activator protein for secretion (9,33); or 5), doc2 proteins (31). All of these results may reflect increased docking efficiency in the presence of the accessory protein rather than acceleration of the transition from the docked state to the fused state. Our data are also consistent with the suggestion that low-temperature preincubations that give rise to a burst of fast lipid mixing (8,14,27,32,35,36) accumulate docked but unfused vesicle pairs that fuse simultaneously once the temperature is raised to 37°C.
In our bulk assay, addition of VC peptide enhances kdock,bulk by more than an order of magnitude. Presumably, VC peptide binds to the C-terminus of the SNARE motif of syx and SNAP-25, where the corresponding amino acids in syb bind in the ternary SNARE complex (3,20). Previous work with soluble protein domains suggested that VC peptide may help prevent the formation of off-pathway 2:1 syx/SNAP-25 complexes (13). However, our t-SNAREs are coexpressed in bacteria and are present in a 1:1 overall syx/SNAP-25 stoichiometry in the vesicle, indicating that 2:1 complexes are not important here. In other studies, VC peptide stimulated bulk vesicle-vesicle lipid mixing to a similar extent regardless of whether the Habc domain was present (20), which argues against a large effect due to VC stabilization of the open syx conformation. In addition, it was shown that reconstitution of t-SNARE vesicles with a constitutively open syx mutant does not affect bulk vesicle-vesicle lipid mixing kinetics (32).
Considering all of these results, we suggest that the VC peptide may stimulate docking by nucleating t-SNARE folding upon binding. Accordingly, the results of circular dichroism spectroscopy on soluble SNARE domains (13) and proteolysis protection experiments on full-length SNAREs reconstituted into vesicles (20) suggest that the t-SNAREs assume a more ordered secondary structure in the presence of VC peptide. However, we cannot exclude the possibility that the presence of VC peptide simply helps prevent the t-SNAREs from self-aggregating into large, inert mounds, as directly observed in atomic force microscopy studies of supported lipid bilayers made from t-SNARE vesicles (47).
The neuronal proteins syt1 (10–12,15–18,24,25,30,34,45), CAPS (9,33), and doc2 (31) have all been shown to bind t-SNAREs in vitro. It seems entirely possible that these proteins may enhance docking by a mechanism similar to that of VC peptide, either by nucleating folding within the 1:1 t-SNARE acceptor complex (48) or by reducing t-SNARE self-aggregation.
Comparison with other docking and fusion assays
We have shown that for our materials, docking is the slow step in both the bulk and single-vesicle assays; however, there remains tremendous variability among the results of single- or few-vesicle assays that are capable of separating the docking kinetics from the fusion kinetics. In a similar tethered vesicle assay using neuronal SNAREs, Yoon and co-workers (43) found that 27% of tethered v-SNARE vesicles docked a t-SNARE vesicle from solution after 15 min when the t-SNARE vesicles were present at only 200 pM in the absence of VC peptide. This docking was much more efficient than that observed in our assay. However, in their study, the docked vesicle pairs fused together on a timescale of tens of minutes, which is much slower than ours (43). The most obvious difference between their experiment and ours is that they used an N-terminally truncated version of syx (residues 168–288), which lacks the Habc domain. In addition, they made their t-SNARE vesicles by expressing and purifying syx and SNAP-25 separately, mixing the proteins together in detergent, and then mixing the protein/detergent solution with preformed vesicles. The method of reconstitution may well be an important variable.
Cypionka and co-workers (49) used fluorescence cross-correlation spectroscopy (FCCS) and fluorescence lifetime measurements to monitor docking and fusion between v- and t-SNARE vesicles in solution at room temperature. Their t-SNARE vesicles contained a stabilized acceptor complex, which included syx(183–288), SNAP-25, and syb(49–96) (a peptide similar to the VC peptide, syb(57–92)). The vesicles also contained 10% cholesterol and phospholipids derived from bovine brain. At vesicle concentrations of 1–10 nM each, they observed quite efficient docking with a time constant of 70 s, followed by fusion with a time constant of 840 s. These results are again very different from ours. The FCCS study also used truncated syx rather than the full-length syx used here.
Several other groups have developed in vitro assays that resolve docking from fusion by monitoring single v-SNARE vesicles interacting with a supported lipid bilayer containing t-SNARE proteins (47,50–53). The docking and fusion kinetics derived from these experiments vary tremendously and cannot be directly compared with bulk fusion experiments.
Conclusions
In conclusion, we believe that typical bulk vesicle-vesicle fusion assays are not well suited for studying the fusion step of neuronal exocytosis without significant refinement. These assays may well be insensitive to modulation of the key transition from a docked vesicle pair to the fusion product. Investigation of this fascinating event using the reconstitution approach requires time resolution of the fusion kinetics, which is currently possible only with single- or few-vesicle methods such as surface-tethered vesicle assays (43), FCCS/lifetime measurements (49), and cushioned lipid bilayers (52,53).
Acknowledgments
The authors thank Prof. Ed Chapman (Department of Physiology, University of Wisconsin) for many fruitful discussions, Enfu Hui for sharing electron microscopy data, and Dr. Jon Gaffaney for the gift of t-SNARE proteins that mimic the BoNT/E cleavage product, syb(1–94), and helpful advice regarding expression and purification of the other SNARE proteins used in this study.
The National Institute of Neurological Disorders and Stroke funded this work under grant 5R01NS051518.
Supporting Material
References
- 1.Südhof T.C., Rothman J.E. Membrane fusion: grappling with SNARE and SM proteins. Science. 2009;323:474–477. doi: 10.1126/science.1161748. [DOI] [PMC free article] [PubMed] [Google Scholar]
- 2.Stein A., Weber G., Jahn R. Helical extension of the neuronal SNARE complex into the membrane. Nature. 2009;460:525–528. doi: 10.1038/nature08156. [DOI] [PMC free article] [PubMed] [Google Scholar]
- 3.Sutton R.B., Fasshauer D., Brunger A.T. Crystal structure of a SNARE complex involved in synaptic exocytosis at 2.4 A resolution. Nature. 1998;395:347–353. doi: 10.1038/26412. [DOI] [PubMed] [Google Scholar]
- 4.Fasshauer D., Antonin W., Jahn R. SNARE assembly and disassembly exhibit a pronounced hysteresis. Nat. Struct. Biol. 2002;9:144–151. doi: 10.1038/nsb750. [DOI] [PubMed] [Google Scholar]
- 5.McNew J.A. Regulation of SNARE-mediated membrane fusion during exocytosis. Chem. Rev. 2008;108:1669–1686. doi: 10.1021/cr0782325. [DOI] [PubMed] [Google Scholar]
- 6.Brunger A.T., Jin R., Breidenbach M.A. Highly specific interactions between botulinum neurotoxins and synaptic vesicle proteins. Cell. Mol. Life Sci. 2008;65:2296–2306. doi: 10.1007/s00018-008-8088-0. [DOI] [PMC free article] [PubMed] [Google Scholar]
- 7.Sudhof T.C. The synaptic vesicle cycle. Annu. Rev. Neurosci. 2004;27:509–547. doi: 10.1146/annurev.neuro.26.041002.131412. [DOI] [PubMed] [Google Scholar]
- 8.Weber T., Zemelman B.V., Rothman J.E. SNAREpins: minimal machinery for membrane fusion. Cell. 1998;92:759–772. doi: 10.1016/s0092-8674(00)81404-x. [DOI] [PubMed] [Google Scholar]
- 9.James D.J., Khodthong C., Martin T.F. Phosphatidylinositol 4,5-bisphosphate regulates SNARE-dependent membrane fusion. J. Cell Biol. 2008;182:355–366. doi: 10.1083/jcb.200801056. [DOI] [PMC free article] [PubMed] [Google Scholar]
- 10.Lu X.B., Xu Y.B., Shin Y.K. Synaptotagmin I and Ca(2+) promote half fusion more than full fusion in SNARE-mediated bilayer fusion. FEBS Lett. 2006;580:2238–2246. doi: 10.1016/j.febslet.2006.03.035. [DOI] [PubMed] [Google Scholar]
- 11.Mahal L.K., Sequeira S.M., Söllner T.H. Calcium-independent stimulation of membrane fusion and SNAREpin formation by synaptotagmin I. J. Cell Biol. 2002;158:273–282. doi: 10.1083/jcb.200203135. [DOI] [PMC free article] [PubMed] [Google Scholar]
- 12.Martens S., Kozlov M.M., McMahon H.T. How synaptotagmin promotes membrane fusion. Science. 2007;316:1205–1208. doi: 10.1126/science.1142614. [DOI] [PubMed] [Google Scholar]
- 13.Pobbati A.V., Stein A., Fasshauer D. N- to C-terminal SNARE complex assembly promotes rapid membrane fusion. Science. 2006;313:673–676. doi: 10.1126/science.1129486. [DOI] [PubMed] [Google Scholar]
- 14.Rodkey T.L., Liu S., McNew J.A. Munc18a scaffolds SNARE assembly to promote membrane fusion. Mol. Biol. Cell. 2008;19:5422–5434. doi: 10.1091/mbc.E08-05-0538. [DOI] [PMC free article] [PubMed] [Google Scholar]
- 15.Schaub J.R., Lu X.B., McNew J.A. Hemifusion arrest by complexin is relieved by Ca2+-synaptotagmin I. Nat. Struct. Mol. Biol. 2006;13:748–750. doi: 10.1038/nsmb1124. [DOI] [PubMed] [Google Scholar]
- 16.Stein A., Radhakrishnan A., Jahn R. Synaptotagmin activates membrane fusion through a Ca2+-dependent trans interaction with phospholipids. Nat. Struct. Mol. Biol. 2007;14:904–911. doi: 10.1038/nsmb1305. [DOI] [PubMed] [Google Scholar]
- 17.Tucker W.C., Weber T., Chapman E.R. Reconstitution of Ca2+-regulated membrane fusion by synaptotagmin and SNAREs. Science. 2004;304:435–438. doi: 10.1126/science.1097196. [DOI] [PubMed] [Google Scholar]
- 18.Xue M.S., Ma C., Rizo J. The Janus-faced nature of the C(2)B domain is fundamental for synaptotagmin-1 function. Nat. Struct. Mol. Biol. 2008;15:1160–1168. doi: 10.1038/nsmb.1508. [DOI] [PMC free article] [PubMed] [Google Scholar]
- 19.Chapman E.R. How does synaptotagmin trigger neurotransmitter release? Annu. Rev. Biochem. 2008;77:615–641. doi: 10.1146/annurev.biochem.77.062005.101135. [DOI] [PubMed] [Google Scholar]
- 20.Melia T.J., Weber T., Rothman J.E. Regulation of membrane fusion by the membrane-proximal coil of the t-SNARE during zippering of SNAREpins. J. Cell Biol. 2002;158:929–940. doi: 10.1083/jcb.200112081. [DOI] [PMC free article] [PubMed] [Google Scholar]
- 21.Yoon T.Y., Okumus B., Ha T. Multiple intermediates in SNARE-induced membrane fusion. Proc. Natl. Acad. Sci. USA. 2006;103:19731–19736. doi: 10.1073/pnas.0606032103. [DOI] [PMC free article] [PubMed] [Google Scholar]
- 22.Kapanidis A.N., Lee N.K., Weiss S. Fluorescence-aided molecule sorting: analysis of structure and interactions by alternating-laser excitation of single molecules. Proc. Natl. Acad. Sci. USA. 2004;101:8936–8941. doi: 10.1073/pnas.0401690101. [DOI] [PMC free article] [PubMed] [Google Scholar]
- 23.Chen X.C., Araç D., Rizo J. SNARE-mediated lipid mixing depends on the physical state of the vesicles. Biophys. J. 2006;90:2062–2074. doi: 10.1529/biophysj.105.071415. [DOI] [PMC free article] [PubMed] [Google Scholar]
- 24.Gaffaney J.D., Dunning F.M., Chapman E.R. Synaptotagmin C2B domain regulates Ca2+-triggered fusion in vitro: critical residues revealed by scanning alanine mutagenesis. J. Biol. Chem. 2008;283:31763–31775. doi: 10.1074/jbc.M803355200. [DOI] [PMC free article] [PubMed] [Google Scholar]
- 25.Chicka M.C., Hui E.F., Chapman E.R. Synaptotagmin arrests the SNARE complex before triggering fast, efficient membrane fusion in response to Ca2+ Nat. Struct. Mol. Biol. 2008;15:827–835. doi: 10.1038/nsmb.1463. [DOI] [PMC free article] [PubMed] [Google Scholar]
- 26.Wang T.T., Smith E.A., Weisshaar J.C. Lipid mixing and content release in single-vesicle, SNARE-driven fusion assay with 1-5 ms resolution. Biophys. J. 2009;96:4122–4131. doi: 10.1016/j.bpj.2009.02.050. [DOI] [PMC free article] [PubMed] [Google Scholar]
- 27.Parlati F., Weber T., Rothman J.E. Rapid and efficient fusion of phospholipid vesicles by the α-helical core of a SNARE complex in the absence of an N-terminal regulatory domain. Proc. Natl. Acad. Sci. USA. 1999;96:12565–12570. doi: 10.1073/pnas.96.22.12565. [DOI] [PMC free article] [PubMed] [Google Scholar]
- 28.McNew J.A., Weber T., Rothman J.E. The length of the flexible SNAREpin juxtamembrane region is a critical determinant of SNARE-dependent fusion. Mol. Cell. 1999;4:415–421. doi: 10.1016/s1097-2765(00)80343-3. [DOI] [PubMed] [Google Scholar]
- 29.Bhalla A., Chicka M.C., Chapman E.R. Analysis of the synaptotagmin family during reconstituted membrane fusion. Uncovering a class of inhibitory isoforms. J. Biol. Chem. 2008;283:21799–21807. doi: 10.1074/jbc.M709628200. [DOI] [PMC free article] [PubMed] [Google Scholar]
- 30.Hui E.F., Johnson C.P., Chapman E.R. Synaptotagmin-mediated bending of the target membrane is a critical step in Ca(2+)-regulated fusion. Cell. 2009;138:709–721. doi: 10.1016/j.cell.2009.05.049. [DOI] [PMC free article] [PubMed] [Google Scholar]
- 31.Groffen A.J., Martens S., Verhage M. Doc2b is a high-affinity Ca2+ sensor for spontaneous neurotransmitter release. Science. 2010;327:1614–1618. doi: 10.1126/science.1183765. [DOI] [PMC free article] [PubMed] [Google Scholar]
- 32.Shen J.S., Tareste D.C., Melia T.J. Selective activation of cognate SNAREpins by Sec1/Munc18 proteins. Cell. 2007;128:183–195. doi: 10.1016/j.cell.2006.12.016. [DOI] [PubMed] [Google Scholar]
- 33.James D.J., Kowalchyk J., Martin T.F. CAPS drives trans-SNARE complex formation and membrane fusion through syntaxin interactions. Proc. Natl. Acad. Sci. USA. 2009;106:17308–17313. doi: 10.1073/pnas.0900755106. [DOI] [PMC free article] [PubMed] [Google Scholar]
- 34.Chicka M.C., Chapman E.R. Concurrent binding of complexin and synaptotagmin to liposome-embedded SNARE complexes. Biochemistry. 2009;48:657–659. doi: 10.1021/bi801962d. [DOI] [PMC free article] [PubMed] [Google Scholar]
- 35.Malsam J., Seiler F., Söllner T.H. The carboxy-terminal domain of complexin I stimulates liposome fusion. Proc. Natl. Acad. Sci. USA. 2009;106:2001–2006. doi: 10.1073/pnas.0812813106. [DOI] [PMC free article] [PubMed] [Google Scholar]
- 36.Seiler F., Malsam J., Söllner T.H. A role of complexin-lipid interactions in membrane fusion. FEBS Lett. 2009;583:2343–2348. doi: 10.1016/j.febslet.2009.06.025. [DOI] [PMC free article] [PubMed] [Google Scholar]
- 37.Siddiqui T.J., Vites O., Fasshauer D. Determinants of synaptobrevin regulation in membranes. Mol. Biol. Cell. 2007;18:2037–2046. doi: 10.1091/mbc.E07-01-0049. [DOI] [PMC free article] [PubMed] [Google Scholar]
- 38.Dennison S.M., Bowen M.E., Lentz B.R. Neuronal SNAREs do not trigger fusion between synthetic membranes but do promote PEG-mediated membrane fusion. Biophys. J. 2006;90:1661–1675. doi: 10.1529/biophysj.105.069617. [DOI] [PMC free article] [PubMed] [Google Scholar]
- 39.Melia T.J., You D.Q., Rothman J.E. Lipidic antagonists to SNARE-mediated fusion. J. Biol. Chem. 2006;281:29597–29605. doi: 10.1074/jbc.M601778200. [DOI] [PubMed] [Google Scholar]
- 40.Lu X.B., Zhang F., Shin Y.K. Membrane fusion induced by neuronal SNAREs transits through hemifusion. J. Biol. Chem. 2005;280:30538–30541. doi: 10.1074/jbc.M506862200. [DOI] [PubMed] [Google Scholar]
- 41.Takamori S., Holt M., Jahn R. Molecular anatomy of a trafficking organelle. Cell. 2006;127:831–846. doi: 10.1016/j.cell.2006.10.030. [DOI] [PubMed] [Google Scholar]
- 42.Schuette C.G., Hatsuzawa K., Jahn R. Determinants of liposome fusion mediated by synaptic SNARE proteins. Proc. Natl. Acad. Sci. USA. 2004;101:2858–2863. doi: 10.1073/pnas.0400044101. [DOI] [PMC free article] [PubMed] [Google Scholar]
- 43.Yoon T.Y., Lu X., Shin Y.K. Complexin and Ca2+ stimulate SNARE-mediated membrane fusion. Nat. Struct. Mol. Biol. 2008;15:707–713. doi: 10.1038/nsmb.1446. [DOI] [PMC free article] [PubMed] [Google Scholar]
- 44.Berg H.C. Princeton University Press; Princeton, NJ: 1993. Random Walks in Biology. [Google Scholar]
- 45.Loewen C.A., Lee S.M., Reist N.E. C2B polylysine motif of synaptotagmin facilitates a Ca2+-independent stage of synaptic vesicle priming in vivo. Mol. Biol. Cell. 2006;17:5211–5226. doi: 10.1091/mbc.E06-07-0622. [DOI] [PMC free article] [PubMed] [Google Scholar]
- 46.Bhalla A., Tucker W.C., Chapman E.R. Synaptotagmin isoforms couple distinct ranges of Ca2+, Ba2+, and Sr2+ concentration to SNARE-mediated membrane fusion. Mol. Biol. Cell. 2005;16:4755–4764. doi: 10.1091/mbc.E05-04-0277. [DOI] [PMC free article] [PubMed] [Google Scholar]
- 47.Liu T.T., Tucker W.C., Weisshaar J.C. SNARE-driven, 25-millisecond vesicle fusion in vitro. Biophys. J. 2005;89:2458–2472. doi: 10.1529/biophysj.105.062539. [DOI] [PMC free article] [PubMed] [Google Scholar]
- 48.Weninger K., Bowen M.E., Brunger A.T. Accessory proteins stabilize the acceptor complex for synaptobrevin, the 1:1 syntaxin/SNAP-25 complex. Structure. 2008;16:308–320. doi: 10.1016/j.str.2007.12.010. [DOI] [PMC free article] [PubMed] [Google Scholar]
- 49.Cypionka A., Stein A., Walla P.J. Discrimination between docking and fusion of liposomes reconstituted with neuronal SNARE-proteins using FCS. Proc. Natl. Acad. Sci. USA. 2009;106:18575–18580. doi: 10.1073/pnas.0906677106. [DOI] [PMC free article] [PubMed] [Google Scholar]
- 50.Bowen M.E., Weninger K., Chu S. Single molecule observation of liposome-bilayer fusion thermally induced by soluble N-ethyl maleimide sensitive-factor attachment protein receptors (SNAREs) Biophys. J. 2004;87:3569–3584. doi: 10.1529/biophysj.104.048637. [DOI] [PMC free article] [PubMed] [Google Scholar]
- 51.Fix M., Melia T.J., Simon S.M. Imaging single membrane fusion events mediated by SNARE proteins. Proc. Natl. Acad. Sci. USA. 2004;101:7311–7316. doi: 10.1073/pnas.0401779101. [DOI] [PMC free article] [PubMed] [Google Scholar]
- 52.Domanska M.K., Kiessling V., Tamm L.K. Single vesicle millisecond fusion kinetics reveals number of SNARE complexes optimal for fast SNARE-mediated membrane fusion. J. Biol. Chem. 2009;284:32158–32166. doi: 10.1074/jbc.M109.047381. [DOI] [PMC free article] [PubMed] [Google Scholar]
- 53.Karatekin E., Di Giovanni J., Rothman J.E. A fast, single-vesicle fusion assay mimics physiological SNARE requirements. Proc. Natl. Acad. Sci. USA. 2010;107:3517–3521. doi: 10.1073/pnas.0914723107. [DOI] [PMC free article] [PubMed] [Google Scholar]
Associated Data
This section collects any data citations, data availability statements, or supplementary materials included in this article.