

Abstract
We report x-ray reflectivity and grazing incidence x-ray diffraction measurements of lipopolysaccharide (LPS) monolayers at the water-air interface. Our investigations reveal that the structure and lateral ordering of the LPS molecules is very different from phospholipid systems and can be modulated by the ionic strength of the aqueous subphase in an ion-dependent manner. Our findings also indicate differential effects of monovalent and divalent ions on the two-dimensional ordering of lipid domains. Na+ ions interact unspecifically with LPS molecules based on their ability to efficiently screen the negative charges of the LPS molecules, whereas Ca2+ ions interact specifically by cross-linking adjacent molecules in the monolayer. At low lateral pressures, Na+ ions present in the subphase lead to a LPS monolayer structure ordered over large areas with high compressibility, nearly hexagonal packing of the hydrocarbon chains, and high density in the LPS headgroup region. At higher film pressures, the LPS monolayer becomes more rigid and results in a less perfect, oblique packing of the LPS hydrocarbon chains as well as a smaller lateral size of highly ordered domains on the monolayer. Furthermore, associated with the increased surface pressure, a conformational change of the sugar headgroups occurs, leading to a thickening of the entire LPS monolayer structure. The effect of Ca2+ ions in the subphase is to increase the rigidity of the LPS monolayer, leading to an oblique packing of the hydrocarbon chains already at low film pressures, an upright orientation of the sugar moieties, and much smaller sizes of ordered domains in the plane of the monolayer. In the presence of both Na+- and Ca2+ ions in the subphase, the screening effect of Na+ is predominant at low film pressures, whereas, at higher film pressures, the structure and lateral organization of LPS molecules is governed by the influence of Ca2+ ions. The unspecific charge-screening effect of the Na+ ions on the conformation of the sugar moiety becomes less dominant at biologically relevant lateral pressures.
Introduction
Gram-negative bacteria are surrounded by two membranes, in contrast to most other types of cells. In the outer membrane, separating the cell from the periplasm and the intracellular space, lipids are asymmetrically distributed. The inner monolayer of the outer membrane is mainly composed of glycerophospholipids, whereas the outmost monolayer is largely built up by lipopolysaccharides (LPS) (1).
LPS consist of a vast invariant part, composed of a lipid part called lipid A and a covalently linked core oligosaccharide unit of different length (different rough mutants Re to Ra) carrying several negative charges. The lipid A part possesses four-to-seven hydrocarbon chains and two negatively charged or phosphorylated N-acetylglucosamines. The core oligosaccharide is connected to the lipid A moiety via a 2-keto-3-deoxyoctonoic (Kdo) acid by a 2–6 linkage (2,3). In addition to that structural element, another polysaccharide moiety (O-antigen) determining the serotype specificity can be connected to the core oligosaccharide (smooth-form LPS) (4,5). When LPS is released from the outer membrane—for example, by the action of immune components or simply by cell division—this can lead to pathophysiological effects including sepsis, septic shock, and multiorgan failure (6,7). Therefore, LPS are also known as endotoxins.
The function of LPS in the membrane is to stabilize the structural integrity of bacteria and to act as a protective barrier against chemical attacks (8,9), thus making the bacteria resistant to a variety of host defense factors, such as β-lysine, lysozyme, and various leukocyte proteins, which are known to be toxic to Gram-positive bacteria (10,11). Additionally, it has been shown that the outer membrane of Gram-negative bacteria inhibits the diffusion of many antibiotics, such as novobiocin, through the membrane, which are effective against other forms of bacteria (5).
Several in vivo studies have demonstrated that Gram-negative bacteria are resistant against antimicrobial peptides in the presence of divalent cations (12). Moreover, it has been found that divalent, but not monovalent cations lead to LPS aggregation (5) and cause structural rearrangements in the lipid A region (13). Ca2+ ions are essential for the stability of LPS membranes (14,15) and most of these ions have been found to interact with the inner core phosphate groups as well as with the inner core of the polysaccharides with an average coordination number of Ca2+ of 6.1 (15).
The deep rough LPS mutant, LPS Re, was extracted from Salmonella minnesota strain R595. The deep rough phenotype of LPS appears when bacteria are unable to attach their oligosaccharide core to the lipid A moiety. The molecular structure of LPS Re is shown in Fig. 1. The N-acetylglucosamines of the lipid A moiety are colored in red; the hydrocarbon chain region, consisting of six lipid chains, is depicted in blue; and Kdo is highlighted in green. Because of the missing oligosaccharide part, deep rough mutants lose almost entirely their resistance to a number of hydrophilic antibiotics, detergents, and lysozyme and they are permeable to steroids (9,16). The LPS Re is the shortest LPS unit required for the survival of the bacteria (17).
Figure 1.

Chemical structure of lipopolysaccharide (LPS Re). LPS Re is composed of two domains: (a) a lipid part comprising six hydrocarbon chains (highlighted in blue) and two phosphorylated (orange) N-acetylglucosamine units (red), referred to as Lipid A; and (b) a moiety containing two 2-keto-3-deoxyoctonic acid (Kdo, green) units. Two possible orientations of the Kdo units are displayed.
Owing to the lack of quantitative data on the effect of ions on the structural properties of LPS, we have investigated the influence of different ions on Langmuir-type monolayers composed of LPS Re spread on subphases containing monovalent (Na+) and divalent (Ca2+) ions as well as mixtures thereof. The Langmuir-type experiments allow additionally tuning of the lateral pressure profile, which can vary from one membrane type to another. The vertical and lateral structure as well as the packing properties of these LPS monolayers were analyzed by synchrotron x-ray reflectivity (XRR) and grazing incidence x-ray diffraction (GIXD), thus revealing a detailed, molecular-scale picture of the structural changes in the LPS layer caused by specific or nonspecific glycolipid-ion interactions.
Materials and Methods
Materials
The deep rough mutant lipopolysaccharide (LPS Re) was extracted from Salmonella minnesota strain R595 (17). Salts (NaCl, CaCl2) and phosphate buffer (H2PO4–/HPO42–) were purchased from Sigma (Taufkirchen, Germany) and used without further purification. Aqueous solutions were prepared using water filtered through a Milli-Q purification system (Millipore, Billerica, MA), yielding a specific electrical resistivity of >18 MΩ·cm.
Four different subphases were prepared: 1), a 10 mM phosphate buffer solution at a pH of 7; 2), 100 mM NaCl in 10 mM phosphate buffer solution; 3), a 50 mM CaCl2 solution; and 4), a 50 mM CaCl2 and 100 mM NaCl solution. LPS Re was dissolved in a mixture of chloroform and methanol (9:1 vol/vol) and spread on the aqueous subphases of different ion content.
The net charge of LPS Re, as used in this study, has been calculated from the molecular structure to be −3.6 e per molecule (18). The dissociation of surface-confined acids may be different from the degree of dissociation of the free acid, depending via the local pH on the electric potential of the surface (19). For instance, the pKa value of surface-confined carboxyl groups has been found to be much larger (∼7.7) compared to the pKa value of carboxylic acids in solution (∼5.5) (20). Therefore, the precise pKa values of charged groups in the LPS Re monolayer cannot be given, but it is expected that the carboxyl groups are mainly deprotonated and therefore negatively charged under the solution conditions used here.
Surface pressure-area isotherms
A Langmuir film balance (Riegler & Kirstein, Potsdam, Germany) was used to collect surface pressure-area isotherms: A Langmuir trough made from Teflon with a volume of 240 mL (as sketched in Evers et al. (21)) was used and equipped with a Wilhelmy plate sensor for measuring the lateral surface pressure, π, and a single moveable Teflon barrier, allowing for compression of the monolayers by changing the surface area, A.
LPS Re stock solution was spread at the air-subphase interface, and the system was equilibrated for 15 min to allow for complete evaporation of the organic solvents. Then, the films were compressed at a rate of compression of 5 Å2 molecule−1 min−1 until the desired film pressure was reached. The systems were examined by x-ray reflectivity and diffraction scans at four different lateral film pressures π of 10, 20, 30, and 40 mN/m.
For the x-ray scattering experiments, the Langmuir trough was placed in a sealed container with Kapton windows transparent to the x-rays and mounted on the diffractometer. All experiments were carried out at a temperature of 10°C (±2°C) to minimize lateral diffusion and thermal fluctuations in the monolayer at the air-water interface. Temperature-control was achieved via thermostated water flowing through the Teflon-coated metal basis of the trough. During the experiments, the container was flushed with helium to reduce background scattering from the gas phase and to prevent oxidative damage. Furthermore, radiation damage was reduced by lateral translation of the trough by 0.01 mm after every step during GIXD scans and by 2 mm after each reflectivity scan.
X-ray reflectivity and grazing incidence x-ray diffraction measurements
The x-ray scattering experiments were conducted at the liquid surface diffractometer of beamline BW1 at the synchrotron light source HASYLAB (Deutsches Elektronen-Synchrotron DESY, Hamburg, Germany) (22,23). A monochromatic x-ray wavelength, λ, of ∼1.3 Å (corresponding to a photon energy, E, of 9.5 keV) was selected by a Be (002) crystal. The monochromatic beam was deflected to an incident angle, αi, onto the liquid surface by tilting the monochromator crystal.
Reflectivity scans were carried out by measuring the scattered intensity as a function of αi under the specular condition αi = αf (exit angle, αf) using a NaI scintillation detector. Reflectivity measurements were performed in an angular range of 0.5 αc < αi < 35 αc with the critical angle of the air-water interface, αc (αc = 0.13° at the given wavelength). A typical x-ray reflectivity scan took ∼30 min.
In the grazing incidence x-ray diffraction (GIXD) scan, the liquid surface was illuminated at an incident angle of 0.85 αc, i.e., at an angle slightly below the critical angle of the air-water interface. Under this condition, the incident wave is totally reflected, while the refracted wave becomes evanescent, so that a layer of ∼90 Å beneath the interface is illuminated by x-rays and, thus, surface sensitivity is achieved. The scattered intensity was measured as a function of the angle between the incident and diffracted beam projected onto the horizontal plane, 2θ, using the MYTHEN detector, a noise-free, single-photon counting position-sensitive detector consisting of an Si sensor with 1280 strips. The detector has a vertical acceptance of 0 < Qz < 0.8 Å−1 and a horizontal resolution of ΔQxy = 0.0031 Å−1. In a typical GIXD scan, the detector is moved in 150 steps in an angular range of 16° < 2θ < 22° counting 10 s per step.
Analysis of x-ray scattering data
A detailed description of the theory of x-ray reflectometry (24–26) and grazing incidence x-ray diffraction (23,27) can be found in the literature. Here, we will give a brief account of the relations needed for the evaluation of the data (for more details, see the Supporting Material).
In the reflectivity experiment, incident and reflected beams are symmetrically arranged. Therefore, the momentum transfer has only a vertical component, Qz, which is given by
with the modulus of the wavevector k = 2π/λ.
The reflectivity, R, is given as the ratio of the specularly scattered intensity to the intensity of the incident x-ray beam. X-ray reflectivity measurements probe the electron density profile (EDP) of the sample averaged over the illuminated area (24,25).
Data reduction comprises background correction, normalization, and scaling of the data as a function of Qz. Due to the rapid decrease of the reflectivity with increasing Qz, reflectivity data are plotted as R/RF versus Qz, where RF is the Fresnel reflectivity of a sharp interface, to increase the visibility of features in the reflectivity curve stemming from the monomolecular layer at the surface (21,28,29). To retrieve the EDP from the reflectivity data, a model of the vertical structure of the system is proposed from which the reflectivity is calculated by Parratt's recursive method (30). In general, the EDP is given as a stack of homogeneous layers each with a distinct electron density, ρ, layer thickness, d, and interfacial roughness, σ, between adjacent layers. In our study, a model consisting of two layers representing the head and chain region of the LPS monolayer describes the reflectivity data adequately. Models consisting of only one layer did not yield appropriate refinements of the data.
Ordered films spread at the air-water interface may be described by a large number of two-dimensional crystalline domains randomly oriented around the surface-normal, which can therefore be described as a two-dimensional powder (23,31). In a GIXD experiment, the momentum transfer has a horizontal and vertical component, Qxy and Qz, respectively (23,27).
Reduction of the diffraction data comprises background correction, normalization, and scaling of the data as a function of momentum transfer. The diffraction data are presented as
-
1.
Contour plots, I(Qxy,Qz);
-
2.
GIXD patterns, I(Qxy), obtained by integrating along Qz; and
-
3.
Bragg rod profiles (23,31), I(Qz), obtained by integrating over the Qxy range of each Bragg peak, which are a measure of the thickness of the crystalline film.
The Qxy positions of the Bragg peaks yield the repeat distances, dhk, of the two-dimensional lattice of the alkyl chains according to dhk = 2π/Qxy, which can be indexed by the two Miller indices h, k to yield the two-dimensional unit cell. Thus, the two-dimensional crystal lattice parameters (a, b, γ) can be extracted from the horizontal position of the maxima of the Bragg peaks (23,31,32). We can limit the analysis to chainlike molecules with cylindrical symmetry which may pack in three different unit cells—hexagonal (a = b, γ = 120°), distorted hexagonal (a = b, γ ≠ 120°), or oblique (a ≠ b) (27,31).
The lateral two-dimensional crystalline domain length, Lxy, can be inferred from the full width at half-maximum (FWHM) of the Bragg peak, ΔQxy, corrected for instrumental resolution, according to the Scherrer equation (33).
Please note that x-ray reflectivity measurements average over the entire surface in the x-ray footprint area, and GIXD experiments only probe domains of two-dimensional crystalline order whereas the rest of the sample contributes to the background signal.
Results and Discussion
Pressure-area isotherms
Lateral pressure-area, π(Amol), isotherms of LPS monolayers spread on subphases of various ion content at 10°C are shown in Fig. 2. For LPS on pure buffer solution (black line), the onset of the isotherm can be found at 370 Å2/molecule, corresponding to an area per molecule, Amol, that is controlled by the interaction of neighboring lipopolysaccharides. The lowest value of 315 Å2/molecule is found for the monolayer on a 50 mM CaCl2 solution (blue line). Intermediate values with 345 Å2/molecule and 325 Å2/molecule were recorded for the 100 mM NaCl (red line) and the sample containing both salts, i.e., 100 mM NaCl and 50 mM CaCl2 (green line), respectively.
Figure 2.

Compression isotherms (lateral film pressure, π, as a function of area per molecule, Amol) of LPS monolayers spread on subphases of various ion content. (From top to bottom) Pure buffer solution (black line), 100 mM NaCl (red line), 100 mM NaCl and 50 mM CaCl2 (green), and 50 mM CaCl2 (blue).
At a film pressure of 30 mN/m—the lateral pressure typically found in biological membrane systems—the LPS molecules occupy nearly an identical area of 120 Å2/molecule in all four ionic solutions. Despite similar Amol values, the LPS films differ in their lateral compressibilities χ = − (1/A)(∂A/∂π) calculated from the isotherms at 30 mN/m. The smallest compressibility of ∼2.26·10−2 m/mN is found for the sample containing the divalent salt, 50 mM CaCl2. The largest χ-value of ∼2.90·10−2 m/mN is observed with 100 mM NaCl in the subphase. The corresponding values for the pure buffer solution and the sample containing 100 mM NaCl as well as 50 mM CaCl2 are ∼2.45·10−2 m/mN and ∼2.53·10−2 m/mN, respectively.
A distinct change of the slope of all isotherms is visible at ∼150 Å2/molecule. This is probably the point where the LPS molecules are finally oriented upright and are more or less densely arranged on the surface. Further decreasing the area per molecule leads to a further compression of the single molecules, resulting in a much higher film pressure and lower lateral compressibility of the film due to increased intermolecular interactions. A similar but more pronounced behavior including a distinct change in slope at ∼150 Å2/molecule at a nearly comparable film pressure has also been found in the compression isotherm of the pure lipid A at the air-water interface (34).
Analysis of the pressure-area isotherms reveals different scenarios for monovalent and divalent salts. The data suggest an unspecific charge screening of the anionic LPS film by the Na+ ions and a specific interaction with Ca2+ ions leading to a more rigid packing (lower χ-value) of the LPS molecules. For the LPS monolayer in pure buffer solution, the highest onset value of the surface pressure-area isotherms of all four subphases was observed, probably due to the strong repulsive electrostatic interactions of the equally charged LPS molecules. For the sample containing Na+ ions in the subphase, efficient screening of the negative charges (the Debye screening length decreases to 3 nm in 100 mM NaCl) results in lower onset values of the monolayer isotherms.
The lowest onset and at the same time the smallest compressibility at 30 mN/m was found for the monolayer on a solution rich in Ca2+ ions which can be explained by a condensation of the LPS molecules in the presence of Ca2+ ions, in agreement with literature data (35). The low compressibility of this sample can be explained by an efficient cross-linking of the condensed LPS molecules by divalent Ca2+ ions, facilitated by Ca2+ bridging the negatively charged saccharide units, which might be accompanied by dehydration effects.
The presence of both salts leads to intermediate onset values caused by the interplay of the unspecific charge screening effect of the Na+ ions and the compacting effect of the Ca2+ ions. Here, the cross-linking effect is reduced as compared to the sample with solely Ca2+ ions in the subphase, leading to smaller interconnected domains (supported by the GIXD measurements, see below) and, hence lower compressibility values as compared to the lipid sample on a pure NaCl solution.
Specular synchrotron x-ray reflectivity
The x-ray reflectivity (XRR) data, normalized to the Fresnel reflectivity RF, obtained from LPS monolayers at the air-water interface are presented together with their best fits (solid lines) on the left-hand side of Fig. 3. On the right-hand side, the normalized electron density profiles (EDPs) are depicted, which were retrieved from the refinement of the XRR data. For all three subphases studied, the effect of increasing film pressure is already clearly visible in the primary reflectivity data. In general, the minimum of the oscillation shifts to lower Qz values with increasing film pressure, hinting at a thickening of the LPS films, whereas the first oscillation of the reflectivity curves becomes more pronounced.
Figure 3.

(Left) X-ray reflectivity data (symbols) obtained from LPS monolayers at the air-water interface, presented together with the best fits (solid lines) normalized to the Fresnel reflectivity, RF. LPS monolayers were spread on subphases comprising (i) 100 mM NaCl, (ii) 50 mM CaCl2, and (iii) 100 mM NaCl and 50 mM CaCl2, and analyzed as a function of lateral film pressure. For clarity, the reflectivity curves are shifted along the y axis with increasing film pressure. (Right) Normalized electron density profiles as retrieved from the fits on the left-hand side. In the EDPs of (i) and (ii), the tentative molecular structures of LPS at low surface pressures are overlaid.
More detailed information on the vertical LPS film structure can be inferred from the EDPs, which display the vertical electron density of the LPS monolayer at the air-water interface (normalized to the electron density of water) as a function of distance from the water surface, z. On the left-hand side of the EDP diagrams, the subphase can be found at negative values of z, with an electron density value ρ(z) = ρH2O, followed by the polysaccharide region of the LPS film exhibiting a significantly higher electron density. At a distance z of ∼15 Å, the hydrocarbon chain region of lipid A sets in with an electron density similar to that of water. Finally, at a distance z of ∼28–30 Å, ρ(z) decays slowly to a value of zero representing the roughness between the hydrocarbon chains and the air. Detailed values characterizing the various layers of the LPS film in terms of thickness, roughness, and electron density as well as plots of the EDPs of all systems overlaid for each given film pressure can be found in Table S1 and Fig. S3 in the Supporting Material.
The electron density profiles of the LPS monolayer on the 100 mM NaCl solution (Fig. 3 i) show a continuous increase of the monolayer thickness with increasing film pressure. Between 10 mN/m and 20 mN/m, this increase of ∼4 Å is mainly caused by the polysaccharide headgroup region of LPS, whereas, for higher lateral pressures, the thickness of this region is almost constant, and the further marked thickness increase of the LPS layer takes place in the lipid A region only. The change of the electron density profile at lower film pressures indicates a distinct change in the packing of the LPS molecules concomitant with a stretching of the polysaccharide region.
The influence of increasing film pressure on the LPS monolayer on the 50 mM CaCl2 solution (Fig. 3 ii) is significantly smaller. The small increase in layer thickness originates, to a similar degree, from both the polysaccharide and the lipid A region of LPS. Interestingly, the distinct plateau of the polysaccharide layer in the EDP demonstrates that this region of the monolayer is highly ordered with only minor roughness at all film pressures, even at 10 mN/m (see Fig. S3 i). Here, the thickness of the polysaccharide region is much larger compared to the one found for LPS monolayers on the other subphases, indicating an ordering effect of Ca2+ on this region of the monolayer already at low film pressures. The thickness of the hydrocarbon chain region is not significantly different from the values found for the other monolayers, indicating a certain disorder of the hydrocarbon chains at 10 mN/m.
The effect of both kinds of ions, 100 mM NaCl and 50 mM CaCl2, on the monolayer structure can be seen in Fig. 3 iii. In this case, between film pressures of 10 and 20 mN/m a significant structural change in the polysaccharide region is observed, which is similar to that of the sample on 100 mM NaCl. Further increase of the film pressure leads only to a minor thickness increase of the structure.
At 10 mN/m, the LPS sample on the subphase containing only Na+ ions shows a significantly higher electron density in the polysaccharide region than at higher film pressures and, at the same time, a small layer thickness of the polysaccharide region (Fig. 1 a). Such compact arrangement is probably only possibly due to the charge screening effect of the Na+ ions. Upon increase of surface pressure, the sugar residues bend away toward the normal of the surface layer as depicted in Fig. 1 b. The electron density of the polysaccharide region is ∼5% lower in the bent conformation, whereas the thickness has increased by ∼3 Å due to reorientation of the Kdo region of the LPS molecule. A similar molecular conformation seems to be present in the absence of screening Na+ ions and for all LPS monolayers at higher film pressures.
In the monolayer on a subphase containing Ca2+ ions as well as Na+ ions, the cross-linking effect of the Ca2+ ions can still be observed, indicated by the distinct polysaccharide headgroup region and minor changes in the overall monolayer thickness with increasing film pressure. Only at low film pressures of 10 mN/m is the charge-screening effect of the Na+ ions still dominant, which leads to a reduction of the thickness of the polysaccharide headgroup region.
Grazing incidence diffraction
A representative contour plot of the intensity I(Qxy,Qz) along horizontal (Qxy) and vertical (Qz) scattering directions, as obtained from LPS monolayers at a lateral film pressure of π = 10 mN/m on a subphase containing 100 mM NaCl, is shown in Fig. 4 a. The splitting into two signals indicates a distorted hexagonal packing of the LPS hydrocarbon chains with Miller indices {10, 01} for the first peak and {} for the second one (27,31). We may assume that only a small fraction of the monolayer is probably in such an ordered state at this low film pressure, and the GIXD signals originate from these highly ordered, crystalline domains, only. In Fig. 4 b, the corresponding data of the LPS monolayer on a subphase containing Na+- and Ca2+ ions is depicted. Here, an additional peak is visible, indicating an oblique packing of the hydrocarbon chain region of the LPS. These peaks can be indexed by the Miller indices {10}, {01}, and {} (27,31).
Figure 4.
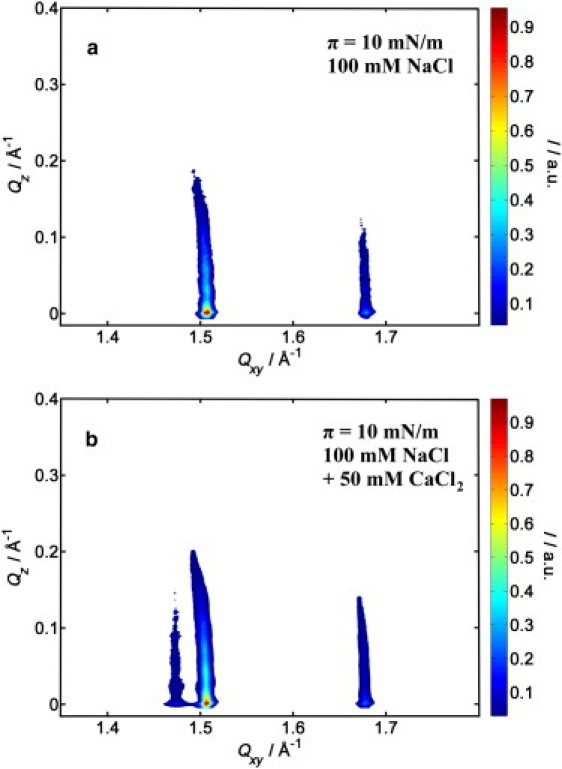
Two-dimensional contour plots of the intensity I(Qxy,Qz) along the horizontal (Qxy) and vertical (Qz) scattering directions as obtained from a LPS monolayer at a lateral film pressure of π = 10 mN/m on a subphase containing only (a) Na+ ions and (b) Na+- and Ca2+ ions.
In Fig. 5, the intensity I(Qxy) integrated along Qz (GIXD pattern) is shown for the various systems. All peaks were fitted by Gaussian functions to locate the position of the peak maxima as well as to determine their FWHM. From the positions of the peak maxima, the repeat distances of the lattice (d-spacings) could be calculated. The FWHM of the two-dimensional Bragg peaks hold direct information about the crystalline domain length Lxy of ordered areas in the monolayer. In almost all measurements, three two-dimensional Bragg peaks were detected, indicating an oblique packing of the hydrocarbon chains. Exceptions are the samples without Ca2+ ions, which exhibit two peaks for low film pressures (π = 10 mN/m), corresponding to a more symmetrical, distorted hexagonal packing of the lipid chains (a = b = 4.50 Å, γ ≈ 122°). Inspection of the {10} Bragg peak at Qxy ≈ 1.48 Å–1 in Fig. 5 reveals the general tendency that high film pressures favor an oblique packing of the lipid chains, i.e., high lateral pressures restrict symmetric ordering of the LPS chains leading to an increase of the intensity of the {10} peak. In the case of oblique packing, the two lattice vectors are of different lengths and γ ≈ 111.5° (all data calculated from the GIXD measurements are listed in Table S2 in the Supporting Material). The oblique unit cell has lattice constants of a ≈ 4.48 Å and b ≈ 4.58 Å at π = 10 mN/m.
Figure 5.
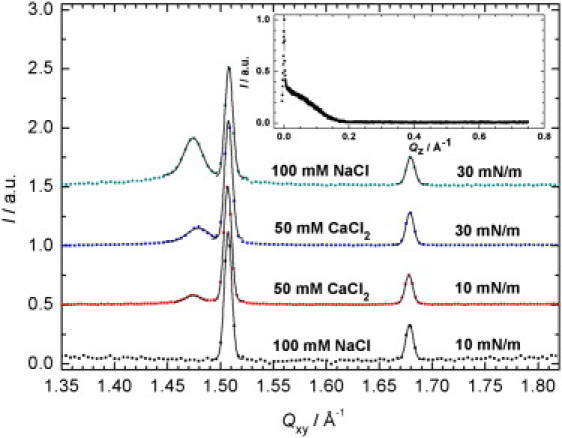
GIXD pattern I(Qxy) obtained by integrating along Qz for different LPS monolayers (squared symbols). Peaks were fitted by Gaussian functions (solid lines). For clarity, data are shifted vertically. The peaks can be denoted by their indices (from left to right): {10}, {01}, and {} in case of an oblique packing showing three signals, or {10, 01}, {} for a distorted hexagonal packing showing two signals. (Inset) Typical Bragg rod intensity profile I(Qz) obtained by integrating along the Qxy region of the Bragg peak. The absence of a peak at Qz ≠ 0 indicates little or no molecular tilt.
The occupied area per hydrocarbon chain, A, can be directly calculated from the lattice parameters. A-values of 18.8 Å2/chain in the distorted hexagonal packing and 19.1 Å2/chain for the oblique packing can be determined. From these data, the area per LPS molecule, each having six hydrocarbon chains, can be calculated to be ∼115 Å2. This value is in good agreement with the value found in the Langmuir isotherms at π = 30 mN/m (Fig. 2) and is comparable with a value of 129 Å2 for LPS Re and 127 Å2 for lipid A reported in the literature (34,35) as well as values between 110 and 125 Å2 for other lipopolysaccharides, depending on the length of the saccharide side group (36).
The inset in Fig. 5 depicts a typical Bragg rod intensity profile, I(Qz), obtained at the Qxy position of the {01} Bragg peak. The maximum at Qz = 0 is the so-called Vineyard-Yoneda peak (32), which arises from the interference between x-rays diffracted up into the Bragg rod and rays diffracted down and then reflected up by the interface. The absence of a further peak at Qz ≠ 0 indicates negligible or no molecular tilt of the hydrocarbon chains to the surface normal.
The crystalline domain lengths Lxy of ordered regions of all monolayers were calculated from the FWHM of each Bragg peak. The crystalline domain lengths calculated from the {10} reflection at Qxy ≈ 1.48 Å–1 are shown in Fig. 6 in dependency upon the film pressure and ionic composition of the subphase. Large crystalline domain lengths ranging from 150 to 300 Å and opposite effects of Na+- and Ca2+ ions on the crystalline domain length are found. Addition of Na+ ions leads to an increase of Lxy and hence the size of highly ordered domains in the monolayer. Probably owing to the effective screening of the negative charges of the LPS molecules (3.6 per molecule on average, –4 negative phosphates and carboxylates and one nonstoichiometric positive charged amino-arabinose (18)), a tight packing of LPS molecules over large areas of the lipid monolayer is facilitated. Conversely, Ca2+ ions reduce the possibility of the LPS molecules to build larger ordered domains. Remarkably, a decrease of the crystalline domain length and hence decreased long-range ordering is observed with increasing film pressure for all systems. Obviously, a highly ordered packing of the hydrocarbon chains over a large area in the monolayer is hampered by packing defects under these conditions of increased lateral pressures.
Figure 6.
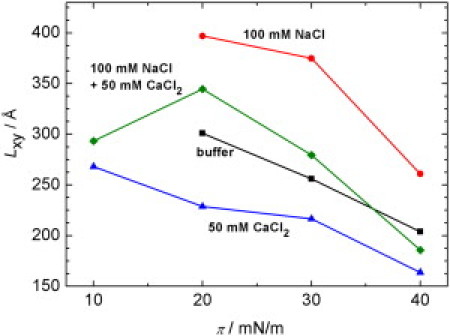
Crystalline domain length, Lxy, calculated from the {10} peak as a function lateral film pressure, π, of LPS spread on four different subphases: buffer; 100 mM NaCl; 50 mM CaCl2; and 100 mM NaCl + 50 mM CaCl2. For the samples containing no Ca2+ ions, the crystalline domain length at π = 10 mN/m could not be calculated due to the absence of a splitting of the {10, 01} signal in these measurements. The error of the crystalline domain length is estimated to be ±25 Å.
The crystalline domain length Lxy calculated from the {01} and {} signals (see the Supporting Material) are in a range of 650–750 Å with slightly decreasing values with increasing film pressure for all samples, similar to the scenario observed for the {10} signal. From these data and the modulus of the lattice vectors, the number of molecules in a crystalline domain can be estimated. In an ellipsoidal ordered domain with average crystalline domain lengths of 700 Å and 300 Å for the main axes, ∼1400 LPS molecules can be found.
The vertical crystalline domain length Lz for the LPS monolayer of ∼13 Å corresponds, as expected, to a fully stretched C12 hydrocarbon chain.
The LPS data can be compared with corresponding GIXD data on phospholipid systems, such as dipalmitoylphosphatidylcholine (DPPC) monolayers at the water-air interface at room temperature (37). At all film pressures, the area per hydrocarbon chain of the phospholipid is much larger than the areas found for the LPS in this study. For example, at ∼10 mN/m, the area per chain of DPPC is 150% larger than the one found for LPS, and decreases drastically with film pressure. Furthermore, the acyl chains in the DPPC monolayer exhibit a tilt angle relative to the surface normal, which decreases from 36° at 15 mN/m to 27° at 45 mN/m (37). For the LPS, no significant change of the area per chain is observed and the tilt angle determined is zero. This suggests that the lateral compressibility of the phospholipid DPPC is governed by the lipid headgroup area, which is larger than its chain cross-sectional area. This results in a marked tilt of the hydrocarbon chains and the changes of the chain cross-sectional area mainly originate from the compression of the headgroup region. Conversely, for LPS, the lateral structure and compressibility seems to be controlled by the six hydrocarbon chains.
Conclusions
One of the most intriguing issues in membrane biology and biophysics today is the lateral organization of membranes. Very little is known about the structure and lateral organization of membranes built from lipopolysaccharides and how their conformation is modulated by the ionic strength at the lipid interface. We combined synchrotron x-ray reflectivity (XRR) and grazing incidence x-ray diffraction (GIXD) to reveal the influence of mono- and divalent ions on the structure and lateral organization of lipopolysaccharide monolayers spread at the air-water interface. Specular x-ray reflectivity measurements are sensitive to the electron density distribution along the surface-normal and the in-plane packing properties, and correlation length-scales of the ordered (diffraction) properties of the monolayer film are provided by GIXD. Together, XRR and GIXD techniques provide a means to measure the structure of self-organizing molecularly thick films in bulk water with unprecedented resolution (38–40).
Based on our studies, new modes of lipopolysaccharide packing could be revealed upon changing the ionic valency and strength of the aqueous subphase. In general, our results indicate that Na+ ions interact unspecifically with LPS molecules based on their ability to screen the negative charges of the LPS molecules, whereas Ca2+ ions interact specifically by cross-linking adjacent molecules in the monolayer. At low lateral pressures, Na+ ions present in the subphase lead to a LPS monolayer structure ordered over large areas with high compressibility, nearly hexagonal packing of the hydrocarbon chains, and high density in the LPS headgroup region. At higher film pressures, the LPS monolayer becomes more rigid and results in a less perfect, oblique packing of the LPS hydrocarbon chains as well as a smaller lateral size of highly ordered domains on the monolayer. Furthermore, associated with the increased surface pressure, a conformational change of the headgroup occurs, leading to a thickening of the entire LPS monolayer structure. Generally, negligible or no molecular tilt of the hydrocarbon chains to the surface-normal has been detected in all phases.
The effect of Ca2+ ions in the subphase is to increase the rigidity of the LPS monolayer leading to an oblique packing of the hydrocarbon chains already at low lateral pressures. As a consequence, the lateral compressibility of the LPS monolayer is much lower compared to the LPS monolayer on a subphase containing Na+ ions. In the presence of Ca2+ ions, an increase of the film pressure has only a minor effect on the conformational properties of the LPS molecules. Intermolecular Ca2+/lipid phosphate and Ca2+/sugar carboxylate interactions lead to an upright orientation of the sugar molecules and cross-linking of the LPS molecules on the subphase containing the divalent Ca2+ ions, and, therefore, exhibit just minor conformational and orientational changes with increasing lateral pressure. The only distinct effect is a decrease of the lateral size of ordered domains in the monolayer caused by an increased packing stress at higher film pressures.
In the presence of both Na+- and Ca2+ ions in the subphase, the screening effect of Na+ is predominant at low film pressures. However, at higher film pressures, the structure and lateral organization of LPS molecules is governed by the influence of Ca2+ ions. That is, the unspecific charge screening effect of the Na+ ions on the conformation of the sugar moiety becomes less dominant at increased film pressures of magnitude relevant for biological membranes, probably by partial replacement of Na+ in the inner core region by Ca2+ and subsequent formation of Ca2+ ion bridges to negatively charged saccharide/headgroup moieties.
Acknowledgments
We thank HASYLAB for providing synchrotron radiation.
Financial support from the Deutsche Forschungsgemeinschaft (DFG grant No. 169/12-1 to F.E.) and the Federal Ministry of Education and Research, Germany (BMBF grant No. 01GU0824 to K.B.) is gratefully acknowledged.
Supporting Material
References
- 1.Raetz C.R.H. Biochemistry of endotoxins. Annu. Rev. Biochem. 1990;59:129–170. doi: 10.1146/annurev.bi.59.070190.001021. [DOI] [PubMed] [Google Scholar]
- 2.Rietschel E.T., Kirikae T., Di Padova F. Bacterial endotoxin: molecular relationships of structure to activity and function. FASEB J. 1994;8:217–225. doi: 10.1096/fasebj.8.2.8119492. [DOI] [PubMed] [Google Scholar]
- 3.Brandenburg K., Andrä J., Garidel P. Physicochemical properties of bacterial glycopolymers in relation to bioactivity. Carbohydr. Res. 2003;338:2477–2489. doi: 10.1016/j.carres.2003.08.008. [DOI] [PubMed] [Google Scholar]
- 4.Nikaido H., Nakae T. The outer membrane of Gram-negative bacteria. Adv. Microb. Physiol. 1979;20:163–250. doi: 10.1016/s0065-2911(08)60208-8. [DOI] [PubMed] [Google Scholar]
- 5.Snyder S., Kim D., McIntosh T.J. The lipopolysaccharide barrier: correlation of antibiotic susceptibility with antibiotic permeability and fluorescent probe binding kinetics. Biochemistry. 1999;38:10758–10767. doi: 10.1021/bi000810n. [DOI] [PubMed] [Google Scholar]
- 6.Stone R. Search for sepsis drugs goes on despite past failures. Science. 1994;264:365–367. doi: 10.1126/science.8153620. [DOI] [PubMed] [Google Scholar]
- 7.Seydel U., Ulmer A.J., Rietschel E.T. Lipopolysaccharide, a membrane-forming and inflammation-inducing bacterial macromolecule. In: Zimmer G., editor. Membrane Structure in Disease and Drug Therapy. Marcel Dekker; New York and Basel: 2000. pp. 217–252. [Google Scholar]
- 8.Nikaido H., Vaara M. Molecular basis of bacterial outer membrane permeability. Microbiol. Rev. 1985;49:1–32. doi: 10.1128/mr.49.1.1-32.1985. [DOI] [PMC free article] [PubMed] [Google Scholar]
- 9.Nikaido H. Prevention of drug access to bacterial targets: permeability barriers and active efflux. Science. 1994;264:382–388. doi: 10.1126/science.8153625. [DOI] [PubMed] [Google Scholar]
- 10.Donaldson D.M., Roberts R.R., Tew J.G. Interrelationship between serum β-lysin, lysozyme, and the antibody-complement system in killing Escherichia coli. Infect. Immun. 1974;10:657–666. doi: 10.1128/iai.10.3.657-666.1974. [DOI] [PMC free article] [PubMed] [Google Scholar]
- 11.Patterson-Delafield J., Martinez R.J., Lehrer R.I. Microbicidal cationic proteins in rabbit alveolar macrophages: a potential host defense mechanism. Infect. Immun. 1980;30:180–192. doi: 10.1128/iai.30.1.180-192.1980. [DOI] [PMC free article] [PubMed] [Google Scholar]
- 12.Hansen L.T., Austin J.W., Gill T.A. Antibacterial effect of protamine in combination with EDTA and refrigeration. Int. J. Food Microbiol. 2001;66:149–161. doi: 10.1016/s0168-1605(01)00428-7. [DOI] [PubMed] [Google Scholar]
- 13.Brandenburg K., Koch M.H.J., Seydel U.J. Phase diagram of lipid A from Salmonella minnesota and Escherichia coli rough mutant lipopolysaccharide. J. Struct. Biol. 1990;105:11–21. doi: 10.1016/1047-8477(90)90093-r. [DOI] [PubMed] [Google Scholar]
- 14.Kotra L.P., Golemi D., Mobashery S.J. Dynamics of the lipopolysaccharide assembly on the surface of Escherichia coli. J. Am. Chem. Soc. 1999;121:8707–8711. [Google Scholar]
- 15.Shroll R.M., Straatsma T.P. Molecular structure of the outer bacterial membrane of Pseudomonas aeruginosa via classical simulation. Biopolymers. 2002;65:395–407. doi: 10.1002/bip.10279. [DOI] [PubMed] [Google Scholar]
- 16.Roantree R.J., Kuo T.T., MacPhee D.G.J. The effect of defined lipopolysaccharide core defects upon antibiotic resistances of Salmonella typhimurium. J. Gen. Microbiol. 1977;103:223–234. doi: 10.1099/00221287-103-2-223. [DOI] [PubMed] [Google Scholar]
- 17.Brandenburg K., Seydel U. Physical aspects of structure and function of membranes made from lipopolysaccharides and free lipid A. Biochim. Biophys. Acta. 1984;775:225–238. [Google Scholar]
- 18.Hagge S.O., Hammer M.U., Gutsmann T. Calcium adsorption and displacement: characterization of lipid monolayers and their interaction with membrane-active peptides/proteins. BMC Biochem. 2006;7:15. doi: 10.1186/1471-2091-7-15. [DOI] [PMC free article] [PubMed] [Google Scholar]
- 19.Schneck E., Schubert T., Tanaka M. Quantitative determination of ion distributions in bacterial lipopolysaccharide membranes by grazing-incidence x-ray fluorescence. Proc. Natl. Acad. Sci. USA. 2010;107:9147–9151. doi: 10.1073/pnas.0913737107. [DOI] [PMC free article] [PubMed] [Google Scholar]
- 20.Hu K., Bard A.J. Use of atomic force microscopy for the study of surface acid-base properties of carboxylic acid-terminated self-assembled monolayers. Langmuir. 1997;13:5114–5119. [Google Scholar]
- 21.Evers F., Jeworrek C., Winter R. Elucidating the mechanism of lipid membrane-induced IAPP fibrillogenesis and its inhibition by the red wine compound resveratrol: a synchrotron x-ray reflectivity study. J. Am. Chem. Soc. 2009;131:9516–9521. doi: 10.1021/ja8097417. [DOI] [PubMed] [Google Scholar]
- 22.Frahm R., Weigelt J., Materlik G. X-ray undulator beamline BW1 at DORIS III. Rev. Sci. Instrum. 1995;66:1677–1680. [Google Scholar]
- 23.Jensen T.R., Kjaer K. Structural properties and interactions of thin films at the air-liquid interface explored by synchrotron x-ray scattering. In: Möbius D., Miller R., editors. Novel Methods to Study Interfacial Layers. Studies in Interface Science. Vol. 11. Elsevier Science; Amsterdam: 2001. pp. 205–254. [Google Scholar]
- 24.Tolan M. Springer Tracts in Modern Physics. Springer; Berlin: 1999. X-ray scattering from soft-matter thin films—materials science and basic research; p. 197. [Google Scholar]
- 25.Russell T.P. X-ray and neutron reflectivity for the investigation of polymers. Mater. Sci. Rep. 1990;5:171–271. [Google Scholar]
- 26.Daillant J., Gibaud A., editors. Lecture Notes in Physics. Springer; Berlin and Heidelberg: 2009. X-ray and neutron reflectivity: principles and applications; p. 770. [Google Scholar]
- 27.Als-Nielsen J., Jacquemain D., Leiserowitz L. Principles and applications of grazing incidence x-ray and neutron scattering from ordered molecular monolayer at the air-water interface. Phys. Rep. 1994;246:251–313. [Google Scholar]
- 28.Evers F., Shokuie K., Tolan M. Exploring the interfacial structure of protein adsorbates and the kinetics of protein adsorption: an in situ high-energy x-ray reflectivity study. Langmuir. 2008;24:10216–10221. doi: 10.1021/la801642s. [DOI] [PubMed] [Google Scholar]
- 29.Hüsecken A.K., Evers F., Tolan M. Effect of urea and glycerol on the adsorption of ribonuclease A at the air-water interface. Langmuir. 2010;26:13429–13435. doi: 10.1021/la102222z. [DOI] [PubMed] [Google Scholar]
- 30.Parratt L.G. Surface studies of solids by total reflection of x-rays. Phys. Rev. 1954;95:359–369. [Google Scholar]
- 31.Jacquemain D., Wolf S.G., Leiserowitz L. Two-dimensional crystallography of amphiphilic molecules at the air–water interface. Angew. Chem. Int. Ed. Engl. 1992;31:130–152. [Google Scholar]
- 32.Vineyard G.H. Grazing-incidence diffraction and the distorted-wave approximation for the study of surfaces. Phys. Rev. B. 1982;26:4146–4159. [Google Scholar]
- 33.Guinier A. W. H. Freeman; San Francisco, CA: 1963. X-Ray Diffraction in Crystals, Imperfect Crystals and Amorphous Bodies. [Google Scholar]
- 34.Neville F., Hodges C.S., Gidalevitz D. In situ characterization of lipid A interaction with antimicrobial peptides using surface x-ray scattering. Biochim. Biophys. Acta. 2006;1758:232–240. doi: 10.1016/j.bbamem.2006.01.025. [DOI] [PubMed] [Google Scholar]
- 35.Oliveira R.G., Schneck E., Tanaka M. Crucial roles of charged saccharide moieties in survival of Gram negative bacteria against protamine revealed by combination of grazing incidence x-ray structural characterizations and Monte Carlo simulations. Phys. Rev. E Stat. Nonlin. Soft Matter Phys. 2010;81:041901. doi: 10.1103/PhysRevE.81.041901. [DOI] [PubMed] [Google Scholar]
- 36.Brandenburg K., Wiese A. Endotoxins: relationships between structure, function, and activity. Curr. Top. Med. Chem. 2004;4:1127–1146. doi: 10.2174/1568026043388213. [DOI] [PubMed] [Google Scholar]
- 37.Leveiller F., Jacquemain D., Als-Nielsen J. Toward a determination at near atomic resolution of two-dimensional crystal structures of amphiphilic molecules on the water surface: a study based on grazing incidence synchrotron x-ray diffraction and lattice energy calculations. J. Phys. Chem. 1992;96:10380–10389. [Google Scholar]
- 38.Aroti A., Leontidis E., Brezesinski G. Effect of Hofmeister anions on DPPC Langmuir monolayers at the air-water interface. J. Phys. Chem. B. 2004;108:15238–15245. [Google Scholar]
- 39.Helm C.A., Tippmann-Krayer P., Kjaer K. Phases of phosphatidyl ethanolamine monolayers studied by synchrotron x-ray scattering. Biophys. J. 1991;60:1457–1476. doi: 10.1016/S0006-3495(91)82182-8. [DOI] [PMC free article] [PubMed] [Google Scholar]
- 40.Chi E.Y., Ege C., Lee K.Y. Lipid membrane templates the ordering and induces the fibrillogenesis of Alzheimer's disease amyloid-β peptide. Proteins. 2008;72:1–24. doi: 10.1002/prot.21887. [DOI] [PubMed] [Google Scholar]
Associated Data
This section collects any data citations, data availability statements, or supplementary materials included in this article.