Abstract
Amyloid-β peptide (Aβ) is the amyloid component of senile plaques in Alzheimer disease (AD) brains. Recently a soluble oliomeric form of Aβ in Aβ precursor protein transgenic mouse brains and AD brains was identified as a potential causative molecule for memory impairment, suggesting that soluble Aβ oligomers cause neurodegeneration in AD. Further characterization of this species has been hampered, however, because the concentrations are quite small and it is difficult to monitor Aβ oligomers specifically. Here we developed a novel method for monitoring Aβ oligomers using a split-luciferase complementation assay. In this assay, the N- and C-terminal fragments of Gaussia luciferase (Gluc) are fused separately to Aβ. We found that conditioned media from both N- and C-terminal fragments of Gluc-tagged Aβ1–42 doubly transfected HEK293 cells showed strong luminescence. We used gel filtration analyses to analyze the size of oligomers formed by the luciferase complementation assay, and found that it matched closely with oligomers formed by endogenous Aβ in Tg2576 neurons. Large oligomers (24–36-mers), 8-mers, trimers, and dimers predominate. In both systems, Aβ formed oligomers intracellularly, which then appear to be secreted as oligomers. We then evaluated several factors that might impact oligomer formation. The level of oligomerization of Aβ1–40 was similar to that of Aβ1–42. Homodimers formed more readily than heterodimers. The level of oligomerization of murine Aβ1–42 was similar to that of human Aβ1–42. As expected, the familial AD-linked Arctic mutation (E22G) significantly enhanced oligomer formation. These data suggest that Gluc-tagged Aβ enables the analysis of Aβ oligomers.
Keywords: Alzheimers Disease, Amyloid, Neurodegeneration, Neurons, Synapses, Luciferase, Oligomer
Introduction
Alzheimer disease (AD)2 is common progressive neurodegenerative disorder causing dementia. In AD patient's brains, loss of neocortical synapses correlates with cognitive impairment (1). Aβ is the amyloid component of senile plaques in AD brains (2, 3) and is derived from the Aβ precursor protein (APP) through sequential proteolytic cleavage by β-secretase and γ-secretase (4). Based on several genetic and biochemical studies, the amyloid hypothesis is now widely accepted as the pathogenesis of AD (4). It has recently been suggested that picomolar concentrations of dimeric, or oligomeric, rather than monomeric or fibrillar forms of Aβ, are the most neurotoxic, but characterization of these forms of soluble Aβ is technically difficult.
In previous in vitro Aβ fibrillization studies using synthetic Aβ, a variety of soluble prefibrillar species, including Aβ protofibrils (5, 6), Aβ-derived diffusible ligands (7), and amylospheroids (8) were reported as neuronal toxic molecules. Recently, soluble Aβ oligomers, Aβ*56 (9) and Aβ dimers (10) were isolated from APP transgenic mouse brain and AD brain and these Aβ oligomers caused synaptic dysfunction and memory impairment. Moreover Aβ oligomers were observed to associate with senile plaques and correlate with synaptic loss in AD brains (11). These data suggest that prefibrillar Aβ oligomers may be a causative species for synaptic loss and neuronal death in AD brains (12).
To understand how Aβ forms oligomers, it is important to monitor Aβ oligomers specifically and quantitatively. However isolation of Aβ oligomers from brains requires biochemical extraction and separation by size exclusion chromatography (SEC) (9, 10). It is thus difficult to monitor the low concentrations of Aβ oligomers that appear to have biological activity, and analyze their dynamics. In this study, we developed a novel method for monitoring Aβ oligomers using a split-luciferase complementation assay. Using this method, we found that Aβ oligomers can be built within cells and are then secreted. We also found that Aβ preferred to form homogenous oligomers and familial AD-linked E22G mutation enhances oligomer formation of Aβ. These results suggest that the assay may be useful to look for molecules that impact Aβ oligomerization.
EXPERIMENTAL PROCEDURES
cDNA Plasmids
Whole or split Gaussia luciferase (Gluc), 1–92 amino acids (luci), or 93–168 amino acids (ferase), was first inserted into the pSecTag2B vector (Invitrogen) between the KpnI site and BamHI site. For luci-Aβ, ferase-Aβ, or luciferase-Aβ, the fragment, including the start codon, immunoglobulin kappa secretory signal sequence, and whole or split Gluc, was digested by NheI and BamHI and inserted in-frame before the human Aβ1–42 coding sequence in pcDNA3.1 vector (Invitrogen). For Aβ-luci, Aβ-ferase, or Aβ-luciferase, we first mutated the stop codon of human Aβ1–42 in pcDNA3.1-Igk-Aβ1–42 plasmid into EcoRV site by in vitro site-directed mutagenesis using the following primers: 5′-GGTGTTGTCATAGCGGATATCTAATCTAGAGGGCCC-3′ (forward), 5′-GGGCCCTCTAGATTAGATATCCGCTATGACAACACC-3′ (reverse). After digestion by EcoRV, PCR fragment of whole or split Gluc, using the following primers: Gluc forward 5′-AAGCCCACCGAGAACAACGAAGAC-3′, Gluc reverse 5′-GTCACCACCGGCCCCCTTGATCTTG-3′, luci reverse 5′-GCCTATGCCGCCCTGTGCGGAC-3′, ferase forward 5′-GAGGCGATCGTCGACATTCCTGAG-3′, was ligated. For luci-Aβ40 or ferase-Aβ40, we mutated 41Ile of Aβ42 in luci-Aβ or ferase-Aβ cDNA plasmid into stop codon by in vitro site-directed mutagenesis using following primers: 5′-CGGTGTTGTCTAAGCTTAATCTAGAGGG-3′ (forward), 5′-CCCTCTAGATTAAGCTTAGACAACACCG-3′ (reverse). For Hu/Ms luci-Aβ or Hu/Ms ferase-Aβ, we mutated Tyr-10 and His-13 of human Aβ in luci-Aβ or ferase-Aβ cDNA plasmid into Phe and Arg, respectively, by in vitro site-directed mutagenesis using following primers: 5′-GACTCAGGATTCGAAGTTCGTCATCAAAAA-3′ (forward), 5′-TTTTTGATGACGAACTTCGAATCCTGAGTC-3′ (reverse). For murine luci-Aβ or ferase-Aβ, we mutated Arg5 in Hu/Ms luci-Aβ or ferase Aβ cDNA plasmid into Gly by in vitro site-directed mutagenesis using following primers: 5′-GATGCAGAATTTGGACAtGACTCAGG-3′ (forward), 5′-CCTGAGTCATGTCCAAATTCTGCATC-3′ (reverse). For luci-AβE22G, ferase-AβE22G, we mutated Glu-22 of Aβ in luci-Aβ or ferase-Aβ cDNA plasmid into Gly by in vitro site-directed mutagenesis using following primers: 5′-GGTGTTCTTTGCCGGCGATGTGGGTTC-3′ (forward), 5′-GAACCCACATCGCCGGCAAAGAACACC-3′ (reverse) (13). For luci or ferase, we inserted stop codon before Aβ sequence into luci-Aβ or ferase-Aβ by in vitro site-directed mutagenesis using following primers; 5′-TGGTGACGGATAGGATGCAGAATTCC-3′ (forward), 5′-GGAATTCTGCATGCTATCCGTCACCA-3′ (reverse), 5′-GGGTCCGGATAGGATGCAGAATTCC-3′ (forward), 5′-GGAATTCTGCATCCTATCCGGACCC-3′ (reverse).
Cell Culture and cDNA Transfection
HEK293 cells were cultured in Opti-MEM (Invitrogen) with 10% fetal bovine serum, 100 units/ml of penicillin, and 100 μg/ml of streptomycin at 37° in 5% CO2 atmosphere. Transient and stable cell lines were generated by transfecting cDNA plasmids using Lipofectamine2000 (Invitrogen) as suggested by the manufacturer and selection in Opti-MEM with 100 μg/ml of Zeocin (Invitrogen). For luciferase assays of the CM, we incubated HEK293 cells until 80% confluency, changed the media to Opti-MEM without fetal bovine serum, and further incubation for 3 days.
Luciferase Assay
Conditioned media (CM) from cells was collected and centrifuged at 1,200 rpm for 5 min to remove cell debris. Cells were lysed by cell lysis reagent (Promega). After adding 17 μg/ml of coelenterazine (NanoLight technology) diluted by Opti-MEM into samples, luciferase activity was immediately measured using a Wallac 1420 (PerkinElmer). Statistical analysis was performed by one-way analysis of variance (ANOVA) using Prism 5 for Mac OSX (GraphPad). Following ANOVA, the Bonferroni post hoc test was applied.
Immunoblotting and ELISA
Equal amounts of CM or cell lysates were electrophoresed on 10–20% Novex Tris-Glycine gels (Invitrogen) in Tris-Glycine SDS running buffer for SDS-PAGE (Invitrogen). Gels were transferred to PVDF membrane (PolyScreen, PerkinElmer), and blocked for 30 min at room temperature in 5% nonfat skim milk/TBST (Tris-buffer saline with 0.1% Tween20). Membranes were probed with 1 μg/ml of anti-Aβ monoclonal antibody 6E10 (Signet), or anti-Aβ42 specific monoclonal antibody 21F12 (Elan Pharmaceuticals, South San Francisco, CA) in TBST for 2 h at room temperature or for 12 h at 4 °C. Following incubation with horseradish peroxidase-conjugated secondary antibody (Bio-Rad) for 1 h at room temperature, immunoreactive proteins were developed using an ECL kit (Western Lightning, PerkinElmer) and detected on Hyperfilm ECL (GE Healthcare). For ELISA-based Aβ assays, sandwich ELISA BNT77/BA27 or BNT77/BC05 (Waco Chemicals, Richmond, VA) were used as suggested by the manufacturer.
Size Exclusion Chromatography
750 μl of CM were separated by size exclusion chromatography on a Superdex200 column (GE Healthcare) in 50 mm ammonium acetate pH 8.5 with an AKTA purifier 10 (GE Healthcare).
RESULTS
Detection of Aβ Oligomers Using the Split-luciferase Complementation Assay
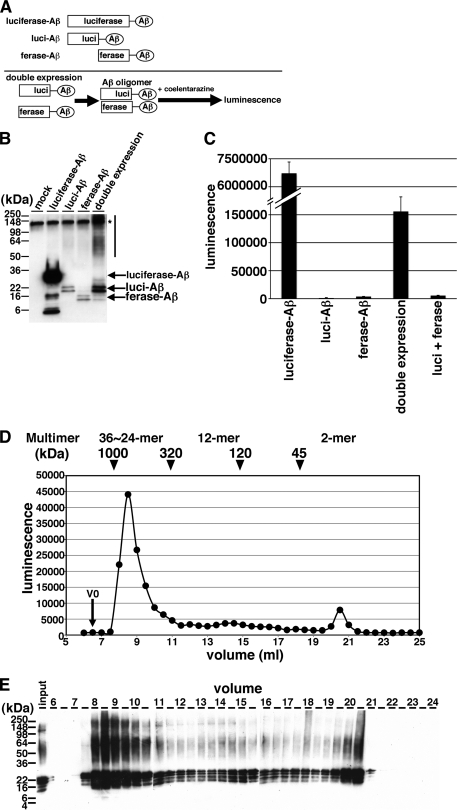
To monitor Aβ oligomers, we developed a novel method using a split-luciferase complementation assay. In this assay, the amino (N)- and carboxyl (C)-terminal fragments of Gluc, which emits luminescence 200-fold higher compared with firefly or Renilla luciferase (15), are fused separately to the N terminus of Aβ1–42. We constructed the N-terminal fragment of Gluc-tagged Aβ (luci-Aβ) or C-terminal fragment of Gluc-tagged Aβ (ferase-Aβ). To enable the secretion of the split Gluc-tagged Aβ from cells, we inserted a secretory signal sequence of Immunoglobulin kappa upstream of the sequence encoding the split Gluc tags. Luci-Aβ and ferase-Aβ do not support luminescence by themselves. We hypothesized that, if luci-Aβ and ferase-Aβ interact together as an Aβ dimer/oligomer, the N- and C-terminal fragments of Gluc would reconstitute a functional molecule and exhibit luminescence (Fig. 1A). This technique is also known as a bimolecular luminescence complementation assay (BiLC) (16). We transiently transfected mock plasmid, full-length Gluc-Aβ (luciferase-Aβ), luci-Aβ, ferase-Aβ, or both luci-Aβ and ferase-Aβ (luci-Aβ/ferase-Aβ) into HEK293 cells, incubated 48 h and collected the CM. Upon immunoblotting analysis of the CM of transfectants, luci-Aβ exhibited 20 and 22 kDa doublet bands, and ferase-Aβ exhibited 14 and 16 kDa doublet bands (Fig. 1B). In addition, greater than 50 kDa smear bands were observed in CM from luci-Aβ/ferase-Aβ transfected (double expression) HEK293 cells (Fig. 1B). We measured the luminescence and found that CM from double expression cells showed strong luminescence. On the other hand, the CM from luci-Aβ or ferase-Aβ separately expressing HEK293 cells did not show any luminescence (Fig. 1C). As a control, the CM from luciferase-Aβ overexpressing HEK293 exhibited 30 and 32 kDa doublet bands (Fig. 1B) and, as expected, showed substantially higher luminescence compared with double expression HEK293 cells (Fig. 1C). To rule out the possibility that overexpression of both N-terminal and C-terminal fragments of Gluc reconstitute the activity by themselves without Aβ sequence, we transfected both luci and ferase into HEK293 cells. However the CM form, both luci- and ferase-overexpressing HEK293 cells did not show strong luminescence (Fig. 1C). These data suggested that the split Gluc-tagged Aβ formed dimers/oligomers and reconstituted active luciferase in the CM.
FIGURE 1.
Detection of Aβ dimer/oligomers using split-luciferase complementation assay. A, scheme of split-luciferase complementation assay for detection of Aβ oligomers. We generated split Gluc-tagged Aβ. Once Aβ forms oligomer, split Gluc proteins are reconstituted and show luminescence. Transient transfection of luciferase-Aβ, luci-Aβ, ferase-Aβ, or double (luci-Aβ and ferase-Aβ) cDNA into HEK293 cells. B, immunoblotting of CM from transfected HEK293 cells by anti-human Aβ monoclonal antibody 6E10. Asterisk shows nonspecific band. C, luminescence from the CM from transfected HEK293 cells. The luminescence ± S.D. in three independent experiments are shown. D, separation of Gluc-tagged Aβ in the CM from stably double (luci-Aβ/ferase-Aβ)-expressing HEK293 cells by size exclusion chromatography. V0 shows void volume. Calculated molecular masses are shown above the panel (arrowheads). E, samples eluted from 6–24 ml were analyzed by immunoblotting with anti-Aβ mAb 6E10.
To examine the size distribution of oligomers formed by Gluc-tagged Aβ, we subjected CM from HEK293 cells stably expressing luci-Aβ/ferase-Aβ to SEC. We applied CM onto Superdex200 SEC column, collected fractions, and measured the luminescence of each fraction. We found that the greater than 300 kDa fractions strongly exhibited luminescence and that less than 40 kDa fractions also weakly exhibited luminescence, suggesting that the majority of the split Gluc-tagged Aβ formed oligomers (estimated as 36∼24-mer, assuming that the complex is made of luci-Aβ and ferase-Aβ and does not reflect luciferase activity associated with complexes of amyloid oligomers with amyloid-binding proteins) and the minority of split Gluc-tagged Aβ formed dimers (Fig. 1D). Immunoblot analysis also detected both luci-Aβ and ferase-Aβ most prominently in the 8–10 ml fractions (Fig. 1E). Interestingly, denaturing Western blot preparations revealed stable dimers/trimers even in the high molecular weight fraction.
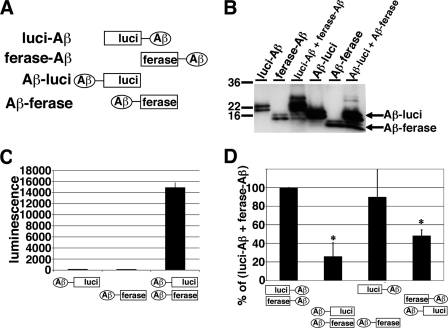
Next, we examined the correlation between the direction of split luciferase tags and luciferase activity. We fused the N-terminal fragment of Gluc (Aβ-luci) or the C-terminal fragment of Gluc (Aβ-ferase) to the C terminus of Aβ1–42 (Fig. 2A). We transiently transfected Aβ-luci, Aβ-ferase, or Aβ-luci/Aβ-ferase into HEK293 cells. On immunoblotting analysis of the CM, Aβ-luci was detected as 16 and 18 kDa doublet band proteins, and Aβ-ferase was detected as 10 and 12 kDa doublet band proteins (Fig. 2B). We found that the CM from Aβ-luci/Aβ-ferase expressing HEK293 cells showed luminescence and that the CM from Aβ-luci or Aβ-ferase separately expressing HEK293 cells did not show any luminescence (Fig. 2C). To compare luciferase activities between the direction of split-luciferase tag, we transfected luci-Aβ/ferase-Aβ (N-N), Aβ-luci/Aβ-ferase (C-C), luci-Aβ/Aβ-ferase (N-C), and Aβ-luci/ferase-Aβ (C-N) into HEK293 cells. All N-N, C-C, N-C, and C-N conformations supported luminescence, although the luci-Aβ/ferase-Aβ (N-N) and luci-Aβ/Aβ-ferase (N-C) appeared to produce a somewhat stronger signal. The luci-Aβ/ferase-Aβ double pair was used for further studies.
FIGURE 2.
Examination on the direction of split Gluc tag. A, scheme for N-terminal and C-terminal split Gluc-tagged Aβ. We generated luci-Aβ, ferase-Aβ, Aβ-luci, Aβ-ferase, and double (luci-Aβ/ferase-Aβ, Aβ-luci/Aβ-ferase, luci-Aβ/Aβ-ferase, and Aβ-luci/ferase-Aβ) stably expressing HEK293 cells. B, immuoblotting of the CM from stably transfected HEK293 cells by anti-human Aβ monoclonal antibody 6E10. C, luciferase assay of the CM from Aβ-luci, Aβ-ferase, and double (Aβ-luci/Aβ-ferase) stably expressing HEK293 cells. The luminescence ± S.D. in three independent experiments are shown. D, comparison of luciferase activity of the CM from double (luci-Aβ/ferase-Aβ, Aβ-luci/Aβ-ferase, luci-Aβ/Aβ-ferase, and Aβ-luci/ferase-Aβ) stably expressing HEK293 cells. The luminescence was standardized by the expression levels of split Gluc-tagged Aβ and shown as the ratio relative to the level of luminescence of the CM from double (luci-Aβ/ferase-Aβ) expressing HEK293 cells as 100%. The luminescence ± S.D. in three independent experiments are shown. ANOVA test p < 0.01 (*).
Split Gluc-tagged Aβ Oligomers Are Built Intracellularly
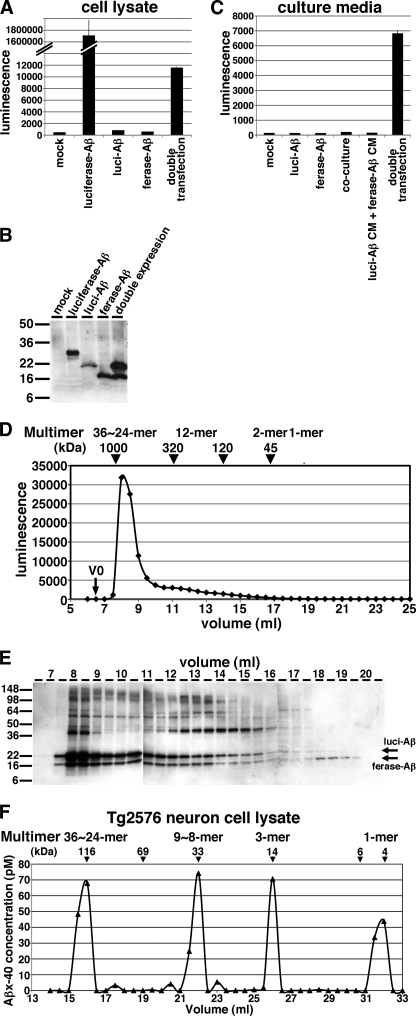
To understand where split Gluc-tagged Aβ forms oligomers, we measured luminescence within the cells overexpressing luci-Aβ/ferase-Aβ. We found the cell lysate from doubly expressing HEK293 cells also showed luminescence (Fig. 3A). On the other hand, cell lysate from luci-Aβ or ferase-Aβ separately expressing HEK293 cells did not show any luminescence. On immunoblot analysis of cell lysates, luci-Aβ was detected as a 22 kDa protein and ferase-Aβ expressed as a 16 kDa protein (Fig. 3B). To examine the possibility that Aβ oligomer formation occurs extracellularly, we co-cultured luci-Aβ stably expressing HEK293 cells and ferase-Aβ stably expressing HEK293 cell. However we did not detect luminescence from the CM of co-cultured cells (Fig. 3C, co-culture). We also made a mixture between the CM from luci-Aβ stably expressing HEK293 cells and ferase-Aβ stably expressing HEK293 cell. However we also did not detect luminescence from the mixture of CM (Fig. 3C, luci-Aβ CM + ferase-Aβ CM). These results suggested Gluc-tagged Aβ oligomers are built within the cells and secreted. Once secreted, we suggest that they are relatively stable, and therefore secreted non-luminant luci-Aβ oligomers mixed with secreted ferase-Aβ oligomers do not readily exchange to form luminescent pairs.
FIGURE 3.
Detection of split Gluc-tagged Aβ oligomers within the cells. A, luciferase assay of the cell lysates of mock, luciferase-Aβ, luci-Aβ, ferase-Aβ, and double (luci-Aβ/ferase-Aβ) stably expressing HEK293 cells. The luminescence ± S.D. in three independent experiments are shown. B, immunoblotting of the cell lysates of mock, luciferase-Aβ, luci-Aβ, ferase-Aβ, and double (luci-Aβ/ferase-Aβ) stably expressing HEK293 cells by anti-Aβ mAb 6E10. C, luciferase assay of the CM from mock, luci-Aβ, ferase-Aβ, double (luci-Aβ/ferase-Aβ) stably HEK293 cells, and co-culture between luci-Aβ stably expressing cells and ferase-Aβ stably expressing cells. Also, luciferase assay of the mixture of the CM from luci-Aβ stably expressing cells and the CM from ferase-Aβ stably expressing cells. The luminescence ± S.D. in three independent experiments are shown. D, separation of Gluc-tagged Aβ in the cell lysate from stably double (luci-Aβ/ferase-Aβ) expressing HEK293 cells by size exclusion chromatography. V0 shows void volume. Calculated molecular masses are shown above the panel (arrowheads). E, samples eluted from 6.5 to 20.5 ml were analyzed by immunoblotting with anti-Aβ mAb 6E10. F, separation of Aβ in the cell lysate of primary culture neurons from Tg2576 mice by size exclusion chromatography. Calculated molecular masses are shown above the panel (arrowheads).
To examine whether Aβ oligomer formation occurs intracellulary, we subjected cell lysate from HEK293 cells stably expressing luci-Aβ/ferase-Aβ to SEC. We applied cell lysate on to a Superdex200 SEC column, collected fractions and measured the luminescence of each fraction. We found that, similar to CM (Fig. 1D), the greater than 300 kDa fractions strongly exhibited luciferase activity, suggesting that the split Gluc-tagged Aβ formed oligomers (estimated as 36∼24-mer) intracellulary and is then secreted from cells (Fig. 3D). Immunoblot analysis also detected both luci-Aβ and ferase-Aβ most prominently in the 8–9 ml fractions (Fig. 3E).
We previously published that Aβ oligomers are rich in the CM from 14-day-cultured primary culture neurons of Tg2576 APP transgenic mouse (19). To determine whether native Aβ also forms oligomers intracellulary, we applied cell lysate of primary culture neurons of Tg2576 mouse to SEC, collected fractions and measured the Aβ concentration using a human Aβ specific ELISA. We found Aβ eluted as 36∼24-mer, 9∼8-mer, 3-mer, or 1-mer size (Fig. 3F), suggesting that native Aβ also forms oligomers intraneuronally. With regard to the largest fraction, we cannot exclude the possibility that Gluc-tagged Aβ or native Aβ interacts with unidentified factors and is thus eluted into larger molecular size fractions. A difference is apparent between Fig. 3D and Fig. 3F in the exact distributions; we postulate that in the HEK293 cells, the concentration of Gluc-tagged Aβ is very high, and they may form HMW oligomers very rapidly. On the other hand, in the Tg2576 neurons, the concentration of Aβ is low, and they may form oligomers more slowly and also show some intermediate size oligomers.
Split Gluc-tagged Aβ Prefers Homo-oligomerization
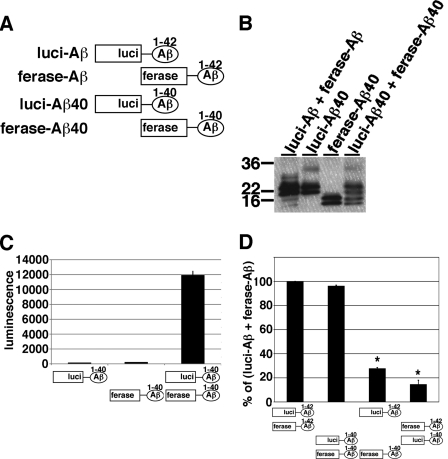
Aβ40 and Aβ42 are the predominant Aβ species and Aβ42 is known to be crucial to Aβ fibrillization in vitro (17) and to Aβ deposition in AD brains (18). To compare the levels of oligomer formation between Aβ40 and Aβ42, we generated the N-terminal fragment of Gluc-tagged Aβ40 (luci-Aβ40, Fig. 4A), the C-terminal fragment of Gluc-tagged Aβ40 (ferase-Aβ40, Fig. 4A) or both luci-Aβ40 and ferase-Aβ40 stably expressing HEK293 cells. Similar to luci-Aβ and ferase-Aβ, luci-Aβ40 exhibited 20 and 22 kDa doublet bands, and ferase-Aβ40 exhibited 14 and 16 kDa doublet bands in the CM (Fig. 4B). The CM from luci-Aβ40/ferase-Aβ40 stably expressing HEK293 cells showed strong luminescence. On the other hand, as expected, the CM from luci-Aβ40 or ferase-Aβ40 separately expressing HEK293 cells did not show any luminescence (Fig. 4C). We next compared the luminescence of reconstituted Gluc from homogeneous or heterogeneous oligomers of Aβ40 and Aβ42. We collected the CM from luci-Aβ42/ferase-Aβ42, luci-Aβ40/ferase-Aβ40, luci-Aβ42/ferase-Aβ40, or luci-Aβ40/ferase-Aβ42 stably expressing HEK293 cells, measured the luminescence, standardized by the expression levels of Aβ (Fig. 4D). Compared with Aβ42 homo-oligomer, Aβ40 homo-oligomer showed 96.2% luminescence. On the other hand, Aβ40 and Aβ42 hetero-oligomer showed 27.7% (luci-Aβ42/ferase-Aβ40) or 14.5% (luci-Aβ40/ferase-Aβ42) luminescence. These data suggested that Aβ40 and Aβ42 bimolecular complementation fragments have a tendency to form homogeneous oligomers rather than heterogeneous oligomers. We did not observe any significant difference between Aβ40 homo-oligomers and Aβ42 homo-oligomers.
FIGURE 4.
Oligomer formation of split Gluc-tagged Aβ1–40. A, scheme for split Gluc-tagged Aβ1–42 and Aβ1–40. We generated luci-Aβ1–40 and ferase-Aβ1–40 stably expressing HEK293 cells. B, immunoblotting of the CM from luci-Aβ1–40, ferase-Aβ1–40, and double (luci-Aβ1–40/ferase-Aβ1–40) and double (luci-Aβ/ferase-Aβ) stably expressing HEK293 cells by anti-Aβ mAb 6E10. C, luciferase assay of the CM from luci-Aβ1–40, ferase-Aβ1–40, and double (luci-Aβ1–40/ferase-Aβ1–40) stably expressing HEK293 cells. The luminescence ± S.D. in three independent experiments are shown. D, comparison of luciferase activity of the CM from double (luci-Aβ/ferase-Aβ, luci-Aβ1–40/ferase-Aβ1–40, luci-Aβ/ferase-Aβ1–40 and luci-Aβ1–40/ferase-Aβ) stably expressing HEK293 cells. The luminescence was standardized by the expression levels of split Gluc-tagged Aβ and shown as the ratio relative to the level of luminescence of the CM from double (luci-Aβ/ferase-Aβ) stably expressing HEK293 cells as 100%. The luminescence ± S.D. in three independent experiments are shown. ANOVA test p < 0.01 (*).
Murine Aβ Forms Oligomers Similar to Human Aβ
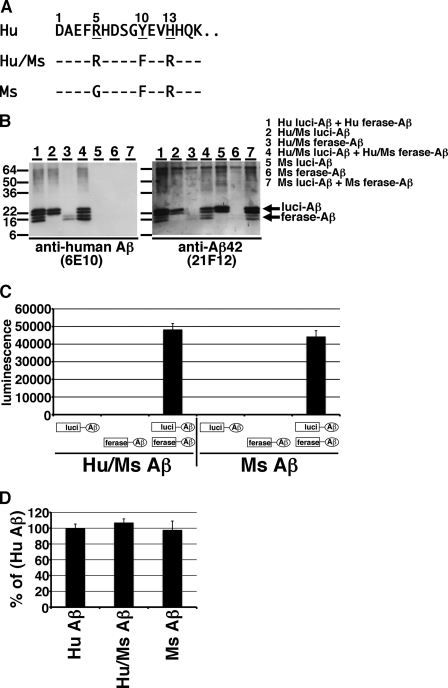
Between human Aβ and murine Aβ, there are 3-amino acid differences (R5G, Y10F, and H13R, Fig. 5A). We recently found that human Aβ secreted from 14-day-cultured primary neurons of Tg2576 mice formed 10–30 kDa oligomers and murine Aβ secreted from 14-day-cultured primary culture neurons of wild-type mouse also formed the same sized oligomers (19). However the levels of murine Aβ oligomers in the CM of wild-type mouse neurons were substantially lower than those of human Aβ in the CM of Tg2576 mouse neurons. To determine whether murine Aβ forms oligomers like human Aβ, we constructed split Gluc-tagged murine Aβ1–42 (R5G, Y10F, and H13R, Fig. 5A). We also constructed a human/murine hybrid (Hu/Ms) Aβ1–42 with split Gluc tag (Y10F and H13R, Fig. 5A). We transiently transfected these plasmids into HEK293 cells and collected their CMs. Because the epitopes of anti-human Aβ mAb 6E10 are residues 3–8 of human Aβ, murine Aβ is negative for 6E10 whereas Hu/Ms Aβ is positive for mAb 6E10. On the other hand, mAb 21F12 is Aβ42 C-terminal end specific antibody and recognizes human, murine, and Hu/Ms Aβ42. Similar to split Gluc-tagged human Aβ, we found that murine luci-Aβ and Hu/Ms luci-Aβ exhibited 20 and 22 doublet bands and that murine ferase-Aβ and Hu/Ms ferase-Aβ exhibited 14 and 16 doublet bands in the CM (Fig. 5B, right panel). As expected, mAb 21F12 revealed split Gluc-tagged human, murine and Hu/Ms Aβ and mAb 6E10 revealed split Gluc-tagged human and Hu/Ms Aβ (Fig. 5B). The CM from both Hu/Ms luci-Aβ and Hu/Ms ferase-Aβ, or from both murine luci-Aβ and murine ferase-Aβ stably expressing HEK293 cells showed strong luminescence. On the other hand, as expected, the CM from Hu/Ms luci-Aβ, Hu/Ms ferase-Aβ, murine luci-Aβ, or murine ferase-Aβ separately expressing HEK293 cells did not show any luminescence (Fig. 5C). We next compared the luminescence of reconstituted Gluc from human, murine, and Hu/Ms Aβ oligomers. We collected the CM from both human luci-Aβ and ferase-Aβ, from both murine luci-Aβ and murine ferase-Aβ, or from both Hu/Ms luci-Aβ and Hu/Ms ferase-Aβ transiently expressing HEK293 cells, and measured the luminescence, standardized by the expression levels of Aβ (Fig. 5D). Compared with human Aβ, murine Aβ showed 97.9% luminescence and Hu/Ms Aβ showed 107.2% luminescence. Among them, there were no significant differences, suggesting that murine Aβ forms oligomers similar to human Aβ.
FIGURE 5.
Oligomer formation of split Gluc-tagged murine Aβ. A, amino acid sequences for split Gluc-tagged human Aβ, human/murine (Hu/Ms) hybrid Aβ, and murine Aβ. We generated Hu/Ms luci-Aβ, Hu/Ms ferase-Aβ, Ms luci-Aβ, Ms ferase-Aβ transiently expressing HEK293 cells. B, immunoblotting of the CM from indicated protein transiently expressing HEK293 cells by anti-Aβ mAb 6E10 (left panel) and by anti-Aβ42 specific mAb 21F12 (right panel). C, luciferase assay of the CM from Hu/Ms luci-Aβ, Hu/Ms ferase-Aβ, double (Hu/Ms luci-Aβ + Hu/Ms ferase-Aβ), Ms luci-Aβ, Ms ferase-Aβ, and double (Ms luci-Aβ + Ms ferase-Aβ) transiently expressing HEK293 cells. The luminescence ± S.D. in three independent experiments are shown. D, comparison of luciferase activity of the CM from double (Hu luci-Aβ + Hu ferase-Aβ, Hu/Ms luci-Aβ + Hu/Ms ferase-Aβ, and Ms luci-Aβ + Ms ferase-Aβ) transiently expressing HEK293 cells. The luminescence was standardized by the expression levels of split Gluc-tagged Aβ and shown as the ratio relative to the level of luminescence of the CM from double (Hu luci-Aβ + Hu ferase-Aβ) transiently expressing HEK293 cells as 100%. The luminescence ± S.D. in four independent experiments are shown.
Familial AD-linked Arctic Mutation Enhanced Split Gluc-tagged Aβ Oligomer Formation
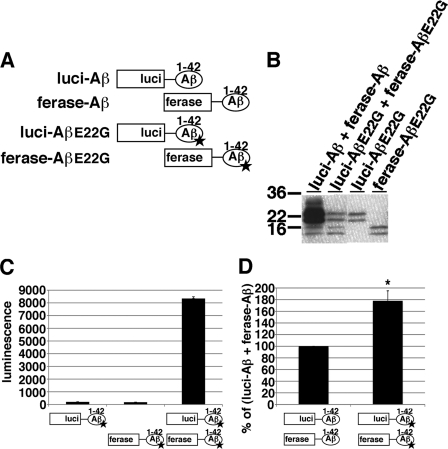
The E22G Arctic mutation is one of the familial AD-linked mutations within the Aβ region in the APP gene and it has been reported to enhance protofibril formation (20). To determine whether the E22G mutation affects Aβ oligomerization, we constructed E22G mutant split Gluc-tagged Aβ1–42 plasmids (Fig. 6A, luci-AβE22G and ferase-AβE22G) with which we generated luci-AβE22G, ferase-AβE22G, and both luci-AβE22G and ferase-AβE22G transiently expressing HEK293 cells. Luci-AβE22G exhibited 20 and 22 kDa doublet bands, and ferase-AβE22G exhibited 14 and 16 kDa doublet bands in CM (Fig. 6B). The CM from luci-AβE22G/ferase-AβE22G doubly expressing HEK293 cells showed strong luminescence. On the other hand, as expected, the CM from luci-AβE22G or ferase-AβE22G separately expressing HEK293 cells did not show any luminescence (Fig. 6C). We next compared luminescence of the CM from luci-Aβ/ferase-Aβ expressing cells with the CM from luci-AβE22G/ferase-AβE22G expressing cells after standardization by the expression levels of Aβ. We found that E22G mutant Gluc-tagged Aβ oligomers exhibited 178.0% higher luminescence compared with wild-type Gluc-tagged Aβ oligomers, suggesting that E22G may enhance not only protofibril formation but also oligomer formation (Fig. 6D).
FIGURE 6.
Oligomer formation of split Gluc-tagged Arctic E22G Aβ. A, scheme for split Gluc-tagged AβE22G. We generated luci-AβE22G and ferase-AβE22G transiently expressing HEK293 cells. B, immunoblotting of the CM from luci-AβE22G, ferase-AβE22G, and double (luci-AβE22G/ferase-AβE22G) and double (luci-Aβ/ferase-Aβ) transiently expressing HEK293 cells by anti-Aβ mAb 6E10. C, luciferase assay of the CM from luci-AβE22G, ferase-AβE22G, and double (luci-AβE22G/ferase-AβE22G) transiently expressing HEK293 cells. The luminescence ± S.D. in three independent experiments are shown. D, comparison of luciferase activity of the CM from double (luci-Aβ/ferase-Aβ and luci-AβE22G/ferase-AβE22G) transiently expressing HEK293 cells. The luminescence was standardized by the expression levels of split Gluc-tagged Aβ and shown as the ratio relative to the level of luminescence of the CM from double (luci-Aβ/ferase-Aβ) stably expressing HEK293 cells as 100%. The luminescence ± S.D. in three independent experiments are shown. ANOVA test p < 0.05 (*).
Split Gluc-tagged Aβ Reduced Oligomer Formation by Incubation with Synthetic Aβ
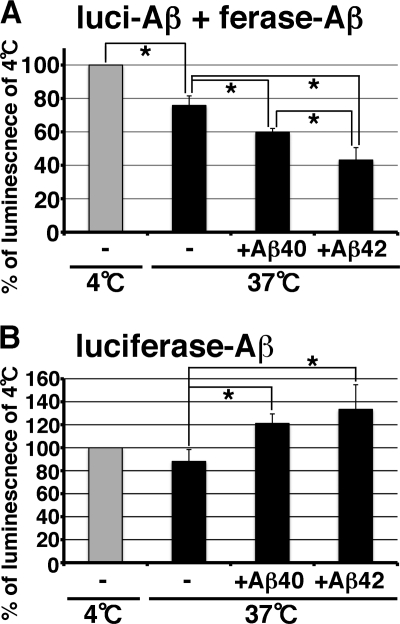
Aβ oligomer is one of the intermediate species in the process of amyloid fibril formation. We next examined the relationship between oligomer formation and fibril formation. To enhance fibril formation, we incubated split Gluc-tagged Aβ oligomers with 50 μg/ml of fresh synthetic Aβ1–40 or Aβ1–42 at 37 °C for 24 h. Synthetic Aβ1–42 fibrilizes faster than synthetic Aβ1–40 (17). We found that split Gluc-tagged Aβ oligomer luminescence was significantly reduced to about 24.2% by incubation with synthetic Aβ (Fig. 7A). Synthetic Aβ1–40 and Aβ1–42 significantly decreased the luminescence of split Gluc-tagged Aβ oligomers about 40.2 and 56.8%, respectively (Fig. 7A). We saw amyloid fibrils in the split Gluc-tagged Aβ oligomers that had been incubated with synthetic Aβ, but we did not see any amyloid fibrils in the equivalent preparation of split Gluc-tagged Aβ oligomers alone by electron microscopy (data not shown), arguing that one effect of the synthetic Aβ might be to enhance fibrillization and precipitate split luciferase Aβ. On the other hand, we found that whole Gluc-tagged Aβ oligomers did not show any significant reduction of the luminescence after incubation with synthetic Aβ and that, in fact, synthetic Aβ1–40 and Aβ1–42 significantly increased luminescence of whole Gluc-tagged Aβ (Fig. 7B). Although it is not clear why synthetic Aβ1–40 or Aβ1–42 increases the luminescence of whole Gluc-tagged Aβ, this result shows that Aβ fibrils do not quench the luminescence of Gluc. We therefore favor the interpretation that the addition of excess “cold” Aβ competes for dimeric split luciferase molecules, leading to a decrease in the likelihood that split luciferase dimers form functionally active pairs, consistent with the possibility that incubation with synthetic Aβ reduces the specific oligomer conformation needed to support luminescence in the BiLC format when incorporated with Aβ fibrils.
FIGURE 7.
Reduction of oligomer structure by incubation with synthetic Aβ. A, luciferase assay of the CM from double (luci-Aβ/ferase-Aβ) stably expressing HEK293 cells incubated with or without 0. 05 mg/ml of synthetic Aβ1–40 or Aβ1–42 at 37 °C for 24 h. The luminescence ± S.D. in three independent experiments are shown as the ratio relative to the level of luminescence of the CM from double (luci-Aβ/ferase-Aβ) stably expressing HEK293 cells incubated at 4 °C for 24 h as 100%. ANOVA test p < 0.05 (*). B, luciferase assay of the CM from luciferase-Aβ stably expressing HEK293 cells incubated with or without 0.05 mg/ml of synthetic Aβ1–40 or Aβ1–42 at 37 °C for 24 h. The luminescence ± S.D. in three independent experiments are shown as the ratio relative to the level of luminescence of the CM from luciferase-Aβ stably expressing HEK293 cells incubated at 4 °C for 24 h as 100%. ANOVA test p < 0.05 (*).
DISCUSSION
In this study we generated a novel method for monitoring Aβ oligomers using a bimolecular luminescence complementation assay. Gluc-tagged Aβ oligomers, secreted from both luci-Aβ and ferase-Aβ stably expressing HEK293 cells, formed high-molecular-weight Aβ oligomers. Although Gluc-tagged Aβ is an artificial protein, it appears that it forms oligomers similar to natural Aβ oligomers. We demonstrate that the bimolecular complementation assay oligomers are biochemically similar to native Aβ oligomers produced by Tg2576 neurons in terms of their behavior on SEC columns. They also behave as anticipated based on previous literature using native Aβ in a variety of experimental assays, with expected changes in complementation efficiency produced by manipulating hetero versus homodimer formation, the effects of the E22G mutation, and the detection of both intracellular and secreted forms of oligomeric Aβ. Specifically, using the new Gluc-tagged Aβ oligomer assay, we found that 1) Aβ formed oligomers within the HEK293 cells which were secreted, 2) split Gluc-tagged Aβ tended to form Aβ40 or Aβ42 homogeneous oligomers, compared with Aβ40 and Aβ42 heterogeneous oligomers, 3) murine Aβ formed oligomers similar to human Aβ, 4) the E22G Arctic mutation enhanced oligomer formation of split Gluc-tagged Aβ. Importantly, the high sensitivity of the assay allowed us to readily detect and characterize the presence of oligomers within the intracellular compartment, strongly supporting the idea that oligomers can form intracellularly, and provide an ultrasensitive tool for their further study.
To monitor Aβ oligomers specifically, several methods, including SEC (10, 21), Aβ oligomer specific antibodies (22, 23, 24), chemical crosslinking method (25), mass spectrometry (26), or single-antibody sandwich enzyme-linked immunosorbent assay (27, 28), have been reported. Compared with these methods, BiLC method using Gluc-tagged Aβ is a highly-sensitivity, quantitative, and simple method for monitoring Aβ oligomers. The assay has the further advantage that it does not require concentration of the sample or other manipulations that may impact dimer/oligomer formation, and it is ideal for high-throughput type assays.
It is possible that the addition of tags (even the relatively small tags involved in the Gaussia luciferase system) could impact Aβ characteristics. We therefore examined a variety of systems in which the biological characterization of oligomer or protofibril formation has been previously evaluated, and find quite analogous results with the bimolecular complementation assay. We found that Gluc-tagged Aβ formed oligomers within cells. Although it is likely that the secretion characteristics of the Gluc-tagged Aβ differ from native Aβ, the observation that Aβ can form oligomers intracellularly is in accord with several studies reporting detection of intraneuronal Aβ (29, 30). In FAD mutant APP overexpressing Chinese hamster ovary cells (clone 7PA2), SDS-stable Aβ oligomers were detected intracellularly (31). Moreover, in APP transgenic mouse brains, Aβ oligomer specific antibody detected intraneuronal Aβ oligomers (23). In this study, we also found that Aβ may formed oligomers in Tg2576 APP transgenic mouse neurons (Fig. 3F).
We found that split Gluc-tagged Aβ tended to form Aβ40 or Aβ42 homogeneous oligomers, compared with Aβ40 and Aβ42 heterogeneous oligomers (Fig. 4). Shankar et al. (10) found similar results, with the majority of dimers appearing to be homodimers, when they examined Aβ dimers isolated from AD brains using Aβ40 or Aβ42 C-terminal end specific antibodies. Although the level of fibrillization of Aβ42 is much higher than Aβ40 (17), Aβ40 is also known to form dimers, trimers, and tetramers (25), or amylospheroid (8) in vitro. Why does Aβ prefer to form homo-oligomers rather than hetero-oligomers? We cannot rule out the possibility that this result is secondary to the structure of the split Gluc constructs, but Shanker et al. (10) report, using endogenous Aβ, that heterodimers are rare. Recently Aβ oligomers made by a mixture of synthetic Aβ40 and Aβ42 (ratio 7:3) was found to be more stable and neurotoxic compared with Aβ40 or Aβ42 solo oligomer (32). Aβ40 and Aβ42 is also reported to coassemble into amyloid fibrils (33, 34), suggesting that Aβ40 or Aβ42 homo oligomer may be mixed and may form further aggregated structures.
We also found that murine Aβ formed oligomers similar to human Aβ (Fig. 5). We detected 10–30 kDa murine Aβ oligomers in the CM from 14-day-cultured primary culture neurons of wild-type mice (19). Recently endogenous murine Aβ was reported to have a crucial role in synaptic activity (35), and endogenous murine Aβ oligomers suggested a role regulating synaptic activity. Moreover, by the prolonged inhibition of Aβ-degrading enzyme neprilysin in the brain of wild-type mice, it has been reported that murine Aβ is deposited in the brain (36), suggesting that murine Aβ may undergo a process of oligomerization and fibrillization similar to human Aβ.
The familial AD-linked E22G Arctic mutation has been reported to enhance protofibril formation (20) and oligomer formation (37) in vitro, and amyloid deposition in vivo (38). In this study, using split Gluc-tagged Aβ oligomers, we confirmed that E22G mutation enhanced the oligomer formation in the CM of HEK293 cells. Because Aβ N-terminal portion mutations (R5G, Y10F, and H13R in murine Aβ) did not affect Aβ oligomer formation, we suggest that the mid portion of Aβ including the Glu-22 residue may be important for Aβ oligomerization.
In summary, we developed a novel technique for specifically monitoring and quantifying Aβ oligomers. The split luciferase complementation assay may be useful for the general question of oligomeric protein behavior, and we have recently demonstrated that α-synuclein oligomers can be similarly studied using this technique (39). Aβ oligomerization is a key process in AD pathogenesis, and monitoring Aβ oligomers is necessary not only for elucidation of the molecular mechanism of AD pathogenesis but also for development and assessment of disease modifying therapies for AD. Using this technique we will further elucidate Aβ oligomer functions and its kinetics.
Acknowledgments
We thank Dr. Stephaen Michnick at the Université de Montréal for split Gaussia luciferase constructions and Dr. Bakhos A. Tannous at Massachusetts General Hospital for the full-length Gaussia luciferase construction. We also thank Dr. Tara L Spires-Jones, Dr. Karin Danzer, Daniel Joyner, and Amy Deng for valuable discussions.
This work was supported, in whole or in part, by National Institutes of Health Grant AG12406 (to B. T. H.), the JSPS Postdoctoral Fellow for Research Abroad (to T. H.), and the Ellison Medical Foundation/AFAR 2009A059868 (to T. H.).
- AD
- Alzheimer disease
- Aβ
- Amyloid-β peptide
- Gluc
- Gaussia luciferase
- APP
- Aβ precursor protein
- SEC
- size exclusion chromatography
- CM
- conditioned media
- BiLC
- bimolecular luminescence complementation assay.
REFERENCES
- 1. Terry R. D., Masliah E., Salmon D., P., Butters N., DeTeresa R., Hill R., Hansen L. A., Katzman R. (1991) Ann. Neurol. 30, 572–580 [DOI] [PubMed] [Google Scholar]
- 2. Glenner G. G., Wong C. W. (1984) Biochem. Biophys. Res. Commun. 120, 885–890 [DOI] [PubMed] [Google Scholar]
- 3. Masters C. L., Simms G., Weinman N. A., Multhaup G., McDonald B. L., Beyreuther K. (1985) Proc. Natl. Acad. Sci. U.S.A. 82, 4245–4249 [DOI] [PMC free article] [PubMed] [Google Scholar]
- 4. Selkoe D. J. (2001) Physiol. Rev. 81, 741–766 [DOI] [PubMed] [Google Scholar]
- 5. Walsh D. M., Lomakin A., Benedek G. B., Condron M. M., Teplow D. B. (1997) J. Biol. Chem. 272, 22364–22372 [DOI] [PubMed] [Google Scholar]
- 6. Harper J. D., Wong S. S., Lieber C. M., Lansbury P. T., Jr. (1997) Chem. Biol. 4, 119–125 [DOI] [PubMed] [Google Scholar]
- 7. Lambert M. P., Barlow A. K., Chromy B. A., Edwards C., Freed R., Liosatos M., Morgan T. E., Rozovsky I., Trommer B., Viola K. L., Wals P., Zhang C., Finch C. E., Krafft G. A., Klein W. L. (1998) Proc. Natl. Acad. Sci. U.S.A. 95, 6448–6453 [DOI] [PMC free article] [PubMed] [Google Scholar]
- 8. Hoshi M., Sato M., Matsumoto S., Noguchi A., Yasutake K., Yoshida N., Sato K. (2003) Proc. Natl. Acad. Sci. U.S.A. 100, 6370–6375 [DOI] [PMC free article] [PubMed] [Google Scholar]
- 9. Lesné S., Koh M. T., Kotilinek L., Kayed R., Glabe C. G., Yang A., Gallagher M., Ashe K. H. (2006) Nature 440, 352–357 [DOI] [PubMed] [Google Scholar]
- 10. Shankar G. M., Li S., Mehta T. H., Garcia-Munoz A., Shepardson N. E., Smith I., Brett F. M., Farrell M. A., Rowan M. J., Lemere C. A., Regan C. M., Walsh D. M., Sabatini B. L., Selkoe D. J. (2008) Nat. Med. 14, 837–842 [DOI] [PMC free article] [PubMed] [Google Scholar]
- 11. Koffie R. M., Meyer-Luehmann M., Hashimoto T., Adams K. W., Mielke M. L., Garcia-Alloza M., Micheva K. D., Smith S. J., Kim M. L., Lee V. M., Hyman B. T., Spires-Jones T. L. (2009) Proc. Natl. Acad. Sci. U.S.A. 106, 4012–4017 [DOI] [PMC free article] [PubMed] [Google Scholar]
- 12. Haass C., Selkoe D. J. (2007) Nat. Rev. Mol. Cell Biol. 8, 101–112 [DOI] [PubMed] [Google Scholar]
- 13. Hori Y., Hashimoto T., Wakutani Y., Urakami K., Nakashima K., Condron M. M., Tsubuki S., Saido T. C., Teplow D. B., Iwatsubo T. (2007) J. Biol. Chem. 282, 4916–4923 [DOI] [PubMed] [Google Scholar]
- 14. Deleted in proof.
- 15. Tannous B. A., Kim D. E., Fernandez J. L., Weissleder R., Breakefield X. O. (2005) Mol. Ther. 11, 435–443 [DOI] [PubMed] [Google Scholar]
- 16. Kerppola T. K. (2006) Nat. Protoc. 3, 969–971 [DOI] [PMC free article] [PubMed] [Google Scholar]
- 17. Jarrett J. T., Berger E. P., Lansbury P. T., Jr. (1993) Biochemistry 32, 4693–4697 [DOI] [PubMed] [Google Scholar]
- 18. Iwatsubo T., Odaka A., Suzuki N., Mizusawa H., Nukina N., Ihara Y. (1994) Neuron 13, 45–53 [DOI] [PubMed] [Google Scholar]
- 19. Wu H. Y., Hudry E., Hashimoto T., Kuchibhotla K., Rozkalne A., Fan Z., Spires-Jones T., Xie H., Arbel-Ornath M., Grosskreutz C. L., Bacskai B. J., Hyman B. T. (2010) J. Neurosci. 30, 2636–2649 [DOI] [PMC free article] [PubMed] [Google Scholar]
- 20. Nilsberth C., Westlind-Danielsson A., Eckman C. B., Condron M. M., Axelman K., Forsell C., Stenh C., Luthman J., Teplow D. B., Younkin S. G., Näslund J., Lannfelt L. (2001) Nat. Neurosci. 4, 887–893 [DOI] [PubMed] [Google Scholar]
- 21. Townsend M., Shankar G. M., Mehta T., Walsh D. M., Selkoe D. J. (2006) J. Physiol. 572, 477–492 [DOI] [PMC free article] [PubMed] [Google Scholar]
- 22. Kayed R., Head E., Thompson J. L., McIntire T. M., Milton S. C., Cotman C. W., Glabe C. G. (2003) Science 300, 486–489 [DOI] [PubMed] [Google Scholar]
- 23. Oddo S., Caccamo A., Tran L., Lambert M. P., Glabe C. G., Klein W. L., LaFerla F. M. (2006) J. Biol. Chem. 281, 1599–1604 [DOI] [PubMed] [Google Scholar]
- 24. Lee E. B., Leng L. Z., Zhang B., Kwong L., Trojanowski J. Q., Abel T., Lee V. M-Y. (2006) J. Biol. Chem. 281, 4292–4299 [DOI] [PubMed] [Google Scholar]
- 25. Bitan G., Kirkitadze M. D., Lomakin A., Vollers S. S., Benedek G. B., Teplow D. B. (2003) Proc. Natl. Acad. Sci. U.S.A. 100, 330–335 [DOI] [PMC free article] [PubMed] [Google Scholar]
- 26. Murray M. M., Bernstein S. L., Nyugen V., Condron M. M., Teplow D. B., Bowers M. T. (2009) J. Am. Chem. Soc. 131, 6316–6317 [DOI] [PMC free article] [PubMed] [Google Scholar]
- 27. Xia W., Yang T., Shankar G., Smith I. M., Shen Y., Walsh D. M., Selkoe D. J. (2009) Arch. Neurol. 66, 190–199 [DOI] [PMC free article] [PubMed] [Google Scholar]
- 28. Fukumoto H., Tokuda T., Kasai T., Ishigami N., Hidaka H., Kondo M., Allsop D., Nakagawa M. (2010) FASEB J. 24, 2716–2726 [DOI] [PubMed] [Google Scholar]
- 29. LaFerla F., Green K. N., Oddo S. (2007) Nat. Rev. Neurosci. 8, 499–509 [DOI] [PubMed] [Google Scholar]
- 30. Gouras G. K., Tampellini D., Takahashi R. H., Capetillo-Zarate E. (2010) Acta Neuropathol. 119, 523–541 [DOI] [PMC free article] [PubMed] [Google Scholar]
- 31. Walsh D. M., Klyubin I., Fadeeva J. V., Cullen W. K., Anwyl R., Wolfe M. S., Rowan M. J., Selkoe D. J. (2002) Nature 416, 535–539 [DOI] [PubMed] [Google Scholar]
- 32. Kuperstein I., Broersen K., Benilova I., Rozenski J., Jonckheere W., Debulpaep M., Vandersteen A., Segers-Nolten I., Van Der Werf K., Subramaniam V., Braeken D., Callewaert G., Bartic C., D'Hooge R., Martins I. C., Rousseau F., Schymkowitz J., De Strooper B. (2010) EMBO J. 29, 3408–3420 [DOI] [PMC free article] [PubMed] [Google Scholar]
- 33. Török M., Milton S., Kayed R., Wu P., McIntire T., Glabe C. G., Langen R. (2002) J. Biol. Chem. 277, 40810–40815 [DOI] [PubMed] [Google Scholar]
- 34. Yoshiike Y., Chui D. H., Akagi T., Tanaka N., Takashima A. (2003) J. Biol. Chem. 278, 23648–23655 [DOI] [PubMed] [Google Scholar]
- 35. Abramov E., Dolev I., Fogel H., Ciccotosto G. D., Ruff E., Slutsky I. (2009) Nat. Neurosci. 12, 1567–1576 [DOI] [PubMed] [Google Scholar]
- 36. Dolev I., Michaelson D. M. (2004) Proc. Natl. Acad. Sci. U.S.A. 101, 13909–13914 [DOI] [PMC free article] [PubMed] [Google Scholar]
- 37. Bitan G., Vollers S. S., Teplow D. B. (2003) J. Biol. Chem. 278, 34882–34889 [DOI] [PubMed] [Google Scholar]
- 38. Cheng I. H., Palop J. J., Esposito L. A., Bien-Ly N., Yan F., Mucke L. (2004) Nat. Med. 10, 1190–1192 [DOI] [PubMed] [Google Scholar]
- 39. Danzer K. M., Ruf W. P., Putcha P., Joyner D., Hashimoto T., Glabe C., Hyman B. T., McLean P. J. (2011) FASEB J. 25, 326–336 [DOI] [PMC free article] [PubMed] [Google Scholar]


