

Abstract
Complex I (NADH-ubiquinone oxidoreductase) can form superoxide during forward electron flow (NADH-oxidizing) or, at sufficiently high protonmotive force, during reverse electron transport from the ubiquinone (Q) pool (NAD+-reducing). We designed an assay system to allow titration of the redox state of the superoxide-generating site during reverse electron transport in rat skeletal muscle mitochondria: a protonmotive force generated by ATP hydrolysis, succinate:malonate to alter electron supply and modulate the redox state of the Q pool, and inhibition of complex III to prevent QH2 oxidation via the Q cycle. Stepwise oxidation of the QH2/Q pool by increasing malonate concentration slowed the rates of both reverse electron transport and rotenone-sensitive superoxide production by complex I. However, the superoxide production rate was not uniquely related to the resultant potential of the NADH/NAD+ redox couple. Thus, there is a superoxide producer during reverse electron transport at complex I that responds to Q pool redox state and is not in equilibrium with the NAD reduction state. In contrast, superoxide production during forward electron transport in the presence of rotenone was uniquely related to NAD redox state. These results support a two-site model of complex I superoxide production; one site in equilibrium with the NAD pool, presumably the flavin of the FMN moiety (site IF) and the other dependent not only on NAD redox state, but also on protonmotive force and the reduction state of the Q pool, presumably a semiquinone in the Q-binding site (site IQ).
Keywords: Flavin, Mitochondria, Reactive Oxygen Species (ROS), Superoxide Ion, Ubiqinone, Semiquinone
Introduction
Superoxide production by mitochondrial complex I (NADH-ubiquinone (Q)2 oxidoreductase) has been demonstrated using the isolated complex (1, 2), submitochondrial particles (3–7), and intact mitochondria isolated from a number of sources (8–14). Isolated mammalian (bovine) complex I produces superoxide from the reduced flavin of the flavin mononucleotide (FMN) moiety (1, 2, 15). When compared over a range of intramitochondrial NADH/NAD+ ratios, superoxide production by complex I during forward electron transport in intact mitochondria is also maximal when the NAD pool is highly reduced (9, 14, 17).
However, complex I can also produce superoxide at very high rates under conditions that drive the reduction of NAD+ by reverse electron transport. Superoxide production during reverse electron transport has been demonstrated with intact mitochondria (10, 11, 18) and well coupled submitochondrial particles (7, 19). An important distinction is that the rate of superoxide production by isolated mitochondria during reverse electron transport can be severalfold higher than the maximum rate when the flavin is fully reduced by the addition of NADH-generating substrates plus rotenone or other complex I Q site inhibitors (10, 20). The high rate of superoxide production during reverse electron transport is inhibited by complex I Q site inhibitors and is highly sensitive to the pH gradient across the mitochondrial membrane (ΔpH), as well as to uncoupling and declining protonmotive force (Δp) (10, 11).
The observed differences in the rates and properties of superoxide production during forward and reverse electron transport have led to the proposal of a two-site model of superoxide production by complex I. One site is the flavin at the NAD-binding site (site IF) and the other site is located between the flavin and the interaction of complex I with Q (site IQ) (20), which includes the Q-binding site of the complex and the Fe-S centers linking the flavin to the Q-binding site. Possible candidates for this second superoxide-producing site include an unstable semiquinone, such as the Δp-sensitive species reported in Ref. 21, or alternatively this superoxide may come from the interaction of this semiquinone and the terminal Fe-S center N2 or, as suggested in Ref. 3, from N2 itself. Support for the two-site model comes from three key observations: (i) there is a higher superoxide production rate during reverse electron transport compared with forward electron transport; (ii) this higher rate is not accompanied by a greater NADH/NAD+ ratio in isolated mitochondria as would be predicted by a one-site (IF) model, but instead by slightly lower NAD reduction (22); and (iii) this higher rate is highly sensitive to dissipation of ΔpH (10). The third line of evidence is not expected for a one-site IF model, which predicts sensitivity to Δp, which drives electrons from QH2 to the flavin, but not specific sensitivity to the ΔpH component, because of the large distance between the flavin moiety and the proton-translocating region of complex I. In addition, isolated bovine complex I that retains bound Q has EPR signals that appear to come from both the flavin and the Q-binding site, which is also consistent with two sites capable of radical production (23). However, despite this evidence, the two-site model is still under debate (15, 24–28).
In the one-site model, all superoxide production by complex I during both forward and reverse electron transport comes from site IF. This site is characterized by increasing superoxide production with increasing NADH/NAD+ up to a maximal rate (2) and a unique relationship between superoxide production and the potential of the NADH/NAD+ redox couple at constant NAD pool size (2). The direction of electron transfer should not matter in a one-site model. Recently, it was concluded that complex I in submitochondrial particles produces superoxide from the flavin irrespective of the direction of electron transport (27). However, the preparation used in this work failed to recapitulate the central traits that have led to the two-site model: superoxide production during reverse electron transport that is severalfold greater than that from the fully reduced flavin, and sensitivity to ΔpH, suggesting that site IQ was inactive under the conditions studied.
In the two-site model, superoxide production during forward electron transport in the presence of rotenone comes mostly from site IF and is uniquely related to the potential of the NADH/NAD+ redox couple, whereas superoxide production during reverse electron transport comes mostly from site IQ and responds to both NAD and Q redox states as well as Δp.
It is important to understand the sources of superoxide in complex I, not only because of their potential relevance to disease and aging (28), but also because superoxide production provides a mechanistic constraint that helps in building models of the proton-pumping mechanism of complex I (29). Here, we test the one-site model by measuring the relationship between superoxide production and the potential of the NADH/NAD+ redox couple during reverse electron transport in isolated mitochondria. We use isolated mitochondria because they display the requisite high rate of ΔpH-sensitive superoxide production. The results conflict with the one-site model but strongly support the two-site model of superoxide production by complex I.
EXPERIMENTAL PROCEDURES
Animals and Isolation of Mitochondria
Female Wistar rats between 5 and 8 weeks of age were from Harlan Laboratories and had free access to chow and water. All housing, husbandry, and sampling procedures were approved by the Buck Institute Animal Care Committee. Rats were killed by asphyxiation with CO2 followed by cervical dislocation. Skeletal muscle was removed from both hind limbs and placed in ice-cold Chappell-Perry buffer 1 (100 mm KCl, 50 mm Tris, 2 mm EGTA, pH 7.1, at 25 °C). Muscle was homogenized and extracted with subtilisin A (Type VIII) at 0 °C as described (30). Mitochondria were isolated from the homogenate by differential centrifugation with all steps at 0–4 °C. The initial extract was centrifuged at 500 × g for 10 min. The resulting supernatant was filtered through several layers of cheesecloth and centrifuged at 10,000 × g for 10 min, and the supernatant was discarded. The pellets were resuspended in ice-cold Chappell-Perry buffer 1 and centrifuged again at 10,000 × g for 10 min. The resulting pellet was resuspended a second time in ice-cold Chappell-Perry buffer 1 and centrifuged for 5 min at 500 × g, and the resulting supernatant was then centrifuged for 10 min at 4,000 × g. This final pellet was resuspended in Chappell-Perry buffer 1 to final concentration of 25–45 mg of protein · ml−1, as determined by biuret assay using BSA as a standard.
Mitochondrial H2O2 Production
The release of H2O2 by intact mitochondria was used as a measure of superoxide production. The assay was based on the detection of H2O2 by Amplex UltraRed (50 μm) in a medium (pH 7.2 at 37 °C) containing 250 mm sucrose, 25 mm Tris, 2 mm EGTA, 2 mm ATP, and 5 units · ml−1 horseradish peroxidase and 25 units · ml−1 superoxide dismutase. Formation of the fluorescent product was monitored in a Shimadzu RF-5301PC spectrofluorophotometer (excitation 563 nm, emission 587 nm) or a Varian Eclipse spectrophotometer (excitation 560 nm, emission 590 nm) with constant mixing at 37 °C. Calibration curves generated by adding known amounts of H2O2 under identical conditions were used to convert rates of fluorescent product formation into mol of H2O2 produced. Unless otherwise shown, the observed rate of product formation before the addition of substrate was subtracted from the subsequent rates. Mitochondria were either pretreated with 1-chloro-2,4-dinitrobenzene (CDNB) to deplete GSH as described previously (17), or rates of H2O2 release from untreated mitochondria were corrected based on the CDNB pretreatment of rat skeletal muscle mitochondria using the equation in (17):
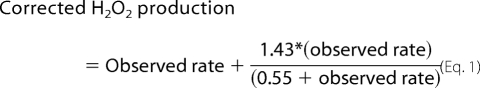 |
Rates were corrected directly from the raw observed rate of H2O2 release assuming all product was formed in the matrix.
The maximum rate of rotenone-sensitive superoxide production was lower in Fig. 3 (CDNB-treated mitochondria) than Fig. 2 (not CDNB-treated but corrected as above). This may reflect a slightly lower Δp in Fig. 3 caused either by CDNB treatment or the longer energization period (1.5 min in Fig. 2 compared with 4 min in Fig. 3) because superoxide production during reverse electron transport is highly sensitive to Δp (10). Despite this difference, the overall patterns of response were comparable between Figs. 2 and 3.
FIGURE 3.

Experimental design to compare mitochondrial percent NAD(P)H and superoxide production. A and B, representative traces of percent NAD(P)H (A) and superoxide production, measured as H2O2 release (B) by CDNB-treated rat skeletal muscle mitochondria. C and D, data were averaged over either 0.5- or 1-min intervals (as indicated) and are plotted as the mean ± S.E. (n = 3) for percent NAD(P)H (C) and the rate of superoxide production (D). The signal spikes (†) in A using 1:1 succinate:malonate were caused by air bubbles and were excluded from subsequent analysis. Additions in all cases (A–D, and indicated by arrows in A and B) were 2 mm ATP and stigmatellin (1 nmol · mg mitochondrial protein−1) added at 5 min (1.), followed by the succinate:malonate mixture as indicated at 9 min (2.) and 4 μm rotenone at 15 min (3.). Succ, succinate.
FIGURE 2.

Titration of superoxide production by complex I during reverse electron transport. Superoxide production by rat skeletal muscle mitochondria not pretreated with CDNB was measured as H2O2 production as illustrated in Fig. 1B. Mitochondria were incubated for 1.5 min in the presence of 2 mm ATP and 200 nm stigmatellin, then 5 mm (succinate + malonate) was added at the ratios shown. The rate of superoxide production was measured before (triangles) or after (circles) addition of 4 μm rotenone at 3 min. The rate with 5 mm succinate was not different (p > 0.05, paired t test) from the rate at the highest ratio shown (99:1). The background rates before the addition of succinate were subtracted from all rates. Data are mean ± S.E. (error bars; n = 3).
NAD(P)H Redox State
Mitochondrial NADH/NAD+ was measured using the NAD(P)H autofluorescence (excitation 365 nm, emission 450 nm) of mitochondrial suspensions (0.3 mg of mitochondrial protein · ml−1) maintained with mixing at 37 °C in a Varian Eclipse spectrophotometer. For details, see Ref. 17. Briefly, mitochondria were left de-energized for 5 min to fully oxidize the matrix nucleotide pools, and the signal was set at 0% NAD(P)H. To determine the scale for the fully reduced (100%) NAD(P)H pool, 5 mm glutamate, 5 mm malate, and 4 μm rotenone were then added. A linear scale from 0 to 100% NAD(P)H was assumed for subsequent calculation of % reduction. Although this technique measures the reduction of both the NAD and NADP pools, as explained elsewhere (17), for skeletal muscle mitochondria this signal is predominantly from the NAD pool and is a sufficient proxy for intramitochondrial NADH/NAD+. However, the NADPH pool contributes a small signal, which we acknowledge by using the term %NAD(P)H.
The working potential (Eh) of the NAD pool was determined using the NAD+/NADH ratio calculated assuming %NAD(P)H = %NADH. For each succinate:malonate condition the following were used in the Nernst equation: n (number of electrons transferred) = 2, temperature = 310 K, and midpoint potential (Em) for the NAD+/NADH couple at pH 7.4 = −332 mV. The generation of Δp with ATP will alkalinize the mitochondrial matrix relative to the medium. We used a matrix pH of 7.4 based on an assumed ΔpH of 0.2 pH units from the set pH of 7.2 in the buffered medium.
Data Analysis
Data are presented as mean ± S.E. unless otherwise stated. Differences between treatments (substrate conditions) were analyzed by t test (paired when appropriate) with p < 0.05 considered significant.
The relationships in Fig. 4A were fitted by nonlinear regression using the equation
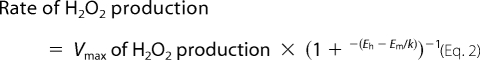 |
where Eh is the working potential of the NAD pool, Em is the fitted midpoint potential of the relationships observed in Fig. 4A, and k is a constant. Parameter values were: Vmax (nmol of H2O2 · min−1 · mg of protein−1) = 1.02 ± 0.04, 0.83 ± 0.09, 0.4 ± 0.07; Em (mV) = −333 ± 6, −335 ± 7, −337 ± 4; k = −7.3 ± 1.5, −14.3 ± 3.0, −9.9 ± 3.9 for the 1:1 succinate:malonate, 1:2 succinate:malonate, and the combined 1:1 and 1:2 succinate:malonate (plus rotenone) data, respectively.
FIGURE 4.

Relationship between superoxide production and Eh of NAD during reverse and forward electron transport at different ratios of succinate:malonate. Data are from Fig. 3, C and D. A, Eh of the NAD pool was calculated as described under “Experimental Procedures. ” Values were averaged to give percent reduction or superoxide production rates over 0.5 min (or 1 min as indicated in Fig. 3) and are means ± S.E. (error bars; n = 3). The rate of reverse electron transport with 5 mm succinate (Succ) was too rapid to obtain accurate intermediate values of percent NAD(P)H, so this dataset was omitted. Solid lines are sigmoid nonlinear regressions (“Experimental Procedures”). In the absence of rotenone at each succinate:malonate ratio (filled symbols), these regressions fit well (p < 0.0001). In the presence of rotenone (open symbols) the relatively large variation in the data yielded parameter values that were not significant (p > 0.15), so all data for 1:1 and 1:2 succinate:malonate after rotenone addition were pooled. The regression through the combined mean values was highly significant (p < 0.0001), and all parameter values were significant (p < 0.05). The dashed vertical line indicates a common Eh of −355 mV. B, superoxide production at Eh of NAD = −355 mV. Values from the data in A were calculated using the regression equations at Eh NAD = −355 mV. Data for reverse electron transport are mean ± S.E. (n = 3). *, p < 0.05 by t test. a, value for forward electron transport was calculated from the nonlinear regression of the pooled data and is given ±95% confidence interval.
RESULTS AND DISCUSSION
Assay Design
Superoxide production from complex I during reverse electron transport requires sufficiently high Δp. Fig. 1A illustrates the assay designed to achieve this while allowing the redox state of the Q pool to be manipulated. Stigmatellin, which blocks the Qo site of complex III, was added to eliminate Q pool oxidation and superoxide production by complex III. To generate a Δp to drive reverse electron transport from QH2 to NAD+, 2 mm ATP was added. Under these conditions, addition of 5 mm succinate as a source of electrons to reduce the Q pool resulted in a rapid and sufficiently constant rate of superoxide production (Fig. 1B). We chose a sucrose-based assay medium because a KCl-based medium gave low, variable and nonlinear rates of superoxide production. Superoxide production from reverse electron transport was defined as the component of the total production that was sensitive to rotenone (4 μm), which specifically inhibits electron transport at the Q-binding site of complex I. Omission of ATP or addition of 0.1 μg · ml−1 oligomycin (to block ATP hydrolysis) abolished rotenone-sensitive superoxide production (Fig. 1B), showing that it was fully dependent on Δp generated by ATP hydrolysis. Addition of atpenin A5 (1 μm), a complex II Q site inhibitor, inhibited superoxide production to a similar extent as rotenone. Rotenone addition after atpenin A5, or A5 addition after rotenone, had little effect compared with the site IQ production rate (not shown).
FIGURE 1.

Assay of superoxide production by complex I during reverse electron transport. A, overview of experimental design. Complex II oxidizes added succinate to fumarate and feeds the electrons into the Q pool. Addition of stigmatellin, an inhibitor of the Qo site of complex III, prevents superoxide production by complex III and reoxidation of the Q pool by the Q cycle. Hydrolysis of added ATP by the mitochondrial ATP synthase generates a protonmotive force that drives reverse electron transport from the Q pool through complex I to reduce NAD+ to NADH + H+. Rotenone inhibits the Q-binding site of complex I, so superoxide generated by reverse electron transport through complex I is defined as the rotenone-sensitive component of the observed superoxide production rate. The redox state of the Q pool and complex I superoxide production are titrated by inhibiting electron entry from succinate using malonate (a competitive inhibitor of succinate uptake and succinate dehydrogenase), keeping the sum of succinate and malonate constant at 5 mm to avoid nonspecific effects of dicarboxylic acids. B, rotenone-sensitive superoxide production requires ATP hydrolysis. Representative traces of mitochondrial superoxide production in this system are shown, detected as fluorescence caused by oxidation of Amplex Ultrared by H2O2 in the presence of 200 nm stigmatellin. Assay conditions are described under “Experimental Procedures.” In the presence of 2 mm ATP, addition of 5 mm succinate causes rapid superoxide production, which is largely inhibited by 4 μm rotenone, defining it as superoxide produced from complex I during reverse electron transport. Omission of ATP or addition of 0.1 μg ml−1 oligomycin to inhibit ATP hydrolysis and generation of Δp abolishes rotenone-sensitive superoxide production.
Titration of Superoxide Production from Complex I during Reverse Electron Transport
Rotenone-sensitive superoxide production was titrated by changing the ratio of succinate to malonate (a competitive inhibitor of succinate transport and complex II) to alter the kinetic balance of Q pool reduction and oxidation rates (Fig. 2). At higher succinate:malonate ratios, the capacity to reduce the Q pool became greater and rotenone-sensitive superoxide production increased to a maximum. Under all substrate conditions most of the superoxide production was inhibited by adding rotenone to block the supply of electrons from QH2 to complex I (Fig. 2) (the characteristics of the residual rotenone-insensitive rate are explored in Fig. 3 and Fig. 5A below). Thus, the rate of rotenone-sensitive superoxide production from complex I during reverse electron transport at high Δp depends on the redox state of the Q pool and shows saturation at high reduction.
FIGURE 5.

Relationship between superoxide production and the Eh of the electron-donating substrate. Data are means ± S.E. (error bars; n = 3). Where not visible, error bars are obscured by the symbol. A, relationship between superoxide production rate and Eh of NAD during forward electron transport. Open symbols are replotted from Fig. 4A. Filled symbols are site IF data recalculated from Ref. 17. B, relationship between superoxide production rate and Eh of Q during reverse electron transport with Δp maintained by ATP hydrolysis. Data are from Fig. 3 and Table 1. Succ, succinate.
Experimental Discrimination between One-site and Two-site Models of Superoxide Production by Complex I
The characteristics of superoxide production during reverse electron transport (climbing to a maximum and then staying high as the capacity to reduce complex I increases) are shared by site IF when the NADH/NAD+ ratio is increased during forward electron transport (2, 9, 14, 17). Because of this similarity, it was important to characterize further the superoxide producer during reverse electron transport to determine whether rotenone-sensitive superoxide comes from the flavin of complex I (site IF) or from the Q-binding site of complex I (site IQ). For this, we designed an experiment where NAD reduction (measured as percent NAD(P)H) (Fig. 3, A and C) was determined in parallel with superoxide production (Fig. 3, B and D) as a function of time under conditions of first reverse, and then forward electron flow into complex I. This design allowed us to examine the dependence of each mode of superoxide production on the redox states of the NAD and Q pools, as described below, to see whether the modes were similar (supporting a one-site model) or different (supporting a two-site model).
Fig. 3 shows the central experiment. Fig. 3, A and B, shows representative raw traces, and Fig. 3, C and D, shows averaged results. ATP and stigmatellin were added (addition 1) to generate Δp and block complex III, resulting in a partial reduction of NAD(P) and a background rate of superoxide production. After 4 min, succinate:malonate mixes at a sum total concentration of 5 mm were added (addition 2) to reduce the Q pool at different rates and initiate reverse electron transport. This caused markedly different rates of NAD(P)H production to slightly different steady-state values (Fig. 3, A and C) and (as in Fig. 2) markedly different rates of superoxide production (Fig. 3, B and D). The values are summarized in Table 1. Addition of rotenone (addition 3) halted reverse electron transport and its associated superoxide production, allowing calculation of the rotenone-sensitive component of the preceding superoxide production. These data allowed determination of the dependence of rotenone-sensitive superoxide production during reverse electron transport on NAD(P) and Q reduction states (see below). After addition of rotenone, with a strongly reduced NAD(P) pool from the earlier period of reverse electron transport, forward electron transport into site IF dominated the residual superoxide production rate. As electrons leaked to oxygen and other acceptors from NAD(P)H, this phase of the experiment allowed determination of the rate of superoxide production predominantly from site IF at different reduction states of NAD(P). Note that in this phase, site IQ may also generate a small proportion of the superoxide under these conditions of high Δp plus rotenone (20). Likewise, at high NADH/NAD+, reversal of the dihydrolipoamide dehydrogenase component of oxoacid dehydrogenase complexes may also contribute to our observed H2O2 production (31). These alternate NADH-dependent producers of H2O2 are important to consider physiologically, but for simplicity we do not discriminate between them when referring to site IF.
TABLE 1.
Effect of malonate inhibition of succinate oxidation on NAD+ reduction and superoxide production by complex I
Data are from Fig. 3. The maximum reduction state of NAD was taken as the highest observed value in Fig. 3C. The value of percent NAD(P)H was used to calculate NAD+/NADH to determine the maximum working potential (Eh) reached. Eh for Q/QH2 was calculated as Q pool Eh = NAD pool Eh + 2Δp; Δp generated by ATP was assumed to be 145 mV (20). The rate of reverse electron transport was calculated as the initial rate of NAD(P)+ reduction following the addition of succinate. The maximum rotenone-sensitive superoxide production was the highest rate observed in Fig. 3D, with the rate in the presence of 4 μm rotenone subtracted. Data are mean ± S.E. (n = 3). Different superscripts in the same row indicate a difference (p < 0.05, paired t test).
| 5 mm succinate | Succinate:malonate 1:1 | Succinate:malonate 1:2 | |
|---|---|---|---|
| Maximum reduction of NAD (% NAD(P)H) | 94.6 ± 1.9a | 93.9 ± 0.1a,b | 87.2 ± 2.2b |
| Maximum Eh (NAD+/NADH) (mV) | −373 ± 6 | −368 ± 1 | −358 ± 3* |
| Maximum Eh (Q/QH2) (mV) | −83 ± 6 | −78 ± 1 | −68 ± 3 |
| Reverse electron transport rate (% NAD(P)H· min−1) | 144 ± 6.5a | 47.2 ± 5.6b | 23.1 ± 2.0c |
| Maximum rotenone-sensitive superoxide production rate (nmol H2O2·min−1·mg protein−1) | 1.38 ± 0.09a | 0.86 ± 0.03b | 0.48 ± 0.03c |
* p = 0.086 compared with 5 mm succinate (paired t test).
The rate of reverse electron transport following substrate addition (addition 2 in Fig. 3A) should depend on the value of Δp (held constant between treatments by ATP hydrolysis) and the redox state of the Q pool. We measured the rate of reverse electron transport as the initial rate of change in the percent reduction of NAD(P) (Fig. 3, A and C, and Table 1) at different succinate:malonate ratios. The rate of reverse electron transport was greatly inhibited as the succinate:malonate ratio decreased (Table 1). Thus, reverse electron transport requires a very reduced Q pool, and its rate is highly sensitive to small declines in QH2/Q at the same Δp.
Working Redox Potentials of the NAD Pool and the Q Pool
During reverse electron transport at different succinate:malonate ratios, we can calculate the working redox potential (Eh) of the NAD+/NADH couple from percent NAD(P)H reduction. In turn, this can be used to calculate the Eh of the Q/QH2 couple when net reverse electron flow ceases, if we assume near equilibrium of ΔEh with Δp across complex I, and four protons translocated by complex I per pair of electrons (32).
The Eh of the NAD+/NADH couple supported by reverse electron transport can be estimated by converting percent NAD(P)H to NAD+/NADH and substituting into the Nernst equation. Using a midpoint potential (E′m) of −332 mV (Em of NAD+/NADH couple at pH 7.4), the maximum Eh values ranged from −373 mV with 5 mm succinate to −358 mV with 1:2 succinate:malonate (Table 1). Differences approached statistical significance (p = 0.087, paired t test) and were biologically significant because percent NAD(P)H (Table 1) and calculated NAD+/NADH (data not shown) were both significantly different (p < 0.05) between 5 mm succinate and 1:2 succinate:malonate.
Assuming equilibrium between Δp and the ΔEh between the NAD and Q pools in the steady states where percent NAD(P)H has stabilized (32), the Eh of the Q/QH2 couple is offset from the Eh of the NAD+/NADH couple by 2Δp. Rat skeletal muscle mitochondrial energized with ATP generate a Δp of ∼145 mV (20). Using this value we find that even with 1:2 succinate:malonate the Q pool is highly reduced, at −68 mV (Table 1). Because the Em of the membrane Q pool is +42 mV at pH 7.4 (Em at pH 7.0 is +66 mV with a −60 mV change per pH unit increase) (16), this corresponds to >99% reduction of the Q pool. With succinate alone, the Q pool was even more reduced, at −83 mV (Table 1).
Relationship between Eh of NAD and Superoxide Production during Reverse Electron Transport
NADH and NAD+ are the reactants at the flavin of complex I (site IF). Because of the large Vmax and ready reversibility of this site, the intramitochondrial NAD pool and the flavin of complex I should be near equilibrium during forward electron transport (particularly in the presence of rotenone) and during reverse electron transport (at all rates of electron transport, but particularly when percent NAD(P)H is high and net rates are slow). Thus, in mitochondria the flavin reduction state and the consequent rate of superoxide production from site IF should be a unique function of percent NAD(P)H or the Eh of the NAD pool.
In a one-site model of complex I superoxide production, the superoxide produced during reverse electron transport comes entirely from site IF, so should be uniquely related to the Eh of the NAD pool regardless of the Eh of the Q pool. Conversely, in a two-site model this superoxide comes mostly from site IQ, so the relationship between superoxide and the Eh of the NAD pool may alter when the Eh of the Q pool is altered. The data in Fig. 3 and Table 1 allow these models to be distinguished by plotting superoxide production against the Eh of the NAD pool at different Eh values of the Q pool during reverse (and forward) electron transport, as shown in Fig. 4.
It is clear from Fig. 4A (filled symbols) that the relationship between superoxide production rate during reverse electron transport and the Eh of the NAD pool differed depending on the Eh of the Q pool (modulated by the different succinate:malonate ratios). This result is inconsistent with the one-site model and strongly supports the two-site model. These relationships also appear to differ from the relationship during forward electron transport in the presence of rotenone (open symbols in Fig. 4A, line fitted to pooled data after rotenone addition in Fig. 3, C and D), showing that the properties of site IF in the presence of rotenone do not adequately explain the rate of superoxide production during reverse electron transport, so this superoxide must come from a second site (site IQ).
Fig. 4B makes the same point more explicitly, by comparing the rates of superoxide production under different conditions at the same arbitrary Eh of the NAD pool (−355 mV). The rates during reverse electron transport were significantly different at the two different succinate:malonate ratios, where the Eh of the NAD pool was the same but the Eh of the Q pool differed, and both rates appeared to be greater than the rate from site IF at the same Eh of the NAD pool. The rate at −355 mV in the presence of rotenone is the value modeled from the pooled data ± the 95% confidence interval. It cannot be compared with the other values by t test (or other similar statistical tests). However, the other two values are far outside this 95% confidence interval (Fig. 4B), making it reasonable to state that these are likely to be different. Therefore, because the rate of superoxide formation can be different at the same Δp and same intramitochondrial Eh for NAD, these data strongly support the contention that complex I has a superoxide producer whose rate is not determined solely by the redox state of the NAD pool (i.e. site IQ).
Relationship between Eh of NAD and Superoxide Production during Forward Electron Transport
Following the addition of rotenone in Fig. 3, superoxide production fell dramatically as reverse electron transport came to a halt, allowing the properties of the rotenone-sensitive reverse electron transport-dependent superoxide production to be analyzed, above. However, a residual rate of superoxide production remained, and this mode is examined here. Under these conditions the NAD pool had been filled with electrons driven up from the Q pool by reverse electron transport (Fig. 3, A and C). On addition of rotenone, the NADH was able to drive forward electron transport into complex I and generate superoxide. The flavin of complex I was the only major superoxide producer that was not inhibited in this state (although site IQ may also have generated some superoxide because Δp was high) (20), so the residual superoxide production after rotenone addition came predominantly from site IF.
Fig. 5A shows the dependence of this superoxide production from site IF on the redox state of the NAD pool as it slowly reoxidized following addition of rotenone (repeating the data for forward electron transport in Fig. 4). The data were best fit by a single, unique relationship between superoxide production rate and Eh of the NAD pool despite different succinate:malonate ratios and different redox states of the Q pool. This result supports the notion that following the addition of rotenone, superoxide was produced by a site that was in equilibrium with the intramitochondrial NAD pool and was not affected by the redox state of the Q pool. The filled symbols in Fig. 5A show data from a previous titration of site IF superoxide production (17). These data sets overlay, adding strong support to our contention that the superoxide produced in the presence of rotenone came from site IF. Thus, superoxide production from site IF was uniquely related to the potential of the NADH/NAD+ redox couple, in contrast to the superoxide production during reverse electron transport.
Relationship between Superoxide Production during Reverse Electron Transport and Eh of Q
Fig. 5B shows the relationship between rotenone-sensitive superoxide production rate and the calculated Q pool redox state in the steady state supported by reverse electron transport once the electron transport rates had slowed (Fig. 3 and Table 1) and complex I could be safely assumed to be near equilibrium. The rate declined very steeply when the Q pool was slightly more oxidized, showing that superoxide production by site IQ requires a very high reduction of the Q pool and is very sensitive to small declines in Q pool redox state. Note that the x axis spans 50 mV for both A and B panels of Fig. 5. The steep dependence on the availability of QH2 in Fig. 5B is in marked contrast to the much shallower relationship between site IF and percent NAD(P)H in Fig. 5A.
Importance of the Two-site Model
It is unclear whether site IQ is a major source of superoxide under physiological conditions. It may be that the combined presence of multiple substrates that supply electrons to the Q pool, including succinate, fatty acids, α-glycerophosphate, and the branched chain amino acids, can result in conditions sufficient for site IQ superoxide production. Even if not physiologically significant, the presence of this second site of complex I superoxide production, which is influenced by Δp, ΔpH, and the reduction state of the NAD and Q pools, can be a valuable tool in understanding the still contentious mechanism of coupling redox reactions at complex I to proton translocation (29).
In summary, with the assay system used in the present study, the superoxide produced during reverse electron transport was dependent on a highly reduced Q pool and declined sharply as the QH2/Q ratio decreased. The majority of the superoxide produced during reverse electron transport came from a site that was not in equilibrium with the NAD pool. Therefore, the flavin of the FMN moiety (site IF) is not supported as the sole superoxide generator during reverse electron transport, and our results are inconsistent with the one-site model of superoxide production by complex I. Our data using intact mitochondria support the hypothesis that complex I has two superoxide-producing redox centers: one with a low maximum rate of production that is in equilibrium with the NAD pool (site IF), and one with a higher maximum rate of production that is dependent on the reduction state of the Q pool, requires the presence of Δp to drive reverse electron transport, and (under the conditions used here) is inhibited by rotenone (site IQ).
This work was supported, in whole or in part, by National Institutes of Health Grants P01 AG025901, PL1 AG032118, and R01 AG033542. This work was also supported by Ellison Medical Foundation Grant AG-SS-2288-09.
- Q
- ubiquinone
- CDNB
- 1-chloro-2,4-dinitrobenzene
- Eh
- working potential
- Em
- midpoint potential
- Δp
- protonmotive force
- ΔpH
- pH difference across the mitochondrial inner membrane
- IF
- superoxide-producing flavin of complex I
- IQ
- superoxide-producing site of complex I responsible for high rates during reverse electron transport
- QH·
- semiquinone radical.
REFERENCES
- 1. Esterházy D., King M. S., Yakovlev G., Hirst J. (2008) Biochemistry 47, 3964–3971 [DOI] [PubMed] [Google Scholar]
- 2. Kussmaul L., Hirst J. (2006) Proc. Natl. Acad. Sci. U.S.A. 103, 7607–7612 [DOI] [PMC free article] [PubMed] [Google Scholar]
- 3. Genova M. L., Ventura B., Giuliano G., Bovina C., Formiggini G., Parenti Castelli G., Lenaz G. (2001) FEBS Lett. 505, 364–368 [DOI] [PubMed] [Google Scholar]
- 4. Herrero A., Barja G. (2000) J. Bioenerg. Biomembr. 32, 609–615 [DOI] [PubMed] [Google Scholar]
- 5. Krishnamoorthy G., Hinkle P. C. (1988) J. Biol. Chem. 263, 17566–17575 [PubMed] [Google Scholar]
- 6. Ramsay R. R., Singer T. P. (1992) Biochem. Biophys. Res. Commun. 189, 47–52 [DOI] [PubMed] [Google Scholar]
- 7. Vinogradov A. D., Grivennikova V. G. (2005) Biochemistry 70, 120–127 [DOI] [PubMed] [Google Scholar]
- 8. Hansford R. G., Hogue B. A., Mildaziene V. (1997) J. Bioenerg. Biomembr. 29, 89–95 [DOI] [PubMed] [Google Scholar]
- 9. Kushnareva Y., Murphy A. N., Andreyev A. (2002) Biochem. J. 368, 545–553 [DOI] [PMC free article] [PubMed] [Google Scholar]
- 10. Lambert A. J., Brand M. D. (2004) Biochem. J. 382, 511–517 [DOI] [PMC free article] [PubMed] [Google Scholar]
- 11. Liu Y., Fiskum G., Schubert D. (2002) J. Neurochem. 80, 780–787 [DOI] [PubMed] [Google Scholar]
- 12. Miwa S., St-Pierre J., Partridge L., Brand M. D. (2003) Free Radic. Biol. Med. 35, 938–948 [DOI] [PubMed] [Google Scholar]
- 13. St-Pierre J., Buckingham J. A., Roebuck S. J., Brand M. D. (2002) J. Biol. Chem. 277, 44784–44790 [DOI] [PubMed] [Google Scholar]
- 14. Starkov A. A., Fiskum G. (2003) J. Neurochem. 86, 1101–1107 [DOI] [PubMed] [Google Scholar]
- 15. Hirst J., King M. S., Pryde K. R. (2008) Biochem. Soc. Trans. 36, 976–980 [DOI] [PubMed] [Google Scholar]
- 16. Urban P. F., Klingenberg M. (1969) Eur. J. Biochem. 9, 519–525 [DOI] [PubMed] [Google Scholar]
- 17. Treberg J. R., Quinlan C. L., Brand M. D. (2010) FEBS J. 277, 2766–2778 [DOI] [PMC free article] [PubMed] [Google Scholar]
- 18. Korshunov S. S., Skulachev V. P., Starkov A. A. (1997) FEBS Lett. 416, 15–18 [DOI] [PubMed] [Google Scholar]
- 19. Grivennikova V. G., Vinogradov A. D. (2006) Biochim. Biophys. Acta 1757, 553–561 [DOI] [PubMed] [Google Scholar]
- 20. Lambert A. J., Brand M. D. (2004) J. Biol. Chem. 279, 39414–39420 [DOI] [PubMed] [Google Scholar]
- 21. Magnitsky S., Toulokhonova L., Yano T., Sled V. D., Hägerhäll C., Grivennikova V. G., Burbaev D. S., Vinogradov A. D., Ohnishi T. (2002) J. Bioenerg. Biomembr. 34, 193–208 [DOI] [PubMed] [Google Scholar]
- 22. Lambert A. J., Buckingham J. A., Brand M. D. (2008) FEBS Lett. 582, 1711–1714 [DOI] [PubMed] [Google Scholar]
- 23. Ohnishi S. T., Shinzawa-Itoh K., Ohta K., Yoshikawa S., Ohnishi T. (2010) Biochim. Biophys. Acta 1797, 1901–1909 [DOI] [PubMed] [Google Scholar]
- 24. Fato R., Bergamini C., Bortolus M., Maniero A. L., Leoni S., Ohnishi T., Lenaz G. (2009) Biochim. Biophys. Acta 1787, 384–392 [DOI] [PMC free article] [PubMed] [Google Scholar]
- 25. Ohnishi S. T., Ohnishi T., Muranaka S., Fujita H., Kimura H., Uemura K., Yoshida K., Utsumi K. (2005) J. Bioenerg. Biomembr. 37, 1–15 [DOI] [PubMed] [Google Scholar]
- 26. Brand M. D. (2010) Exp. Gerontol. 45, 466–472 [DOI] [PMC free article] [PubMed] [Google Scholar]
- 27. Pryde K. R., Hirst J. (2011) J. Biol. Chem. 286, 18056–18065 [DOI] [PMC free article] [PubMed] [Google Scholar]
- 28. Quinlan C. L., Treberg J. R., Brand M. D. (2011) in Handbook of the Biology of Aging (Masoro E. J., Austad S. N. eds) 7th Ed., pp. 47–61, Academic Press, London [Google Scholar]
- 29. Treberg J. R., Brand M. D. (2011) J. Biol. Chem. 286, 17579–17584 [DOI] [PMC free article] [PubMed] [Google Scholar]
- 30. Rolfe D. F. S., Hulbert A. J., Brand M. D. (1994) Biochim. Biophys. Acta 1188, 405–416 [DOI] [PubMed] [Google Scholar]
- 31. Ambrus A., Tretter L., Adam-Vizi V. (2009) J. Neurochem. 109, 222–229 [DOI] [PubMed] [Google Scholar]
- 32. Brown G. C., Brand M. D. (1988) Biochem. J. 252, 473–479 [DOI] [PMC free article] [PubMed] [Google Scholar]