Abstract
The human apical sodium-dependent bile acid transporter (hASBT, SLC10A2) plays a critical role in the enterohepatic circulation of bile acids, as well as in cholesterol homeostasis. ASBT reclaims bile acids from the distal ileum via active sodium co-transport, in a multistep process, orchestrated by key residues in exofacial loop regions, as well as in membrane-spanning helices. Here, we unravel the functional contribution of highly conserved transmembrane helix 1 (TM1) on the hASBT transport cycle. Consecutive cysteine substitution of individual residues along the TM1 helix (Ile29–Gly50), as well as exofacial Asn27 and Asn28, resulted in functional impairment of ∼70% of mutants, despite appreciable cell surface expression for all but G50C. Cell surface expression of G50C and G50A was rescued upon MG132 treatment as well as cyclosporine A, but not by FK506 or bile acids, suggesting that Gly50 is involved in hASBT folding. TM1 accessibility to membrane-impermeant MTSET remains confined to the exofacial half of the helix along a single, discrete face. Substrate protection from MTSET labeling was temperature-dependent for L34C, T36C, and L38C, consistent with conformational changes playing a role in solvent accessibility for these mutants. Residue Leu30 was shown to be critical for both bile acid and sodium affinity, while Asn27, Leu38, Thr39, and Met46 participate in sodium co-transport. Combined, our data demonstrate that TM1 plays a pivotal role in ASBT function and stability, thereby providing further insight in its dynamic transport mechanism.
Keywords: Bile Acid, Drug Transport, Membrane Proteins, Site-directed Mutagenesis, Transport Drugs, Xenobiotics
Introduction
Enterohepatic recirculation is a highly efficient mechanism for conserving the body's total bile acid pool. Whereas the majority of bile acids are reabsorbed passively throughout the small intestine, active reabsorption occurs in the distal ileum by the apical sodium-dependent bile acid transporter (ASBT,2 SLC10A2). As a high-capacity, high-affinity co-transporter, ASBT effectively reclaims the vast majority of bile acids, such that less than 5% of the circulating bile acid pool is lost through fecal elimination (1). Defective ASBT transport is associated with various disease conditions (2–4). Further, ASBT constitutes a pharmacologic target for improving oral drug bioavailability (5–7) as well as hypocholesterolemic agents, because cholesterol metabolism is induced upon bile acid depletion (8, 9). To elucidate the structure-function relationship of ASBT, our laboratory has previously employed cysteine scanning mutagenesis and site-directed alkylation techniques (10, 11) to determine structural requirements for substrates and their turnover (11–16). We demonstrate that residues lining TM6 (12) and TM7 (15) participate in substrate recognition and protein entry from the exofacial matrix, while the cytosolic half of TM3 mediates substrate release into the cytosolic milieu (14), putatively in conjunction with TM4 (18). Moreover, the extracellular loop (EL) 1 (13) and EL3 (16) regions mediate initial bile acid and sodium recognition and binding and may facilitate movement of ligands in solvent-accessible pockets situated deeper into the protein core, for ultimate translocation along membrane-spanning domains. A number of groups have corroborated the functional importance of key residues identified in ASBT transport and function (20, 21).
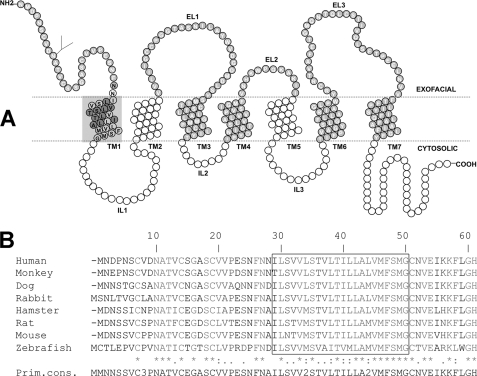
The present study extends our analysis to TM1 based on: (i) its high degree of amino acid conservation among a wide range of ASBT orthologs (3) (Fig. 1B), in particular the sodium-dependent organic anion transporter (SOAT; SLC10A6) (22), and NTCP (SLC10A1) (23); (ii) the relatively amphipathic nature of TM1, which would facilitate passage of charged substrates during permeation events; and (iii) the spatial proximity of TM1 to other regions of functional importance, specifically EL1 and TM7 (10, 11). Based on these facts, we hypothesized that TM1 plays a pivotal role in the ASBT substrate translocation process.
FIGURE 1.
ASBT (SLC10A2) protein secondary structure and sequence conservation across species. A, secondary structure of ASBT based on our validated topology model (19). Circles represent single amino acid residues; dotted lines indicate the lipid-aqueous interface, with large-scale protein features (i.e. extracellular loop (EL), intracellular loop (IL), and transmembrane (TM) regions); dark-shaded circles indicate residues previously submitted to Cys-scanning mutagenesis and thiol modification. Residues comprising the TM1 region are encircled by a light gray square and contain their single-letter amino acid designation in black. B, TM1 (Ile29-Gly50) is indicated by a box. Sequences were aligned with ClustalW (17), and the levels of conservation are highlighted, with asterisks (*) representing identical residues, colons (:) demonstrating strongly similar residues, and a period (.) denoting weakly similar residues.
EXPERIMENTAL PROCEDURES
Materials
[3H]Taurocholic acid (0.2 Ci/mmol) was purchased from American Radiolabeled Chemicals, Inc, (St. Louis, MO); taurocholic acid (TCA) and glychodeoxycholic acid (GDCA) from Sigma; MTS reagents from Toronto Research Chemicals, Inc, (North York, ON, Canada); immobilized streptavidin from Pierce Biotechnology, Inc.; pepstatin from Research Products International Corp. (Mt. Prospect, IL); MG132 from Cayman Chemical (Ann Harbor, MI); WST-1 reagent from Roche Diagnostics GmbH (Mannheim, Germany); cell culture media and supplies were obtained from Invitrogen (Rockville, MD). All other chemicals were of the highest purity available commercially.
Site-directed Mutagenesis, Transfection, Cell Culture, and Protein Expression
The MTS-insensitive hASBT C270A construct was used as a scaffold for cysteine point mutations as described previously (15, 24), while the wt-ASBT was the template for Ala mutations, as well as N27D and N27Q. Mutants were verified by sequencing and transiently transfected in COS-1 cells as described (14). Protein expression at the cell surface was determined by biotinylation with the membrane impermeable EZ Link NHS-SS-Biotin (Pierce) followed by Western blot as previously described (14) and detailed in the figure legends. An Odyssey imaging system (Licor, NE) was used to visualize protein bands. This approach permits comparative measurement of expression levels for both the glycosylated (41 kDa) and unglycosylated (38 kDa) ASBT protein species, with a custom-designed rabbit polyclonal anti-hASBT antibody (1:1,000) (11). Labeling selectivity to cell surface proteins was confirmed by the absence of a 90 kDa band for the ER protein calnexin (mouse anti-calnexin; Sigma; 1:1,000), and presence of a 140 kDa band for the cell surface marker pan-cadherin (mouse anti-cadherin; 1:1000; Abcam). Blots are representative of two independent experiments.
Substrate Transport and Sodium Activation of TM1 Mutants
Transiently transfected COS-1 cells were incubated at 37 °C for 12 min in Modified Hanks' balanced salt solution (MHBSS), pH 7.4, containing 5.0 μm cold TCA spiked with 1 μCi/ml [3H]TCA. Uptake was halted by washing cells with ice-cold DPBS containing 0.2% fatty acid-free BSA and 0.5 mm TCA. Cells were lysed in 350 μl of 1 n NaOH, and substrate incorporation was measured by liquid scintillation counting, using a LS6500 liquid scintillation counter. Rates of uptake were calculated as pmols of [3H]TCA internalized per min per mg of protein using the Bradford assay for total protein quantification. The influence of sodium on transport function was determined by [3H]TCA uptake under equilibrating (12 mm) versus physiological (137 mm) sodium concentrations, as described previously (14). Choline chloride (ChCl) is used as a replacement for sodium and added to the 12 mm sodium solution to maintain osmolarity. The ratio of uptake at 12 mm Na+ versus 137 mm Na+ was calculated for each mutant transporter and normalized to the C270A control ratio. An uptake ratio equal to one implies minimal participation of that residue during sodium interaction or binding events, while fractions above or below one suggest a putative role during sodium co-transport events.
Substrate and Sodium Kinetics of Select TM1 Mutants
Substrate kinetics were determined for a select group of TM1 cysteine mutants using a wide range of bile acid (0–200 μm TCA) and sodium (0–200 mm NaCl) concentrations as described previously (13). Kinetic parameters were derived by nonlinear regression using GraphPad 5.0 software (San Diego, CA) as described (13).
MTSET Inhibition and Substrate Protection Studies
Transiently transfected COS-1 cells were pretreated with 1 mm MTSET for 10 min at room temperature, and evaluated for [3H]TCA uptake, as previously described (13, 14). Control cells (without MTSET) were treated identically and run in parallel. For each mutant, MTSET inhibition of transport activity was calculated as the ratio of uptake for the MTSET-treated cells versus the control cells. Each ratio was then normalized to the C270A ratio. Additionally, the influence of sodium or the endogenous substrate glycodeoxycholic acid (GDCA; 200 μm) on MTSET (1 mm) labeling rates was evaluated as described (14). Briefly, cells were pretreated with 1 mm MTSET in the absence or presence of GDCA or Na+ for 10 min at room temperature and incubated in MHBSS buffer at 37 °C for 15 min, followed by [3H]TCA uptake as described above. To evaluate the effect of temperature on substrate protection, preincubations with 1 mm MTSET in the absence or presence of GDCA or Na+ were performed for 10 min at room temperature versus 4 °C. Inhibition was determined for each mutant by calculating the ratio of mutant uptake at each experimental condition versus its respective unmodified control. Mutant ratios were then normalized to the C270A ratio calculated in the same manner.
Assessment of Proteasomal or Lysosomal Degradation and hASBT Folding
Transiently transfected COS-1 cells were treated 24–48 h post-transfection with the following inhibitors (final concentrations in antibiotic-free, 10% FBS DMEM, i.e. AB-free DMEM): NH4Cl, leupeptin/pepstatin, MG132, cyclosporine A (CsA), and cholic acid (CA), at concentrations listed in the figure legend. After 8 h (MG132, NH4Cl and leupeptin/pepstatin) or 24 h (CsA and CA), cells were washed twice in ice-cold PBS, lysed and processed as described above, or reagents were replaced with AB-free DMEM for 30 min prior to experiment, followed by biotinylation as described above. Protein concentrations were determined by the Bradford assay, with equal gel protein loading (7 μg/lane), except for G50C samples, which were loaded at a slightly higher concentration (8.5 μg/lane), to permit band visualization. Densitometric analysis later accounted for this difference, because both the loading control cadherin, as well as the protein bands were normalized to the amount loaded per well. This method allowed us to make comparisons of different treatments for the same mutant, as well as between mutants. To ensure that the treatments did not cause cytotoxicity, cell viability was examined with the WST-1 reagent (Roche Applied Sciences) per manufacturer's instructions.
Data Analysis
One-way analysis of variance (ANOVA) with Dunnett's post-hoc test, or the two-tailed unpaired Student's t test was employed when appropriate, using GraphPad 5.0 or Kaleidagraph 4.0. Differences were considered statistically significant (*) at p ≤ 0.05. Bars represent the standard error of the mean (S.E.) for n ≥ 3.
RESULTS
Transport Activity and Membrane Expression of TM1 Cysteine Mutants
Individual cysteine substitutions were incorporated along the TM1 helix (Ile29–Gly50; Fig. 1A) using our previously validated C270A scaffold as the mutagenic template (15, 24). The polar residues Asn27 and Asn28 were included because they are positioned at the putative exofacial membrane-aqueous boundary. Each mutant was transiently transfected in COS-1 cells and evaluated for functional activity and protein cell surface expression. Parallel measurements of total protein levels in whole cell lysates were performed to distinguish between mutants with alterations in protein synthesis or degradation rate versus membrane targeting defects because of cysteine substitution.
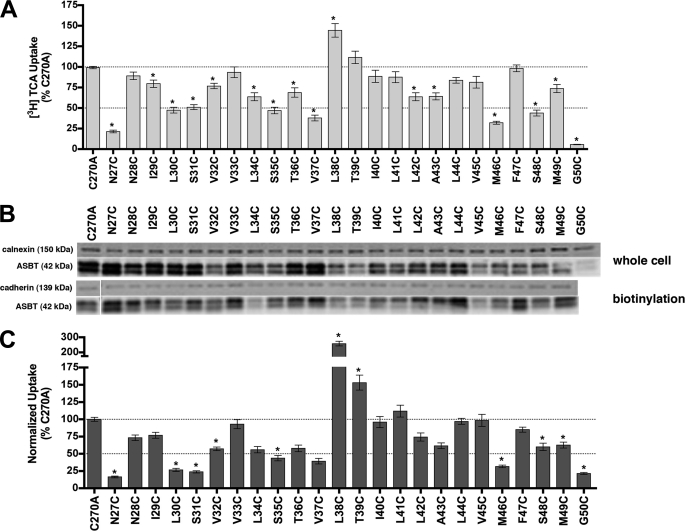
After normalizing uptake rates to membrane expression, the majority of TM1 cysteine mutants (approximately 70%; Fig. 2), demonstrated significantly altered uptake rates for the prototypical substrate taurocholic acid (TCA) compared with C270A control. Activity for mutant G50C was severely diminished (<10% control activity) as was its overall expression, suggesting that mutation caused protein misfolding or instability leading to rapid degradation. The other TM1 cysteine mutants demonstrated measurable expression levels both in whole cell lysate fractions as well as at the cell surface (Fig. 2). Interestingly, N27C had ∼20% residual transport activity whereas neighboring N28C remained largely unaffected. In contrast, mutant L38C exhibited increased uptake rates.
FIGURE 2.
[3H]TCA uptake and protein expression of TM1 cysteine mutants. A, COS-1 cells were transfected with C270A or mutant plasmids as described under “Experimental Procedures.” Rates of uptake were expressed as a percentage of the parental transporter, C270A, in pmol [3H]TCA internalized per minute per milligram of protein. Bars represent the S.E. of three independent experiments, each performed in triplicate. ANOVA with p < 0.05 (*) indicates significant mean differences. B, total (whole cell) and cell surface (biotinylation) protein expression of Cys mutants. Equal amounts of protein (7 μg/lane) were loaded on a 12.5% denaturing polyacrylamide gel, and hASBT protein was identified using a custom anti-hASBT antibody (1:1,000). Labeling selectivity to cell surface proteins was confirmed by the absence of a 90 kDa band for the ER protein calnexin (mouse anti-calnexin; 1:1,000), and presence of a 140 kDa band for the cell surface marker pan-cadherin (mouse anti-cadherin; 1:1,000). Mature glycosylated hASBT visualizes as the 41 kDa band while the lower, 38 kDa band (not indicated) represents the unglycosylated species. Blots are representative of two independent experiments. C, rate of uptake expressed as a percentage of the parental transporter, C270A, normalized to ASBT cell surface expression (from B, lower panel). Because levels of glycosylated (41 kDa) and unglycosylated (38 kDa) protein were tightly correlated, only glycosylated protein bands were considered for densitometric analysis.
Sodium Activation
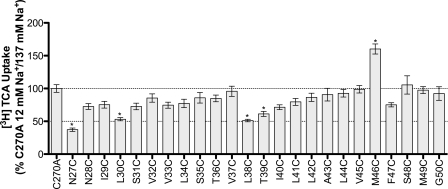
ASBT actively concentrates bile acids within the cell interior by harnessing energy from the inward sodium gradient (25). To investigate the involvement of TM1 in sodium translocation, we assayed each mutant for TCA transport at physiological and equilibrating extracellular [Na+] (12 mm), i.e. [Na+]out ≈ [Na+]in. Theoretically, this strategy can identify residues that are sensitive to extracellular levels of sodium and that may participate, either directly or indirectly, during sodium transport steps. For each mutant, we calculated the ratio of transport at 12 mm versus 137 mm [Na+] and then normalized values to the C270A ratio. Our previous studies confirm minimal sodium sensitivity of the C270A parental template under equilibrative extracellular Na+ conditions (15). N27C, L30C, L38C, T39C, and M46C demonstrated significant differences in sodium sensitivity (Fig. 3 and Table 1) compared with C270A control.
FIGURE 3.
[3H]TCA uptake ratio under equilibrating (12 mm) versus saturating (137 mm) sodium concentrations. Uptake of 5 μm TCA (spiked with [3H]TCA) in COS-1 cells transfected with C270A or mutant plasmid, in pmol [3H]TCA internalized per minute per milligram of protein, calculated as the ratio of uptake at 12 mm/137 mm sodium concentrations, and further normalized as a percentage of the parental C270A ratio. Bars represent the S.E. of three independent experiments, each performed in triplicates. ANOVA with p < 0.05 (*) indicate significant mean differences.
TABLE 1.
Substrate kinetic parameters for select TM1 cysteine mutants
COS-1 cells transiently transfected as described under “Experimental Procedures.” Uptake measured at substrate concentrations ranging from 0–200 μm for TCA, or 0–200 mm for NaCl (measured in triplicate). Kinetic data was analyzed using Graphpad Prism software, with constants determined via nonlinear regression, and one-way ANOVA for significance.
| Na+ kinetics |
TCA kinetics |
|||
|---|---|---|---|---|
| Jmax | KNa | Jmax | KTCA | |
| pmol/min/mg protein | mm | pmol/min/mg protein | μm | |
| C270A | 380.3 ± 16.8 | 8.9 ± 1.6 | 892.8 ± 57.7 | 9.7 ± 2.4 |
| N27Cab | 934 ± 8.2 | 34.0 ± 8.3e | 312.5 ± 28.7 | 21.5 ± 6.2 |
| N28C | 347.7 ± 25.1 | 5.5 ± 2.0 | 1469.0 ± 55.6 | 17.7 ± 2.2 |
| L30Cabc | 198.1 ± 8.2 | 19.5 ± 2.6e | 1047.0 ± 183.5 | 59.8 ± 25.0e |
| L34Cacd | 178.4 ± 6.9 | 7.5 ± 1.2 | 592.7 ± 23.3 | 11.6 ± 1.7 |
| S35Cac | 270.3 ± 9.4 | 11.3 ± 1.5 | 389.5 ± 35.6 | 5.7 ± 2.6 |
| T36Cacd | 336.5 ± 16.7 | 9.9 ± 1.9 | 801.8 ± 37.1 | 8.6 ± 1.6 |
| L38Cbcd | 716.6 ± 54.7 | 24.1 ± 5.6e | 1507.0 ± 32.2e | 10.6 ± 0.9 |
| T39Cbc | 406.9 ± 17.5 | 16.4 ± 2.4e | 553.5 ± 70.0 | 6.3 ± 3.6 |
| M46Cab | 164.2 ± 8.4 | 1.3 ± 0.8e | 239.2 ± 25.2 | 8.4 ± 3.3 |
| F47C | 297.6 ± 13.0 | 12.8 ± 2.0 | 453.8 ± 64.6 | 6.5 ± 4.0 |
a Decreased uptake due to mutation.
b Sodium sensitive.
c MTSET inhibition.
d Substrate protection.
e Parameters significantly different from the C270A control are indicated, *p ≤ 0.05.
Solvent Accessibility of Cysteine Mutants
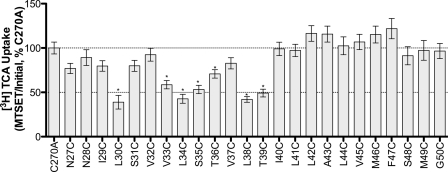
Membrane-impermeant MTSET is highly selective for ionized sulfhydryl groups, which predominantly occur on Cys residues exposed to an aqueous environment (26, 27). Thus, preincubation with MTSET followed by evaluation of functional activity can theoretically identify residues that lie within binding pockets or translocation pathways. Our data reveal significant decreases in functional activity upon MTSET treatment for mutants L30C, V33C, L34C, S35C, L38C, and T39C (Fig. 4). These sites are situated predominantly along the exofacial half of the helix. Interestingly, L30C, L34C, and L38C are most affected by MTSET modification and roughly display α-helical periodicity. While we expect inhibition of [3H]TCA uptake for residues that line an aqueous substrate permeation pathway, functionally silent modifications may occur that cannot be identified under these experimental conditions.
FIGURE 4.
MTSET labeling of TM1 mutants. Transiently transfected COS-1 cells were preincubated with 1 mm MTSET for 10 min, at room temperature, followed by washes, and [3H]TCA uptake. The ratio of uptake in presence versus absence of MTSET (i.e. MTSET/Initial rates of uptake) was expressed as a percentage of MTSET/Initial ratio of the parental C270A. Bars represent the S.E. of three independent experiments, each performed in triplicates. ANOVA with p < 0.05 (*) indicate significant mean differences.
Substrate Protection Assays
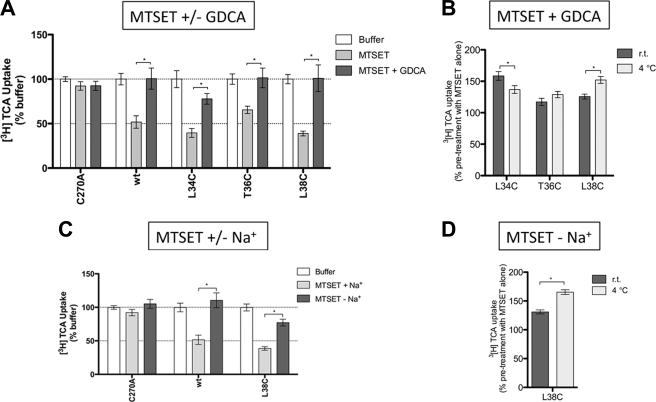
To determine whether ASBT substrates interact with solvent accessible residues identified above, MTSET was co-incubated with glycodeoxycholic acid (GDCA, Km ∼2.0 μm). “Substrate protection” afforded under these conditions was calculated as a percentage of the uptake under untreated conditions. Only residues affected under these conditions are shown (Fig. 5). Native wt-ASBT protein was included as a positive control, because it displays significant substrate protection from MTSET modification in presence of GDCA (Fig. 5A). Substrate protection was observed only for mutants L34C, T36C, and L38C (Fig. 5A); complete restoration of transport activity suggests that these residues may interact with bile acid directly or modulate translocation steps.
FIGURE 5.
Effect of GDCA or sodium on uptake recovery from MTSET modification. Transiently transfected COS-1 cells were preincubated with buffer alone or 1 mm MTSET ± GDCA or ± Na+, for 10 min, followed by washes, 15 min of incubation in buffer alone, and [3H]TCA uptake. A, MTSET ± 200 μm GDCA. For each mutant, results were expressed as a percentage of the uptake in buffer alone (Initial rates of uptake). B, effect of temperature on GDCA protection from MTSET labeling. Preincubation with MTSET + GDCA at room temperature versus 4 °C for 10 min. For each mutant, results were expressed as a percentage of the uptake after preincubation in MTSET alone. C, MTSET ± Na+. ChCl was used an equimolar replacement for NaCl. For each mutant, results were expressed as a percentage of the uptake in buffer alone (Initial rates of uptake). D, effect of temperature on sodium protection from MTSET labeling. MTSET-Na+ at room temperature versus 4 °C for 10 min. For each mutant, results were expressed as a percentage of the uptake after preincubation in MTSET alone. Bars represent the S.E. of three independent experiments, each performed in triplicates. Student's t test of significant mean differences with p < 0.05 (*) are indicated.
In addition to bile acid, binding of sodium may alter protein conformation to occlude previously accessible sites or reveal previously inaccessible residues. MTSET pretreatment in the absence of sodium significantly protected L38C against MTSET modification (Fig. 5B) compared with parallel experiments in the presence of sodium. These data suggest that accessibility for this residue is altered by sodium interaction events. Combined, both bile acid and sodium binding modulate solvent accessibility for Leu38.
To discriminate between direct and indirect occlusion of L34C, T36C, and L38C by sodium and bile acid, we determined the temperature-dependence of substrate protection for these mutants. While MTSET access to a residue should not vary with temperature, residues located at conformationally sensitive regions will exhibit different protection patterns at 4 °C, where molecular motions are expected to be slower. GDCA prevents MTSET access to L34C and L38C, but not to T36C, in a temperature-dependent fashion (Fig. 5), whereas protection increases at low temperatures for L38C. These results suggest that L34C is placed in a region sensitive to conformational changes caused by bile acid, but not sodium, translocation. GDCA protection for T36C was independent of temperature, suggesting that T36C is not governed by dynamic changes in protein conformation. Instead, it is possible that T36C is located near the bile acid binding pocket or translocation pathway. L38C may be placed in a flexible region of TM1 modulated by translocation of both sodium and bile acid. Interestingly, GDCA protection at 4 °C decreases for L34C and increases for L38C, which tempts speculation that Leu34 and Leu38 sense distinct, possibly opposite forces during bile acid translocation, alternating solvent accessibility.
Kinetic Analysis of Select TM1 Mutants
To further analyze the role of TM1 residues affected above, we performed kinetic evaluation on a subset of mutants affording their Michaelis-Menten-like constant (KT). N27C, L30C, L38C, T39C, and M46C exhibited significantly altered sodium affinity (KNa), whereas only L30C concomitantly displayed significant changes in substrate affinity (KT) (Table 1). Mutation at Leu38 significantly increases Jmax without affecting KT. Despite significant solvent accessibility and substrate protection, mutants L34C and T36C had analogous KT and KNa values compared with C270A control, consistent with placement of these residues within solvent accessible pockets that are indirectly modulated by substrate binding and translocation, e.g. via global changes in protein conformation.
Analysis of Select TM1 Mutants against wt-ASBT Background
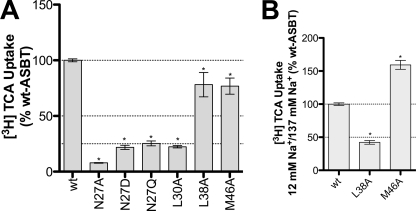
The results above for C270A scaffold mutants prompted us to further investigate functional relevance of these residues in wt-hASBT. Accordingly, we generated N27A, L30A, L38A, and M46A on the wt-hASBT background, and assessed mutant function by [3H]TCA uptake (Fig. 6A). T39A could not be generated. We evaluated the impact of side chain size and charge for Asn27, via additional N27D and N27Q mutants. All Asn27 mutants had minimal activity compared with the wt-ASBT control, underscoring the specific need of an asparagine in this position. Approximately 25% activity was observed for L30A. L38A, and M46A showed about 80% of wt-ASBT activity, and were further inspected for their sodium sensitivity. Consistent with the previous results L38C/C270A and M46C/C270A double mutants, sodium sensitivity for L38A increased while M46A was less sensitive compared with wt-ASBT control. These results support a central role for Leu38 and Met46 during sodium translocation events.
FIGURE 6.
Effect of mutation on wt-hASBT function and sodium dependence of select mutants. A, [3H]TCA uptake of COS-1 cells transfected with the wt-ASBT or mutant proteins. Rates of uptake were expressed as a percentage of the parental transporter, wt-ASBT, in pmol [3H]TCA internalized per minute per milligram of protein. Bars represent the S.E. of two independent experiments, each performed in triplicates. ANOVA with p < 0.05 (*) indicate significant mean differences. B, ratios of [3H]TCA uptake under equilibrating (12 mm) versus saturating (137 mm) sodium concentrations. Uptake levels in COS-1 cells transfected with wt-ASBT or mutant plasmid, in pmoles [3H]TCA internalized per minute per milligram of protein, calculated as the ratio of 12 mm/137 mm sodium concentrations, and further normalized as a percentage of the parental wt-ASBT sensitivity (12 mm/137 mm). Bars represent the S.E. of two independent experiments, each performed in triplicates. ANOVA with p < 0.05 (*) indicates significant mean differences.
Residue Gly50 Is Critical for ASBT Folding
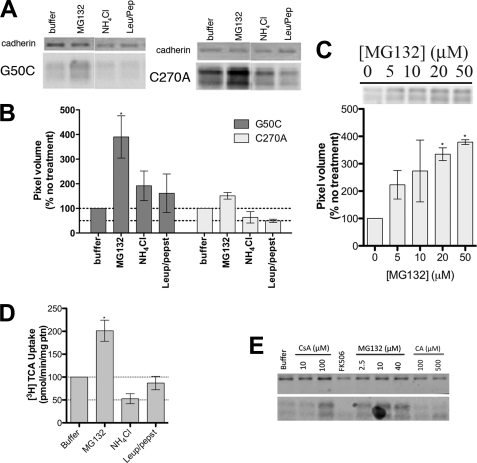
Total protein expression of G50C is dramatically decreased (Fig. 2B). Because [3H]TCA transport could be measured, this suggests that mutation at Gly50 produces a functional transporter. Based on these observations, we hypothesized that mutation resulted in rapid protein degradation via either proteasomal or lysosomal pathways. Treatment with increasing concentrations of proteasomal inhibitor MG132 (28) resulted in a dose-dependent increase in G50C protein levels in cell lysates (Fig. 7C), confirming that proteasomal degradation constitutes a major degradation pathway for this mutant. Treatment with MG132 also resulted in increased G50C uptake compared with untreated cells (buffer only) (Fig. 7D). Most notably, MG132 treatment led to increased transport function (Fig. 7D) and cell surface expression (Fig. 7E) of G50C. Treatment with lysosomal pathway inhibitors NH4Cl and leupeptin/pepstatin (28) did not significantly affect G50C protein expression, thus suggesting minimal lysosomal degradation of mutant and control proteins (Fig. 7, A, B, and D). The ubiquitin-proteasome system (UPS) plays a crucial role in endoplasmic reticulum (ER) quality control by eliminating defective proteins from the cell. We hypothesized that mutations at Gly50 caused folding abnormalities that culminate in the mutant's rapid degradation by the UPS. “Substrate-assisted folding” may rescue protein levels when substrate is present during protein folding by interacting with the active site, and stabilize its conformation, thereby aiding the mutant protein in passing ER quality control (29). We chose the hASBT substrate cholic acid (CA); its relatively high lipophilicity would facilitate permeation through the plasma membrane to reach the ER. However, treatment with CA (Fig. 7E) did not significantly restore G50C protein levels. Other common ASBT substrates, such as CDCA and LCA, rendered identical results (data not shown).
FIGURE 7.
Mechanism of G50C instability. COS-1 cells transiently transfected with C270A or G50C were treated with appropriate reagents for specified amounts of time. For the protein expression experiments, equal amounts of protein were loaded on a 12.5% Tris. HCl polyacrylamide gel (7 μg/lane for C270A and 8.5 μg/lane for G50C). Protein bands were visualized with the primary antibodies rabbit anti-hASBT (1:1,000) and mouse anti-cadherin (1:1,000), and the secondary antibodies anti-mouse IRDye 680 (1:10,000) and anti-rabbit DyLight 800 (1:10,000). Blots are representative of two independent experiments. A, effect of degradation inhibitors on G50C expression. Cells were treated with 20 μm MG132, 15 mm NH4Cl, and leupepsin/pepstatin (100 μg/ml of each). After 8 h, which corresponds to the ASBT protein degradation half-life as determined after cyclohexamine treatment (data not shown), cells were harvested and submitted to Western blotting. B, densitometric analysis of the Western blot bands, normalized to loading amounts and the loading control cadherin. Bars represent the S.E. of two independent experiments, relative to untreated control. C, dose-dependent inhibition of G50C proteasomal degradation with MG132 and densitometric analysis of Western blot bands. Cells were treated with various MG132 concentrations (5–50 μm) for 8 h, after which cells were harvested and submitted to Western blot. Denstitometric analysis included normalization to loading amounts and the loading control cadherin. Bars represent the S.E. of two independent experiments, relative to untreated control. D, [3H]TCA uptake of G50C treated with degradation inhibitors. Transfected COS-1 cells were treated with the appropriate reagents (20 μm MG132, 15 mm NH4Cl, and leupepsin/pepstatin 100 μg/ml of each) for 8 h, followed by TCA uptake as described under “Experimental Procedures.” Rates of uptake were expressed as a percentage of untreated control (buffer), normalized for negative control (mock), in pmol of [3H]TCA internalized per minute per milligram of protein. Bars represent the S.E. of two independent experiments, each performed in triplicate. E, G50C cell surface expression after treatment with degradation inhibitors/chaperones. Cells were treated with CsA (10 and 100 μm), FK506 (100 μm), and CA (100 and 500 μm) for 24 h and MG132 (2.5, 10, and 40 μm) for 8 h followed by biotinylation of cell surface proteins as described under “Experimental Procedures.”
Cis-trans isomerization of proline-linked peptide bonds is a rate-limiting step in protein folding, catalyzed by peptidyl-prolyl isomerases (PPIs) including cyclophilin A (CyPA) and FK506-binding protein (FKBP) (30, 31). PPI inhibition will likely affect protein levels and potentially reveal the mechanism involved in protein (mis)folding of PPI substrates. We employed the CyPA inhibitor cyclosporine A (CsA) and the FKBP inhibitor FK506, to evaluate the effect of PPI inhibition on G50C levels (Fig. 7E). Treatment with 100 μm CsA, but not FK506, clearly increased G50C levels at the cell surface, suggesting a specific role for CyPA on G50C stability, and a possible role for Gly50 in ASBT folding.
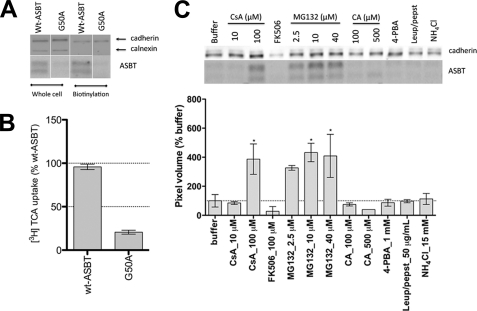
To confirm that the observed effects were not specific to the G50C mutant, we constructed a wt-G50A mutant. Similarly to G50C, G50A displayed negligible protein levels, both in whole cell lysate and in biotinylated samples (Fig. 8A), as well as low [3H]TCA transport (Fig. 8B). While the lysosomal inhibitors leupeptin/pepstatin and NH4Cl failed to rescue G50A surface expression levels, MG132 increased protein surface expression in a dose-dependent fashion, thus confirming the major role of the proteasome in G50A degradation. Treatment with 100 μm CsA, but not FK506, recovered cell-surface-resident G50A, thus corroborating the G50C data. The chemical chaperone 4-PBA did not rescue G50A expression (Fig. 8C), but 4-PBA activity may be highly mutant specific (32, 33). Taken together, our data suggest that mutation at Gly50 produces a functionally intact transporter that undergoes accelerated degradation by the proteasome, partly due to folding defects induced by cyclophilin A.
FIGURE 8.
Mechanism of G50A instability. A, G50A total (whole cell) and cell surface (biotinylation) expression. COS-1 cells transfected with G50A or wt-ASBT were biotinylated 24–48 h post-transfection. Cells were lysed, and total protein content was determined with the Bradford assay, after which protein concentrations were equalized, a small aliquot was separated for total protein measurements, from which 7 μg/lane of wt-ASBT samples and 8.5 μg/lane of G50A were loaded onto a 12.5% denaturing polyacrylamide gel. Streptavidin beads were added to the remaining lysate, and samples prepared in reducing buffer were loaded on the gel, with G50A always loaded on the same gel as the wt-ASBT control for the corresponding experiment (whole cell or biotinylation). Blots are representative of two independent experiments. B, [3H]TCA uptake of COS-1 cells transfected with G50A or the wt-ASBT control. Rates of uptake were expressed as a percentage of the parental transporter, wt-ASBT, in pmol of [3H]TCA internalized per minute per milligram of protein. Bars represent the S.E. of at least three independent experiments, each performed in triplicates. ANOVA with p < 0.05 (*) indicate significant mean differences. C, G50A cell surface expression after treatment with inhibitors, substrates, or chaperones. Cells were treated with CsA (10 and 100 μm), FK506 (100 μm), CA (100 and 500 μm), and 4-PBA (1 mm) for 24 h and MG132 (2.5, 10, and 40 μm), leupepsin/pepstatin (50 μg/ml) NH4Cl (15 mm) for 8 h followed by biotinylation of cell surface proteins as described above. Below the protein bands is the densitometric analysis normalized to the loading control cadherin. Bars represent the S.E. of two independent experiments, relative to untreated control. ANOVA with p < 0.05 (*) indicates significant mean differences.
DISCUSSION
We determined the contributions of TM1 residues during substrate turnover and degradation processes of the bile acid transporter, SLC10A2. We show that the TM1 helix comprises a moderately solvent-accessible membrane-spanning domain, with accessible sites discretely spaced along one side of the exofacial half of the helix (Fig. 7A). TM1 likely plays a role in both sodium and bile acid handling, as suggested by kinetic evaluation of select mutants (Table 1) and substrate protection studies in which bile acid and/or sodium influences MTSET modification rates (Figs. 4 and 5). Furthermore, an intriguing role for Gly50 is suggested during folding of the native transporter, because both G50A and G50C mutants demonstrate accelerated degradation, likely because of improper folding.
Cysteine-scanning mutagenesis of the TM1 helix and its two adjacent Asn residues demonstrates that ∼70% of mutants were significantly affected by Cys mutation relative to C270A control (Fig. 2A). However, compared with our previous analysis of TM7 (15), which exhibited severe intolerance to mutation, TM1 mutants are moderately functional. Of note are residues Asn27 and Gly50, which were severely hampered (≤20% residual activity) by mutation. Loss of function for the G50C mutant was directly linked to a substantial increase in protein degradation, both within whole cell lysates and at the plasma membrane. In contrast, expression of the N27C mutant at the cell surface was not affected, suggesting a role for this residue in substrate interaction events.
We next examined the effects on transport of removing the electromotive force of the sodium gradient. Transport function for each mutant was evaluated at equilibrating extracellular sodium concentrations (i.e. [Na+]out ∼ [Na+]in) and found that five mutants (N27C, L30C, L38C, T39C, M46C) were affected by altered [Na+] (Fig. 3). Subsequent kinetic evaluation corroborated a significant change in sodium affinity (KNa) (Table 1). Bile acid affinity (KT) was unaltered for these residues (except L30C), signifying their involvement during sodium binding events. In contrast, equilibrative [Na+] resulted in increased transport function for M46C (Fig. 3), suggesting that loss of the sodium gradient restored M46C function. Subsequent kinetic analysis of M46C revealed a significantly higher affinity for sodium (KNa) but not for bile acid, which validates the proposed role of M46C in sodium binding events. This decrease in sodium sensitivity was reproducible for the M46A mutant generated on the wt-ASBT background (Fig. 6). Similar results were observed for Leu38 mutants L38C and L38A. Because both Leu38 and Met46 are uncharged residues, but nonetheless appear to affect sodium transport, we posit that these residues may form part of a highly sodium sensitive region that cooperates to modulate sodium permeability.
Our next set of functional studies exploited the thiol reactivity of cysteine groups introduced along the TM1 helix, and measured transport inhibition upon preincubation with MTSET reagent. Significant inhibition of TCA transport was observed predominantly for residues lining the exofacial half of the TM1 helix (Fig. 4), specifically Leu30–Thr39. The inhibition pattern of these residues forms a roughly α-helical pattern, especially Leu residues (Leu30, Leu34, Leu38) flanked by hydrophilic amino acids (S/T); further, discrete partitioning is observed toward one face of the TM1 helix when mapped to a helical wheel representation (Fig. 9A). Kinetic analysis supports sodium and bile acid interactions for Leu30 and sodium interactions for Asn27, Leu38, Thr39, and Met46 (Table 1). Subsequently, substrate protection studies were conducted to determine whether the presence of bile acids or removal of sodium ions imparted conformational changes that would influence MTSET accessibility to these residues (Fig. 5). Significant protection from MTSET alkylation by bile acids was observed for mutants L34C, T36C, and L38C, while removal of sodium during MTSET preincubation only restored transport function for L38C. GDCA protection from MTSET labeling was clearly temperature dependent for L34C and L38C. For the latter, protection in the absence of sodium was also temperature-dependent. These results are consistent with conformational changes governing MTSET access to the aforementioned residues, and support the hypothesis that Leu38 is located in a flexible and dynamic region of the protein, sensing both sodium and bile acid translocation.
FIGURE 9.
In silico representation of residues relevant for sodium transport. A, helical wheel representation of TM1 as viewed from the exofacial side of the plasma membrane (Lasergene 6.0; DNAstar, Inc., Madison, WI). Amino acids are represented by their single-letter codes and corresponding placement within the protein. B, solvent accessibility analysis of hASBT. The grid method within SiteID (Sybyl-X, Tripos Associates, St. Louis, MO) was used to determine accessible regions of a previously developed homology model of hASBT protein (11). Major clusters are visualized by colored spheres. For clarity, only clusters surrounding TM1–3 and TM6–7 were visualized. C, proposed model for stabilizing amino-aromatic/cation-π interactions in ASBT: Phe287 (magenta) is sandwiched between Na+ (yellow), and the Asn27 amide proton. The white VDW representation highlights sodium-sensitive residues Ile103 and Gly104, in EL1, as well as Val127 in TM3. The dotted line represents the 2 Å distance between the Asp27 proton and the centroid of the Phe287 aromatic ring. Figure was generated using VMD 1.8.6 software.
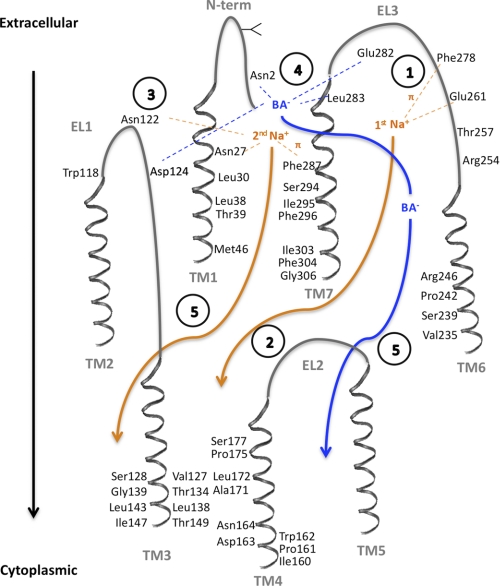
Our ASBT homology model (11) predicts proximity of Asn27 to the highly solvent accessible exofacial half of TM7 (Fig. 9, B and C), particularly Phe287 and Thr288 which are both located in the vicinity of a structural anchor comprising residues Phe289, Tyr293, Asp297, Ala301, Phe307, and Tyr308 (15). Because neither conservative nor non-conservative mutations of Asn27 restored activity (Fig. 6A), we conclude that this residue is essential at this particular position, perhaps by forming cation-π point interactions with Phe287 and Na+ to stabilize an optimal three-dimensional conformation required for ASBT function (Fig. 9C). Because cation-π interactions can accept a third electron-deficient group (34) and our model indicates that Asp27 and Phe287 are located in the vicinity of Ile103, Gly104, Thr110, Leu115, Ala116, and Val119 in EL1 (13), and Val127 and Ser128 in TM3 (14), all of which are sodium sensitive, we propose an arrangement where Phe287 is sandwiched between the Asn27 amide proton and the sodium ion (Fig. 9C), which may serve to stabilize conformations that promote bile acid transport. Integrating the present data with those of our previous studies, we present a schematic overview of the ASBT transport cycle in Fig. 10.
FIGURE 10.
Putative ASBT transport cycle. The proposed mechanism was based on the established 7 transmembrane domain topology (11) and putative 2:1 sodium:substrate stoichiometry (25), as well as current and previous publications. Direct interaction of sodium (orange) or bile acid (blue) with amino acid residues is denoted as dotted lines, while translocation through reputed substrate pathways is shown as full arrows. Transmembrane domains (TM1–7) and extracellular loops (EL1–3) are shown in gray, and amino acid residues involved in substrate interactions, or that line the substrate pathway, are visualized. Intracellular loops are omitted for clarity. Circled numbers describe each proposed step: (1) Stabilization of the 1st Na+ ion within EL3 via the negatively charged sodium sensor Glu261 (16, 19, 20) and cation-π forces with the Phe278 aromatic ring (16); (2) Na+ binding triggers conformational changes that will facilitate its own permeation, and (3) simultaneously favor binding of the sodium sensor Asn122 (19, 20) to the 2nd Na+ ion, which is further stabilized by amino-aromatic/cation- π interactions with Phe287 and the amide proton in Asn27. (4) Structural changes induced by binding/stabilization of the 2nd Na+ will render the binding pocket formed by Glu282, Leu283, and Asn2 (11), and possibly Asp124, available to interact with the bile acid (BA−), leading to coupled Na+ and BA− translocation through translocation pathways in TM1 (current work), TM6 (12) and TM7 (15), and exit into the cytoplasm through TM3 (14, 17) and TM4 (18) (5). Involvement of TM2 and TM5 in substrate/ion binding or translocation remains to be investigated.
Finally, we report accelerated hASBT degradation rates upon mutation of highly conserved Gly50 and conclude that this residue may be critical for hASBT folding (Figs. 7 and 8). We demonstrate that mutations at Gly50 produced functionally intact proteins, and that G50A and G50C expression could be rescued by the proteasomal degradation inhibitor MG132 but not by lysosomal inhibitors. Moreover, G50A (Fig. 8C) and G50C (Fig. 7E) proteins that escaped from the ER (because of MG132 treatment) could be properly inserted into the plasma membrane. Data with CsA and FK506 support a partial role for Gly50 on cis-trans isomerization of hASBT prolines by CyPA, but not FKBP. The definitive mechanism involved in CsA rescue of G50A and G50C expression is presently unclear. CyPA does not require a specific recognition motif in its substrates to execute its proline isomerization activity (35). We speculate that Gly50 resides next to a critical hASBT region for CyPA recognition, and mutation at this residue may affect the final catalysis product, potentially leading to excessive protein isomerization and improper folding.
In summary, we demonstrate that the TM1 helix is important for both sodium and bile acid transport events, with residues situated along the exofacial helix likely participating during substrate permeation. Residues Asn27, Leu30, Leu38, Thr39, and Met46 play a crucial role in sodium affinity, while only residue Leu30 appears to be essential for bile acid affinity. We also report an intriguingly and possibly regulatory role of Gly50 on hASBT folding. Overall, these data in combination with our previous studies reveal interactions at the molecular level of ASBT that provide a deeper insight into its functional transport cycle (Fig. 10).
Acknowledgments
We thank Drs. C. S. Raman and Sudha Veeraraghavan (University of Maryland) for insightful discussions about protein folding and repair. We thank Drs. Yongmei Pan, Sairam Mallajosyula, and Elisabeth Denning for assistance with Sybyl and VMD and Ronald Kasl for system administration. Furthermore, Dr. Robyn Moore's assistance was greatly appreciated with the immunoblotting techniques.
This work was supported, in whole or in part, by Grants NIDDK DK061425 (to P. W. S.) and DK067530 (to J. E. P.) from the National Institutes of Health.
- ASBT
- apical sodium-dependent bile acid transporter
- ChCl
- choline chloride
- CsA
- cyclosporine A
- EL
- extracellular loop
- GDCA
- glycodeoxycholic acid
- MTS
- methanethiosulfonate
- MTSET
- [2-(trimethylammonium) ethyl]-methane-thiosulfonate
- NTCP
- sodium aurocholate cotransporting polypeptide
- 4-PBA
- 4-phenylbutyric acid
- SCAM
- substituted cysteine accessibility method
- TCA
- taurocholic acid
- TM
- transmembrane.
REFERENCES
- 1. Dawson P. A., Lan T., Rao A. (2009) J. Lipid Res. 50, 2340–2357 [DOI] [PMC free article] [PubMed] [Google Scholar]
- 2. Bergheim I., Harsch S., Mueller O., Schimmel S., Fritz P., Stange E. F. (2006) J. Lipid Res. 47, 42–50 [DOI] [PubMed] [Google Scholar]
- 3. Hofmann A. F. (1999) News Physiol. Sci. 14, 24–29 [DOI] [PubMed] [Google Scholar]
- 4. Kosters A., Karpen S. J. (2008) Xenobiotica 38, 1043–1071 [DOI] [PMC free article] [PubMed] [Google Scholar]
- 5. Kågedahl M., Swaan P. W., Redemann C. T., Tang M., Craik C. S., Szoka F. C., Jr., Oie S. (1997) Pharm. Res. 14, 176–180 [DOI] [PubMed] [Google Scholar]
- 6. Balakrishnan A., Polli J. E. (2006) Mol. Pharm. 3, 223–230 [DOI] [PMC free article] [PubMed] [Google Scholar]
- 7. Tolle-Sander S., Lentz K. A., Maeda D. Y., Coop A., Polli J. E. (2004) Mol. Pharm. 1, 40–48 [DOI] [PubMed] [Google Scholar]
- 8. Huff M. W., Telford D. E., Edwards J. Y., Burnett J. R., Barrett P. H., Rapp S. R., Napawan N., Keller B. T. (2002) Arterioscler. Thromb Vasc Biol. 22, 1884–1891 [DOI] [PubMed] [Google Scholar]
- 9. Kitayama K., Nakai D., Kono K., van der Hoop A. G., Kurata H., de Wit E. C., Cohen L. H., Inaba T., Kohama T. (2006) Eur. J. Pharmacol. 539, 89–98 [DOI] [PubMed] [Google Scholar]
- 10. Banerjee A., Swaan P. W. (2006) Biochemistry 45, 943–953 [DOI] [PMC free article] [PubMed] [Google Scholar]
- 11. Zhang E. Y., Phelps M. A., Banerjee A., Khantwal C. M., Chang C., Helsper F., Swaan P. W. (2004) Biochemistry 43, 11380–11392 [DOI] [PubMed] [Google Scholar]
- 12. Hussainzada N., Khandewal A., Swaan P. W. (2008) Mol. Pharmacol. 73, 305–313 [DOI] [PMC free article] [PubMed] [Google Scholar]
- 13. Hussainzada N., Claro Da Silva T., Zhang E. Y., Swaan P. W. (2008) J. Biol. Chem. 283, 20653–20663 [DOI] [PMC free article] [PubMed] [Google Scholar]
- 14. Hussainzada N., Claro Da Silva T., Swaan P. W. (2009) Biochemistry 48, 8528–8539 [DOI] [PMC free article] [PubMed] [Google Scholar]
- 15. Hussainzada N., Banerjee A., Swaan P. W. (2006) Mol. Pharmacol. 70, 1565–1574 [DOI] [PubMed] [Google Scholar]
- 16. Banerjee A., Hussainzada N., Khandelwal A., Swaan P. W. (2008) Biochem. J. 410, 391–400 [DOI] [PubMed] [Google Scholar]
- 17. Combet C., Blanchet C., Geourjon C., Deléage G. (2000) Trends. Biochem. Sci. 25, 147–150 [DOI] [PubMed] [Google Scholar]
- 18. Khantwal C. M., Swaan P. W. (2008) Biochemistry 47, 3606–3614 [DOI] [PubMed] [Google Scholar]
- 19. Ray A., Banerjee A., Chang C., Khantwal C. M., Swaan P. W. (2006) Bioorg. Med. Chem. Lett. 16, 1473–1476 [DOI] [PubMed] [Google Scholar]
- 20. Sun A. Q., Balasubramaniyan N., Chen H., Shahid M., Suchy F. J. (2006) J. Biol. Chem. 281, 16410–16418 [DOI] [PubMed] [Google Scholar]
- 21. Saeki T., Mizushima S., Ueda K., Iwami K., Kanamoto R. (2009) Biosci. Biotechnol. Biochem. 73, 1535–1540 [DOI] [PubMed] [Google Scholar]
- 22. Geyer J., Wilke T., Petzinger E. (2006) Naunyn. Schmiedebergs. Arch. Pharmacol. 372, 413–431 [DOI] [PubMed] [Google Scholar]
- 23. Hagenbuch B., Dawson P. (2004) Pflugers. Arch. 447, 566–570 [DOI] [PubMed] [Google Scholar]
- 24. Banerjee A., Ray A., Chang C., Swaan P. W. (2005) Biochemistry 44, 8908–8917 [DOI] [PubMed] [Google Scholar]
- 25. Weinman S. A., Carruth M. W., Dawson P. A. (1998) J. Biol. Chem. 273, 34691–34695 [DOI] [PubMed] [Google Scholar]
- 26. Absalom N. L., Schofield P. R., Lewis T. M. (2009) Neurochem. Res. 34, 1805–1815 [DOI] [PubMed] [Google Scholar]
- 27. Karlin A., Akabas M. H. (1998) Methods Enzymol. 293, 123–145 [DOI] [PubMed] [Google Scholar]
- 28. Jones H. M., Hamilton K. L., Papworth G. D., Syme C. A., Watkins S. C., Bradbury N. A., Devor D. C. (2004) J. Biol. Chem. 279, 15531–15540 [DOI] [PubMed] [Google Scholar]
- 29. Perlmutter D. H. (2002) Pediatr. Res. 52, 832–836 [DOI] [PubMed] [Google Scholar]
- 30. Steinmann B., Bruckner P., Superti-Furga A. (1991) J. Biol. Chem. 266, 1299–1303 [PubMed] [Google Scholar]
- 31. Xu C., Zhang J., Huang X., Sun J., Xu Y., Tang Y., Wu J., Shi Y., Huang Q., Zhang Q. (2006) J. Biol. Chem. 281, 15900–15908 [DOI] [PubMed] [Google Scholar]
- 32. van den Berghe P. V., Stapelbroek J. M., Krieger E., de Bie P., van de Graaf S. F., de Groot R. E., van Beurden E., Spijker E., Houwen R. H., Berger R., Klomp L. W. (2009) Hepatology 50, 1783–1795 [DOI] [PubMed] [Google Scholar]
- 33. Zhang Q., Wu J., Pan Z., You G. (2011) Int. J. Biochem. Mol. Biol. 2, 31–38 [PMC free article] [PubMed] [Google Scholar]
- 34. Tüchsen E., Woodward C. (1987) Biochemistry 26, 1918–1925 [DOI] [PubMed] [Google Scholar]
- 35. Ivery M. T. (2000) Med. Res. Rev. 20, 452–484 [DOI] [PubMed] [Google Scholar]


