Abstract
Lysyl oxidase (LOX), a matrix cross-linking protein, is known to be selectively expressed and to enhance a fibrotic phenotype. A recent study of ours showed that LOX oxidizes the PDGF receptor-β (PDGFR-β), leading to amplified downstream signaling. Here, we examined the expression and functions of LOX in megakaryocytes (MKs), the platelet precursors. Cells committed to the MK lineage undergo mitotic proliferation to yield diploid cells, followed by endomitosis and acquisition of polyploidy. Intriguingly, LOX expression is detected in diploid-tetraploid MKs, but scarce in polyploid MKs. PDGFR-BB is an inducer of mitotic proliferation in MKs. LOX inhibition with β-aminopropionitrile reduces PDGFR-BB binding to cells and downstream signaling, as well as its proliferative effect on the MK lineage. Inhibition of LOX activity has no influence on MK polyploidy. We next rationalized that, in a system with an abundance of low ploidy MKs, LOX could be highly expressed and with functional significance. Thus, we resorted to GATA-1low mice, where there is an increase in low ploidy MKs, augmented levels of PDGF-BB, and an extensive matrix of fibers. MKs from these mice display high expression of LOX, compared with control mice. Importantly, treatment of GATA-1low mice with β-aminopropionitrile significantly improves the bone marrow fibrotic phenotype, and MK number in the spleen. Thus, our in vitro and in vivo data support a novel role for LOX in regulating MK expansion by PDGF-BB and suggest LOX as a new potential therapeutic target for myelofibrosis.
Keywords: Bone Marrow, Development, Hematopoiesis, Platelets, Signal Transduction, Lysyl Oxidase, Megakaryocyte, Myelofibrosis, Platelet-derived Growth Factor
Introduction
Lysyl oxidase (LOX)3 is a copper-dependent amine oxidase that catalyzes the oxidative deamination of lysine and hydroxylysine residues on collagen and elastin precursors. The resulting semialdehydes form covalent cross-linkages, thus stabilizing the extracellular matrix fiber deposits (1). LOX is synthesized as a 50-kDa glycosylated precursor (pro-LOX), which is then secreted and undergoes proteolytic cleavage by pro-collagen C-proteinases, including bone morphogenetic protein 1, to release a catalytically active 30-kDa enzyme (LOX) and an 18-kDa propeptide (2, 3). LOX has been associated with various pathologies, including cardiovascular diseases (4), neurodegenerative disorders (5, 6), and tumor progression and metastasis (7–9). An interesting insight into the regulation of cellular proliferation by LOX came from a recent study, showing that LOX can oxidize and activate cell surface proteins, including PDGFR-β, in rat aortic smooth muscle cells (10, 11). Nevertheless, the role of this oxidase in regulating megakaryocyte (MK) expansion and/or ploidy had not been explored.
Megakaryocytes (MKs), the platelet precursors, undergo proliferation followed by endomitosis and polyploidy, prior to fragmenting into platelets (12, 13). In certain pathologies, the proliferation and ploidy of this lineage are deregulated, highlighting the need to further elucidate mechanisms of control of these processes (14, 15). Thrombopoietin (TPO) is the primary growth factor that stimulates the proliferation, polyploidization, and maturation of MK progenitors by activating c-mpl receptor signaling (16). In addition to TPO, a number of cytokines are also involved in megakaryopoiesis (17–20). A number of studies have focused on the role of platelet-derived growth factor (PDGF) in megakaryopoiesis. PDGF was first isolated from human platelets as a protein with a molecular mass of 28–31 kDa that consisted of two polypeptide chains designated as A and B (21). These two chains are linked together by disulfide bonds to form dimers (AA, AB, and BB). Of these dimers, PDGF-BB binds to all known PDGF receptor isotypes (PDGFR-αα, -αβ, and -ββ), and it possesses the strongest mitogenic activity (22). Earlier studies with primary murine and human bone marrow cultures, as well as human umbilical cord blood CD34-positive cells have shown that PDGF-BB is a positive regulator of megakaryopoiesis (23–25). Interestingly, PDGF-BB up-regulates the expression of megakaryocyte-associated transcription factors, such as c-Fos, GATA-1, and NFE2 in megakaryocytic cell lines (26).
Considering the above-described effects of LOX on PDGF-R and of PDGF-BB on MKs, in this study we examined the expression of LOX in MKs and its potential roles in this lineage. We clearly demonstrated a down-regulation of LOX as normal MKs become polyploid. Furthermore, LOX activity was found to be important for enhancing PDGF-mediated MK expansion via regulating Akt and ERK signaling. Additionally, we used a mouse model (GATA-1low) in which MK development is defective and one of the characteristics is an increased number of low ploidy MKs. In this model we showed that MKs have up-regulated LOX levels. Interestingly, treatment of GATA-1low mice with BAPN reduced marrow fibrosis, supporting a role for LOX in the progression of myelofibrosis. Our results suggest that LOX is a novel regulator of megakaryopoiesis via its effect on PDGFR-β and a potential treatment target for primary myelofibrosis.
EXPERIMENTAL PROCEDURES
Mice
Wild-type and GATA-1low (ΔneoΔHS strain) (27, 28) hemizygote male mice were used for analysis (because the mouse GATA gene is localized to the X chromosome), as indicated. GATA-1low mouse breeding pairs were kindly donated by Dr. John Crispino (Northwestern University). Wild-type littermate males were used for comparison. Expansion of the mouse colony was performed at Boston University. When indicated, wild-type FVB mice were purchased from Taconic. All studies involving mice were approved by the Boston University Animal Care and Use Committee.
TPO Injection
Tail vein injections of pegylated recombinant human megakaryocyte growth and development factor (PEG-hMGDF, also known as TPO, a gift from Kirin Pharma Company) were carried out as previously described (29). Briefly, a stock solution of 55 mg/ml pegylated recombinant human megakaryocyte growth and development factor was diluted in 1% normal mouse serum in PBS to a final concentration of 5 μg/ml. Each mouse received 100 μl per 10 g of body weight via tail vein injection. Control mice were injected with 1% normal mouse serum. Mice (FVB strain) were used for experiments 3 days post-injection, when the effect of TPO on MK number and ploidy is at a maximum (30).
BAPN Treatment
β-Aminopropionitrile (BAPN) was administrated in a dose of 150 mg/kg BAPN (Sigma, catalog no. A13134), dissolved in DPBS (Cellgro, catalog no. 21-0131-CV), and injected intraperitoneally on a daily basis for a duration of 8 days in FVB wild-type mice (Fig. 3). Control mice received the same volume of DPBS. For the mycloproliferation experiment (Fig. 8), on the fourth day post-delivery, breast-feeding mice were given drinking water containing 0.2% (w/v) BAPN as previously described (31), for a duration of 10 weeks. Mice, 10.5 weeks old, were then used for analysis.
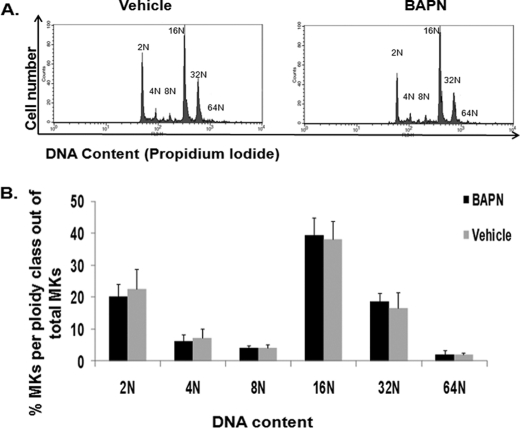
FIGURE 3.
LOX inhibition does not influence MK ploidy. A, BAPN was administered to control mice as described under “Experimental Procedures,” and bone marrow was collected for ploidy analysis. Representative histogram plots for vehicle (H2O) and BAPN administration are shown. B, quantification of ploidy status per group. Statistical analysis was applied using Student's t test. No statistical difference was found (n = 5, p > 0.05). The percentage of CD41-positive cells was estimated as 0.17% (±0.03) for vehicle 0.14% (±0.02) for BAPN-treated mice.
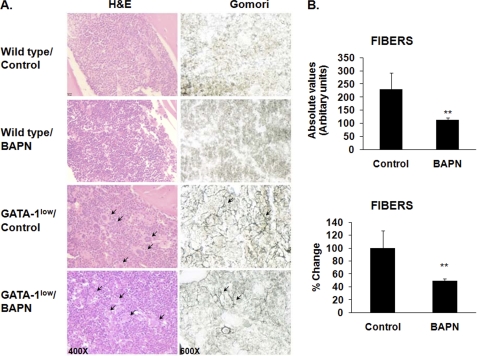
FIGURE 8.
Effect of LOX inhibition on marrow fibrosis in vivo. A, representative hematoxylin & eosin (H&E, left column) and Gomori silver (right column) staining of longitudinal sections of femurs from wild-type and GATA-1low (male littermates), control, or BAPN-treated mice (10.5 weeks old at the time of collection), as described under “Experimental Procedures.” Original magnification for the left column was 400× and for the right column are 600×. Arrows indicate the large presence of MKs (H&E stain) and the accumulation of reticulin fibers (Gomori) in the GATA-1low mice. As expected, no such fibers were detected in wild-type mice. Counting morphologically recognizable MKs in eight sections per mouse, using histological approaches described earlier (37–39), showed no significant differences in MK number in bone marrow sections of control and BAPN-treated mice. Similar results were obtained in a total of five mice per group. MK counting was further confirmed by flow cytometry analysis as in Fig. 3 (data not shown). B, quantification of fibrosis in BAPN- or vehicle-treated GATA-1low mice. Fibers were measured in arbitrary units (as described under “Experimental Procedures”) from stained sections. Data are represented as absolute values (top panel) or as mean percent change compared with values recorded from vehicle-treated GATA-1low mice (bottom panel). The mean values were obtained from five mice per group. Scale bars (10 μm) are at the upper left corner of each column. Results are presented as absolute values and percentage change; n = 5; *, p < 0.05.
Bone Marrow Cultures
Bone marrow from femurs, tibias, and humeri was isolated as previously described (32). Cells were cultured in Iscove's modified Dulbecco's medium media (Invitrogen, catalog no. 21056) containing 10% fetal bovine serum, 100 units/ml penicillin, and 100 μg/ml streptomycin (Invitrogen, catalog no. 15070-063) or when indicated, in StemSpan serum-free media (Stemcell, catalog no. 09650). Cells were treated either with 25 ng/ml pegylated recombinant human megakaryocyte growth and development factor, 25 ng/ml PDGF-BB (R&D Systems, catalog no. 520-BB), or 100 μm BAPN or a combination or the above factors for a duration of 3 days prior to collection for downstream applications.
MK Enrichment by Magnetic Activated Cell Sorting
MKs were isolated from freshly derived bone marrow and cultured bone marrow cells for Western blot and qRT-PCR analysis using the magnetic bead purification system as previously described (33–34) and following manufacturer's instructions. MK purity was previously assessed at 83% based on FACS analysis (33), and no contamination from neutrophils or macrophages was found (34). This percentage of purity is an underestimation considering the larger mass of polyploid MKs as compared with diploid cells.
Flow Cytometry Analysis of Polyploidy
Ploidy analyses were performed, based on CD41 antibody staining and propidium iodide DNA staining as previously described (35). Flow cytometry was performed on a BD-FACSCalibur using CellQuest (BD Biosciences).
Flow Cytometry Cell Sorting
Bone marrow cells were stained with CD41-FITC-conjugated antibody or isotype control in 10% FBS Iscove's modified Dulbecco's medium media for 30 min at 4 °C. Cells were then washed with Ca2+/Mg2+-free PBS, resuspended in Iscove's modified Dulbecco's medium media, stained with 5 μm Hoescht 33342 (Sigma, catalog no. 14533) for 30 min at 37 °C, and passed through a nylon mesh filter prior to sorting. MKs were sorted according to their DNA content using a MoFlo cytometer equipped with a 488 nm and a 351 nm laser and a 100 μm nozzle. A morphologic gate, including all bone marrow cells was determined on a side scatter v forward scatter (SSC v FSC) dot plot. Cell aggregates were excluded via a Pulse width v FSC-height dot plot. FITC and Hoechst were assigned to FL1 and FL5 channels, respectively. The sorting gates were determined on a FL1 v FL5 dot plot. CD41+ cells were sorted into 2N-4N and ≥8N cells at a rate of 3000 events/second.
Blood Cell Counts
Blood (0.5–0.6 ml) was collected via cardiac puncture. Blood was analyzed using the Hemavet multispecies hematology analyzer (Drew Scientific, Dallas, TX, catalog no. HV950FS) for complete blood count.
mRNA Purification and Transcript Analysis
Homogenization of primary MKs was performed by using QiaShredder columns (Qiagen, catalog no. 79654), and RNA was isolated using the RNeasy micro kit (Qiagen, catalog no. 74004). For cDNA synthesis, the QuantiTect Reverse transcription reaction kit was used (Qiagen, catalog no. 205310). Real-time PCR was performed with the use of murine LOX (Mm00495386_m1) and murine GATA-1 (Mm00484678_m1) TaqMan gene expression primers and probes (Applied Biosystems). Samples were run on an Applied Biosystems Sequence Detection System 7300. Data were normalized to GAPDH (Applied Biosystems, 4352339E) and analyzed using the ΔΔCT method.
Immunofluorescence
Mouse (FVB) bone marrow cells were cultured for 3 days in Iscove's modified Dulbecco's medium media, supplemented with 25 ng/ml TPO, 75 ng/ml macrophage colony stimulating factor (R&D Research, catalog no. 416-ML), and 10% FBS; these are conditions that induce development of mature and proliferating MKs. Next, cells were suspended in PBS and centrifuged (3 × 10⁵ cells/slide) to microscope slides (Fisher Scientific, catalog no. 12-550-15) using a Cytospin3 (Shandon) for 5 min at 120 × g. Cells were fixed in 4% paraformaldehyde at room temperature for 30 min and permeabilized with ice-cold 0.2% Triton X-100 for 20 min. Cells were stained with rabbit polyclonal anti-LOX (36) and anti-rabbit Alexa 594 (Molecular Probes, catalog no. A21207). Slides were mounted with coverslips using Vectashield mounting medium for fluorescence with 4,6-diamidino-2-phenylindole (DAPI). All slides were observed with an Olympus 70× inverted fluorescence microscope with a 40× objective. Images were documented with a Hamamatsu charge-coupled device camera (Hamamatsu Photonics) and analyzed with ImagePro (Media Cybernetics Inc.).
Western Blot Analysis
Cell pellets of primary MKs were lysed on ice with radioimmune precipitation assay buffer (1× PBS, 1% Nonidet P-40, 0.5% sodium deoxycholate, 0.1% SDS supplemented with proteinase inhibitor mixture; Roche, catalog no. 11697498001) and a phosphatase inhibitor mixture (Roche, catalog no. 04906837001). Protein concentration was estimated with the Bradford protein assay (Bio-Rad, catalog no. 500-0006). SDS loading buffer was added to the protein lysate and subjected to SDS-PAGE followed by a transfer to PVDF membranes at 30 V, overnight at 4 °C. The desired proteins were detected with rabbit anti-Akt (Cell Signaling, catalog no. 4685), rabbit anti-AktS473 (Cell Signaling, catalog no. 9271), rabbit anti-p44/42 (ERK1/2, Cell Signaling, catalog no. 4695S), rabbit anti-Pp44/42 (T202/Y204, Cell Signaling, catalog no. 4370S), and mouse monoclonal anti-β-actin (Sigma, catalog no. A5441) that was used as an equal loading control.
Histology
Spleens and femurs from 10.5-week-old mice were isolated and fixed in 10% (v/v) phosphate-buffered formalin. Femurs were decalcified with 14% EDTA (Boston Bioproducts, catalog no. BM-150), paraffin-embedded, and 3-μm sections were prepared. Slides were then stained with either hematoxylin (Fisher, catalog no. C5401–1D)-eosin stain (Sigma-Aldrich, catalog no. HT110132) or modified Gomori stain for reticulin fibers (Scytek, catalog no. GRS-1). For quantitative measure of fibrosis, images of randomly chosen Gomori-stained femur sections were acquired at 40×. ImageJ software (version 1.41o) was used to calculate the number of fibers-fiber bands on gridded images covering an area of 0.5 mm2 for each section. A total of three sections per mouse was processed. Standard deviations represent the mean of at least five mice per group. In spleen sections, the number of MKs was determined at ×200 original magnification in randomly chosen multiple sections to cover an area of 0.21 mm2 per spleen from a total of three mice per group, based on similar methods described previously (37–39).
Statistical Analysis
Statistical analysis was performed using Student's t test, two-sample equal variance (homoscedastic) with statistical significance at an α of at least 0.05.
RESULTS
LOX Expression in Megakaryocytes
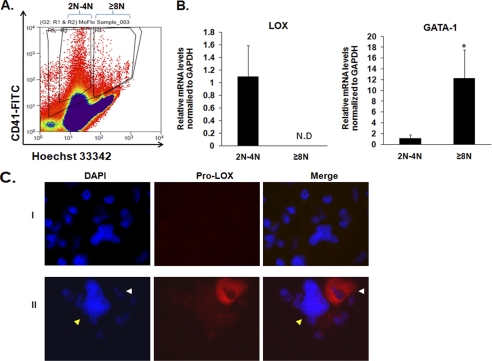
Bone marrow cells were stimulated with TPO for 0, 20, and 96 h, and MKs were isolated post-treatment as described under “Experimental Procedures.” TPO down-regulates the expression of LOX in the pool of MKs (Fig. 1A). Similar results were shown in vivo, where murine bone marrow was harvested and MKs were isolated 3 days following tail vein injection with either TPO or vehicle (Fig. 1B). This observed down-regulation of LOX by TPO could be a result of reduced expression of this oxidase in the MK lineage all together, or perhaps owing to its differential expression in different ploidy MKs. Namely, because the majority of MKs in TPO-treated systems are of high ploidy, we tested the possibility that LOX is selectively down-regulated in these cells. To this end, bone marrow-derived MKs were sorted by FACS based on their ploidy level (Fig. 2A) and tested for LOX expression. The quality of the sorted fractions was confirmed by immunofluorescence microscopic analysis (supplemental Fig. S1). As shown in Fig. 2B, LOX is selectively expressed in 2N and 4N MKs. A potential regulation of LOX mRNA stability, or gene expression by transcription factors enriched in mature MKs, although not a focus of this study, is further described under “Discussion.” To further confirm these expression data at the protein level, MKs were subjected to immunostaining using an antibody that recognizes the N-terminal domain of pro-LOX (36). As shown in Fig. 2C, pro-LOX is clearly detected in low ploidy MKs, and no significant staining is noted in high ploidy MKs (Fig. 2C, panel II).
FIGURE 1.
Differential expression of LOX mRNA levels in megakaryocytes (MKs). A, ex vivo stimulation of bone marrow cells derived from wild-type mice and cultured with 25 ng/ml TPO for 0, 20, and 96 h. MKs were isolated post-treatment via magnetic activated cell sorting columns for qRT-PCR analysis. Data were normalized to GAPDH mRNA. MK purity was evaluated as described under “Experimental Procedures.” B, in vivo effect of tail vein injections of 5 μg/Kg TPO in wild-type mice. Bone marrow was extracted 3 days post-injection, and MKs were isolated for qRT-PCR analysis. Effects of TPO on MK ploidy and platelet counts were confirmed as in a previous study (29). Standard deviation bars represent the mean of three independent experiments; *, p < 0.05.
FIGURE 2.
Differential expression of LOX in MKs. A, fluorescence activated cell sorting of MKs based on ploidy on a MoFlo cell sorter. MKs were selected based on CD41-FITC staining and sorted based on Hoechst (DNA) staining in the diploid-tetraploid (2N-4N) and polyploid (≥8N) MK fractions. B, qRT-PCR analysis for LOX and GATA-1 (a marker for MK differentiation) on MK-sorted fractions. Data were normalized to GAPDH mRNA. N.D = not detected. Standard deviation bars represent the mean of four independent experiments; *, p < 0.05. C, staining of low and high ploidy MKs with anti-LOX. Cells were prepared as described under “Experimental Procedures.” DNA was stained with DAPI (blue) to distinguish between typical low ploidy (2N-4N) and high ploidy (≥8N) cells, based on DNA density compared with diploid bone marrow cells, and evaluated as we described previously (58). Immunostaining was performed using rabbit IgG as control and 594 Alexa anti-rabbit secondary antibody to test for antibody specificity (panel I). Panel II: the white arrow depicts a low ploidy MK with pro-LOX staining (red). Within the same field and preparation, a yellow arrow depicts a high ploidy MK with no (or very dim) pro-LOX staining. Data shown represent at least ten slides analyzed, each with ∼105 cytospin cells, from two different experiments.
LOX Activity Is Important for MK Expansion, but Not Polyploidy
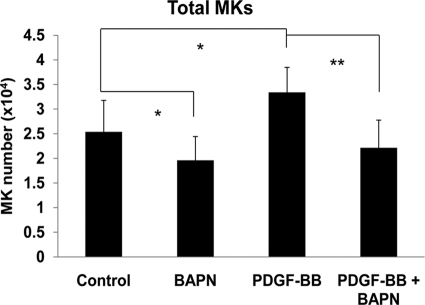
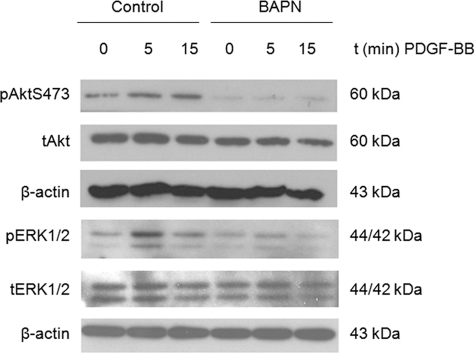
To examine the functional significance of LOX expression in MKs, we tested whether inhibition of this enzyme by its known selective inhibitor, β-aminopropionitrile (BAPN) (40), affects MK ploidy in bone marrow cells. As shown in Fig. 3, LOX inhibition via intraperitoneal administration to mice did not affect the MK ploidy profile. Similar results were obtained when BAPN was added to bone marrow cultures (supplemental Fig. S2). Inhibition of LOX by BAPN was confirmed using methods described in previous studies (41, 42) (supplemental Fig. S3). These results suggest that LOX activity is not needed for induction of MK ploidy. Considering that LOX activity is important for binding of PDGF to its receptor, via PDGF receptor oxidation (10), and that PDGF has an inducing effect on expansion of the MK lineage (23, 25), we tested whether LOX activity plays a role in PDGF-induced increase in MK number. As shown in Fig. 4, PDGF has a significant stimulating effect on MK number, which is all abolished by BAPN-mediated inhibition of LOX. This effect is corroborated by Western blot analysis of MKs using anti-proliferating cell nuclear antigen, a widely know marker for cellular proliferation (supplemental Fig. S4). In addition, LOX inhibition resulted in down-regulation of PDGF-induced Akt phosphorylation, as well as ERK1/2 phosphorylation (Fig. 5). This further supports a role for LOX activity in PDGF-mediated MK lineage development, as these signaling pathways are important for MK expansion (43, 44). In accordance, LOX inhibition reduces the binding of PDGF-BB to MK-enriched cultures (supplemental Fig. S5).
FIGURE 4.
Effect of BAPN on PDGF-BB or control-treated MKs. Bone marrow cultures were treated with 100 μm BAPN and/or 25 ng/ml PDGF-BB for 3 days in serum-free media. FACS analysis was performed, and total MKs number and percentage were calculated based on total bone marrow cell count. Standard deviation bars represent the mean of ten independent experiments, n = 10; *, p < 0.05, **, p < 0.001.
FIGURE 5.
Effect of LOX inhibition on PDGFR-β-mediated signaling. Western blot analysis of PDGF-Rβ downstream targets Akt and ERK1/2 in MKs. Bone marrow cells were stimulated with 25 ng/ml TPO for 3 days in the presence or absence of 100 μm BAPN, followed by magnetic activated cell sorting purification of MKs that were further cultured in serum-free media in the presence or absence of 100 μm BAPN for 16 h. MKs were next stimulated with 50 ng/ml PDGF-BB and collected for analysis at different time points. Blots were probed with the indicated antibodies, with t indicating total protein and p indicating the phosphorylated form. Probing with anti-β-actin was used as loading control. Shown here is a representative Western blot out of three independent experiments.
LOX Activity Is Important for Bone Marrow Matrix Deposition
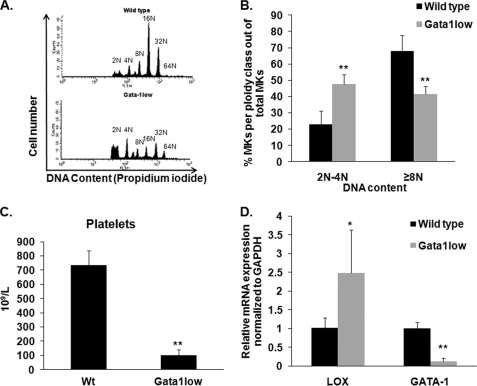
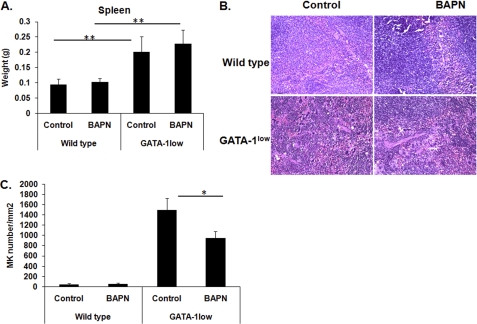
In view of the newly identified expression of LOX in normal, low DNA content MKs (Fig. 2) and its role in matrix deposition, we next sought to examine the expression of LOX in a system where low ploidy MKs are abundant, and the matrix is pathological. GATA-1low mice are characterized by a targeted mutation of regulatory elements upstream to the GATA-1 locus, which leads to decreased expression of GATA-1 in the MK lineage, resulting in an increased number of low DNA content MKs and thrombocytopenia (45, 46), as also confirmed in our studies (Fig. 6, A–C, and supplemental Table S1). Intriguingly, LOX expression was found to be up-regulated in MKs derived from GATA-1low mice, as compared with control mice (Fig. 6D) by ∼2.5-fold, similarly to a 2.3-fold increase in the percentage of low ploidy (2N-4N) MKs. As the MK number increases, they generate and release greater levels of PDGF, which is also the case for GATA-1low mice (38, 47). To test whether inhibition of LOX has the potential to attenuate MK number and matrix deposition in vivo, wild-type and GATA-1low mice (age-, gender-, and strain-matched) were provided with drinking water containing 0.2% (w/v) BAPN as described under “Experimental Procedures.” The specific dose of BAPN treatment was chosen based on previous studies (31), which showed effective LOX inhibition with no side-effects on survival or growth. This was further confirmed in our system (supplemental Fig. S6A). The mouse spleen is a known resident of abundant MKs in GATA-1low mice (38), also characterized by splenomegaly (Fig. 7A). Treatment of these mice with BAPN did not alter the spleen size but significantly reduced the number of MKs (Fig. 7, B and C). Detection of MKs in these sections was based on the large nucleus size and morphology and confirmed by immunohistochemistry using a CD41 antibody, which marks MKs (supplemental Fig. S7). These differences, however, were not sufficient to elicit significant changes in platelet number (supplemental Table S2), which is in line with other systems where platelet level is less influenced by moderate changes in MK number. The mild effect of this dose of BAPN on MK number in vivo could be due to accumulation of proliferation-inducing factors, other than PDGF (48), such as vascular endothelial growth factor and fibroblast growth factor-A in the MK microenvironment (38, 47). In accordance with the primary culture data (Fig. 3), BAPN-treated wild-type and GATA-1low mice did not show a significant change in the ploidy level of bone marrow MKs, as judged by flow cytometry analysis (supplemental Fig. S6B).
FIGURE 6.
LOX levels in MKs of GATA-1low mice. A, ploidy analysis of wild-type and GATA-1low MKs. Cells were stained with CD41-FITC antibody and propidium iodide (DNA). Flow cytometry was performed on a BD Biosciences Calibur using CellQuest. Representative histograms are shown per group (wild-type, GATA-1low male littermates). B, quantification of MK percentage (CD41-positive cells) of diploid-tetraploid and polyploid fractions. C, platelet numbers of wild-type and GATA-1low MKs. Blood was collected via heart puncture and platelet number was assessed on a Hemavet blood analyzer. D, qRT-PCR on isolated MKs to evaluate LOX and GATA-1 gene expression. Data were normalized to GAPDH mRNA. Standard deviation bars represent the mean of five independent experiments; *, p < 0.05; **, p < 0.001.
FIGURE 7.
Effect of LOX inhibition on splenic GATA-1low MKs. Spleens were harvested from wild-type and GATA-1low mice (male littermates) that were in either control or BAPN-drinking water treatment as described under “Experimental Procedures.” A, measurement of spleen mass. Standard deviation bars represent the mean of n = 6 mice per group (wild-type/BAPN groups, n = 4 mice); **, p < 0.001. B, representative spleen sections stained with hematoxylin and eosin. MKs were readily detected based on the large nucleus and morphology, and our method of detection was further confirmed by marking MKs with anti-CD41 as shown in supplemental Fig. S7. Original magnification, 200×. C, quantification of spleen MKs in a total area of 0.21 mm2. Results are presented as the mean of three mice per group, with nine slides analyzed per mouse; *, p < 0.05.
Finally, we examined the contention that LOX might also be an important regulator of MK-induced bone marrow fibrosis. Fibers are formed as a result of LOX-mediated cross-linking of matrix proteins, including collagen (49). A hallmark of myelofibrosis in GATA-1low mice is the progressive accumulation of fibers within the bone marrow. Fibrosis alters the bone marrow structure, which results in abnormal trafficking of progenitor cells, eventually leading to extramedullary hematopoiesis (48). As shown in the Gomori silver-stained femur sections (Fig. 8, A and B), 0.2% (w/v) BAPN treatment improved the fibrotic phenotype of GATA-1low mice by reducing the fibers by 37% as compared with non-treated mice. Wild-type mice were also treated, and as expected, no fibers were detectable in either control or BAPN-treated mice. Hematoxylin & eosin-stained sections did not reveal a significant change in MK number in the bone marrow upon BAPN treatment (see legend to Fig. 8A), which was further confirmed by FACS analysis (not shown). This is possibly due to the fact that a large percentage (∼30–40%) of GATA-1low bone marrow MKs are already in the process of para-apoptotic death (characterized by heterochromatic area surrounding the nucleoli and cytoplasmic vacuoles originated by dissolution of granules) (50). The BAPN-mediated reduction in reticulin fibers supports a role for LOX in the progression of myelofibrosis and represents the first application of LOX for remedy of such bone marrow pathology. The potential of this regime is enhanced by the fact that hematological parameters were essentially not significantly altered by LOX inhibition (supplemental Table S2).
DISCUSSION
MK differentiation involves a variety of cytokines and transcriptions factors. PDGF was demonstrated by a number of in vitro studies to promote MK lineage expansion via up-regulation of transcription factors crucial to MK development such as GATA-1 and NFE2 (26). The importance of this cytokine also stemmed from studies showing that PDGF-B knock-out mice are thrombocytopenic (51). Therefore, understanding the molecular events that regulate PDGF-mediated signaling will provide a better understanding of pathological conditions where MK differentiation is defective. In search for novel regulators of PDGF, we recently found that LOX affects the binding of PDGF to PDGFR-β in vascular smooth muscle cells, and subsequently enhance downstream proliferation signaling (10).
The present study explored the potential role of LOX in MK expansion and the underlying molecular mechanisms regulated by this oxidase. Our data indicate that LOX is produced by low ploidy MKs but down-regulated in the high-ploidy ones, and that TPO significantly attenuates LOX expression both ex vivo and in vivo in a total pool of MKs. This suggests that low doses of TPO administration result in low detection of LOX by increasing the number of polyploid MKs. Of note, high doses of TPO administration (500 μg/kg) for a prolonged period of time were shown to induce bone marrow fibrosis (52). It is likely that overproliferation of MKs in the TPOhigh model (52) could lead to increased levels of LOX. It is not clear yet what down-regulates LOX gene expression and/or mRNA in high ploidy MKs. According to Yu et al. (53), GATA-1, a transcription factor elevated in polyploidy MKs, can repress gene activation depending on the proximity of GATA-1 binding sites to binding regions such as the ones for Msx-1. Computational analyses from our laboratory predicted inhibitory GATA-1 binding sites in the LOX gene promoter sequence, based on the presence of GATA-1 flanked by Msx-1 site (supplemental Fig. S8). GATA-1 binding sites are also predicted in other members of the LOX family (54, 55). On the other hand, the LOX gene promoter also contains putative binding sites for Runx-1, a transcription factor enriched in mature MKs, also known to inhibit or stimulate gene expression, depending on neighboring sequences (supplemental Fig. S8). Future studies will focus on the mechanisms by which the LOX gene is potentially down-regulated by transcription factors enriched in mature MKs.
Having determined the MK expression pattern of LOX during MK development, we next sought to investigate its effect on PDGF-mediated MK expansion. We resorted to using a pharmacological irreversible inhibitor of LOX. BAPN, has been frequently used to investigate the catalytic activity of this enzyme (10, 45, 56). The concentration of BAPN used in this study (100 μm) has been previously shown to be selective for LOX among a wider group of amine oxidases (40). Our results clearly demonstrate that inhibition of LOX by BAPN ablates the effect of PDGF on MK expansion, as well as PDFG eminent signaling. This would be expected based on the previously described ability of LOX to oxidize the PDGF receptor and consequently amplify downstream signaling (10).
The functional relevance of LOX expression in MKs is beyond PDGF-induced cellular proliferation; it expands to matrix deposition. This was shown by examining the levels and function of LOX in a mouse model for myelofibrosis. As previously stated, GATA-1low mice are thrombocytopenic, with increased frequency of MKs in the bone marrow (45). Their MKs are abnormal, with low ploidy, as their proper differentiation is halted due to a mutation in the GATA-1 promoter that results in MK-restricted down-regulation of GATA-1 (ΔneoΔHS strain) (45). Interestingly, LOX expression is up-regulated in GATA-1low MKs as compared with wild-type, consistent with the differential expression of LOX in 2N-4N MKs. Importantly, LOX inhibition significantly reduced the number of MKs in the spleen of GATA-1low mice as well as improved their fibrotic phenotype, further affirming a role for LOX in the development of myelofibrosis. Of note, LOX is also highly detected in patient-derived megakaryoblastic cell lines, and in the bone marrow blasts of 9 of 11 patients suffering from non-DS-AMKL (57).4
In summary, for the first time, our study provides a link between LOX, PDGF, and PDGF-mediated MK propagation. Our findings support a mechanism where under physiological conditions TPO induces MK polyploidy and, hence, keeps LOX at low levels, which is dispensable for polyploidization. Importantly, LOX is remarkably up-regulated in MKs in pathological condition, such as myelofibrosis, and LOX inhibition significantly attenuates this pathology.
Supplementary Material
Acknowledgments
We thank Shannon Carroll for providing assistance with bone marrow isolation, Dr. Paola Hurtado and Dr. Siddharth R. Vora for their help with the LOX activity assay, and the Flow Cytometry Core Facility at Boston University School of Medicine for their assistance with cell sorting.
This work was supported, in whole or in part, by National Institutes of Health NHLBI Grant HL80442 (to K. R.).

The on-line version of this article (available at http://www.jbc.org) contains supplemental text, Figs. S1–S8, and Tables S1 and S2.
Data are deposited in the Gene Expression Omnibus, available at www.ncbi.nlm.nih.gov/geo (GEO accession no. GSE4119).
- LOX
- lysyl oxidase
- MK
- megakaryocyte
- TPO
- thrombopoietin
- PDGFR
- PDGF receptor
- BAPN
- β-aminopropionitrile
- qRT
- quantitative reverse transcriptase.
REFERENCES
- 1. Lucero H. A., Kagan H. M. (2006) Cell Mol. Life Sci. 63, 2304–2316 [DOI] [PMC free article] [PubMed] [Google Scholar]
- 2. Kagan H. M., Li W. (2003) J. Cell Biochem. 88, 660–672 [DOI] [PubMed] [Google Scholar]
- 3. Trackman P. C., Bedell-Hogan D., Tang J., Kagan H. M. (1992) J. Biol. Chem. 267, 8666–8671 [PubMed] [Google Scholar]
- 4. Rodríguez C., Martínez-González J., Raposo B., Alcudia J. F., Guadall A., Badimon L. (2008) Cardiovasc. Res. 79, 7–13 [DOI] [PubMed] [Google Scholar]
- 5. Gilad G. M., Kagan H. M., Gilad V. H. (2005) Neurosci. Lett 376, 210–214 [DOI] [PubMed] [Google Scholar]
- 6. Gilad G. M., Kagan H. M., Gilad V. H. (2001) Neurosci. Lett 310, 45–48 [DOI] [PubMed] [Google Scholar]
- 7. Erler J. T., Bennewith K. L., Nicolau M., Dornhöfer N., Kong C., Le Q. T., Chi J. T., Jeffrey S. S., Giaccia A. J. (2006) Nature 440, 1222–1226 [DOI] [PubMed] [Google Scholar]
- 8. Min C., Yu Z., Kirsch K. H., Zhao Y., Vora S. R., Trackman P. C., Spicer D. B., Rosenberg L., Palmer J. R., Sonenshein G. E. (2009) Cancer Res. 69, 6685–6693 [DOI] [PMC free article] [PubMed] [Google Scholar]
- 9. Payne S. L., Fogelgren B., Hess A. R., Seftor E. A., Wiley E. L., Fong S. F., Csiszar K., Hendrix M. J., Kirschmann D. A. (2005) Cancer Res. 65, 11429–11436 [DOI] [PubMed] [Google Scholar]
- 10. Lucero H. A., Ravid K., Grimsby J. L., Rich C. B., DiCamillo S. J., Mäki J. M., Myllyharju J., Kagan H. M. (2008) J. Biol. Chem. 283, 24103–24117 [DOI] [PMC free article] [PubMed] [Google Scholar]
- 11. Tang S. S., Trackman P. C., Kagan H. M. (1983) Journal of Biological Chemistry 258, 4331–4338 [PubMed] [Google Scholar]
- 12. Nagata Y., Muro Y., Todokoro K. (1997) J. Cell Biol. 139, 449–457 [DOI] [PMC free article] [PubMed] [Google Scholar]
- 13. Vitrat N., Cohen-Solal K., Pique C., Le Couedic J. P., Norol F., Larsen A. K., Katz A., Vainchenker W., Debili N. (1998) Blood 91, 3711–3723 [PubMed] [Google Scholar]
- 14. Balduini C. L., Iolascon A., Savoia A. (2002) Haematologica 87, 860–880 [PubMed] [Google Scholar]
- 15. Deutsch V. R., Tomer A. (2006) Br. J. Haematol. 134, 453–466 [DOI] [PubMed] [Google Scholar]
- 16. Kaushansky K., Drachman J. G. (2002) Oncogene 21, 3359–3367 [DOI] [PubMed] [Google Scholar]
- 17. Williams J. L., Pipia G. G., Datta N. S., Long M. W. (1998) Blood 91, 4118–4126 [PubMed] [Google Scholar]
- 18. Briddell R. A., Hoffman R. (1990) Blood 76, 516–522 [PubMed] [Google Scholar]
- 19. Koike K., Nakahata T., Kubo T., Kikuchi T., Takagi M., Ishiguro A., Tsuji K., Naganuma K., Okano A., Akiyama Y., et al. (1990) Blood 75, 2286–2291 [PubMed] [Google Scholar]
- 20. Burstein S. A., Mei R. L., Henthorn J., Friese P., Turner K. (1992) J. Cell Physiol. 153, 305–312 [DOI] [PubMed] [Google Scholar]
- 21. Hollinger J. O., Hart C. E., Hirsch S. N., Lynch S., Friedlaender G. E. (2008) J. Bone Joint Surg. Am. 90, Suppl. 1, 48–54 [DOI] [PubMed] [Google Scholar]
- 22. Heldin C. H., Westermark B. (1999) Physiol. Rev. 79, 1283–1316 [DOI] [PubMed] [Google Scholar]
- 23. Yang M., Chesterman C. N., Chong B. H. (1995) Br. J. Haematol. 91, 285–289 [DOI] [PubMed] [Google Scholar]
- 24. Su R. J., Li K., Yang M., Zhang X. B., Tsang K. S., Fok T. F., Li C. K., Yuen P. M. (2001) Bone Marrow Transplant 27, 1075–1080 [DOI] [PubMed] [Google Scholar]
- 25. Su R. J., Li K., Zhang X. B., Pan Yuen P. M., Li C. K., James A. E., Liu J., Fok T. F. (2005) Stem Cells Dev. 14, 223–230 [DOI] [PubMed] [Google Scholar]
- 26. Chui C. M., Li K., Yang M., Chuen C. K., Fok T. F., Li C. K., Yuen P. M. (2003) Cytokine 21, 51–64 [DOI] [PubMed] [Google Scholar]
- 27. McDevitt M. A., Shivdasani R. A., Fujiwara Y., Yang H., Orkin S. H. (1997) Proc. Natl. Acad. Sci. U.S.A. 94, 6781–6785 [DOI] [PMC free article] [PubMed] [Google Scholar]
- 28. Muntean A. G., Pang L., Poncz M., Dowdy S. F., Blobel G. A., Crispino J. D. (2007) Blood 109, 5199–5207 [DOI] [PMC free article] [PubMed] [Google Scholar]
- 29. Zimmet J. M., Ladd D., Jackson C. W., Stenberg P. E., Ravid K. (1997) Mol. Cell Biol. 17, 7248–7259 [DOI] [PMC free article] [PubMed] [Google Scholar]
- 30. Arnold J. T., Daw N. C., Stenberg P. E., Jayawardene D., Srivastava D. K., Jackson C. W. (1997) Blood 89, 823–833 [PubMed] [Google Scholar]
- 31. Fornieri C., Baccarani-Contri M., Quaglino D., Jr., Pasquali-Ronchetti I. (1987) J. Cell Biol. 105, 1463–1469 [DOI] [PMC free article] [PubMed] [Google Scholar]
- 32. Thompson A., Zhang Y., Kamen D., Jackson C. W., Cardiff R. D., Ravid K. (1996) J. Biol. Chem. 271, 22976–22982 [DOI] [PubMed] [Google Scholar]
- 33. Eliades A., Papadantonakis N., Ravid K. (2010) J. Biol. Chem. 285, 18909–18917 [DOI] [PMC free article] [PubMed] [Google Scholar]
- 34. McCrann D. J., Eliades A., Makitalo M., Matsuno K., Ravid K. (2009) Blood 114, 1243–1249 [DOI] [PMC free article] [PubMed] [Google Scholar]
- 35. Nguyen H. G., Yu G., Makitalo M., Yang D., Xie H. X., Jones M. R., Ravid K. (2005) Blood 106, 1559–1564 [DOI] [PMC free article] [PubMed] [Google Scholar]
- 36. Guo Y., Pischon N., Palamakumbura A. H., Trackman P. C. (2007) Am. J. Physiol. Cell Physiol. 292, C2095–C2102 [DOI] [PubMed] [Google Scholar]
- 37. Ishibashi T., Kimura H., Shikama Y., Uchida T., Kariyone S., Hirano T., Kishimoto T., Takatsuki F., Akiyama Y. (1989) Blood 74, 1241–1244 [PubMed] [Google Scholar]
- 38. Vannucchi A. M., Bianchi L., Paoletti F., Pancrazzi A., Torre E., Nishikawa M., Zingariello M., Di Baldassarre A., Rana R. A., Lorenzini R., Alfani E., Migliaccio G., Migliaccio A. R. (2005) Blood 105, 3493–3501 [DOI] [PubMed] [Google Scholar]
- 39. Wu Y., Welte T., Michaud M., Madri J. A. (2007) Blood 110, 851–859 [DOI] [PMC free article] [PubMed] [Google Scholar]
- 40. Tang S. S., Chichester C. O., Kagan H. M. (1989) Connect Tissue Res. 19, 93–103 [DOI] [PubMed] [Google Scholar]
- 41. Hong H. H., Uzel M. I., Duan C., Sheff M. C., Trackman P. C. (1999) Lab. Invest. 79, 1655–1667 [PubMed] [Google Scholar]
- 42. Palamakumbura A. H., Trackman P. C. (2002) Anal. Biochem. 300, 245–251 [DOI] [PubMed] [Google Scholar]
- 43. Ye J. Y., Chan G. C., Qiao L., Lian Q., Meng F. Y., Luo X. Q., Khachigian L. M., Ma M., Deng R., Chen J. L., Chong B. H., Yang M. (2010) Haematologica 95, 1745–1753 [DOI] [PMC free article] [PubMed] [Google Scholar]
- 44. Mazharian A., Watson S. P., Séverin S. (2009) Exp. Hematol. 37, 1238–1249 [DOI] [PMC free article] [PubMed] [Google Scholar]
- 45. Shivdasani R. A., Fujiwara Y., McDevitt M. A., Orkin S. H. (1997) EMBO J. 16, 3965–3973 [DOI] [PMC free article] [PubMed] [Google Scholar]
- 46. Vyas P., Ault K., Jackson C. W., Orkin S. H., Shivdasani R. A. (1999) Blood 93, 2867–2875 [PubMed] [Google Scholar]
- 47. Vannucchi A. M., Bianchi L., Cellai C., Paoletti F., Rana R. A., Lorenzini R., Migliaccio G., Migliaccio A. R. (2002) Blood 100, 1123–1132 [DOI] [PubMed] [Google Scholar]
- 48. Atsawasuwan P., Mochida Y., Parisuthiman D., Yamauchi M. (2005) Biochem. Biophys. Res. Commun. 327, 1042–1046 [DOI] [PubMed] [Google Scholar]
- 49. Kagan H. M., Trackman P. C. (1991) Am. J. Respir. Cell Mol. Biol. 5, 206–210 [DOI] [PubMed] [Google Scholar]
- 50. Centurione L., Di Baldassarre A., Zingariello M., Bosco D., Gatta V., Rana R. A., Langella V., Di Virgilio A., Vannucchi A. M., Migliaccio A. R. (2004) Blood 104, 3573–3580 [DOI] [PubMed] [Google Scholar]
- 51. Levéen P., Pekny M., Gebre-Medhin S., Swolin B., Larsson E., Betsholtz C. (1994) Genes Dev. 8, 1875–1887 [DOI] [PubMed] [Google Scholar]
- 52. Ulich T. R., del Castillo J., Senaldi G., Kinstler O., Yin S., Kaufman S., Tarpley J., Choi E., Kirley T., Hunt P., Sheridan W. P. (1996) Blood 87, 5006–5015 [PubMed] [Google Scholar]
- 53. Yu M., Riva L., Xie H., Schindler Y., Moran T. B., Cheng Y., Yu D., Hardison R., Weiss M. J., Orkin S. H., Bernstein B. E., Fraenkel E., Cantor A. B. (2009) Mol. Cell 36, 682–695 [DOI] [PMC free article] [PubMed] [Google Scholar]
- 54. Lee J. E., Kim Y. (2006) J. Biol. Chem. 281, 37282–37290 [DOI] [PubMed] [Google Scholar]
- 55. Debret R., Cenizo V., Aimond G., André V., Devillers M., Rouvet I., Mégarbané A., Damour O., Sommer P. (2010) J. Invest. Dermatol. 130, 2594–2601 [DOI] [PubMed] [Google Scholar]
- 56. Erler J. T., Bennewith K. L., Cox T. R., Lang G., Bird D., Koong A., Le Q. T., Giaccia A. J. (2009) Cancer Cell 15, 35–44 [DOI] [PMC free article] [PubMed] [Google Scholar]
- 57. Bourquin J. P., Subramanian A., Langebrake C., Reinhardt D., Bernard O., Ballerini P., Baruchel A., Cavé H., Dastugue N., Hasle H., Kaspers G. L., Lessard M., Michaux L., Vyas P., van Wering E., Zwaan C. M., Golub T. R., Orkin S. H. (2006) Proc. Natl. Acad. Sci. U.S.A. 103, 3339–3344 [DOI] [PMC free article] [PubMed] [Google Scholar]
- 58. Papadantonakis N., Makitalo M., McCrann D. J., Liu K., Nguyen H. G., Martin G., Patel-Hett S., Italiano J. E., Ravid K. (2008) Cell Cycle 7, 2352–2356 [DOI] [PMC free article] [PubMed] [Google Scholar]
Associated Data
This section collects any data citations, data availability statements, or supplementary materials included in this article.


