Abstract
We previously reported that partial disruption of the Ankrd26 gene in mice leads to hyperphagia and leptin-resistant obesity. To determine whether the Ankrd26 mutation can affect the development of adipocytes, we studied mouse embryo fibroblasts (MEFs) from the mutant mice. We found that Ankrd26−/− MEFs have a higher rate of spontaneous adipogenesis than normal MEFs and that adipocyte formation is greatly increased when the cells are induced with troglitazone alone or with a mixture of troglitazone, insulin, dexamethasone, and methylisobutylxanthine. Increased adipogenesis was detected as an increase in lipid droplet formation and in the expression of several markers of adipogenesis. There was an increase in expression of early stage adipogenesis genes such as Krox20, KLF5, C/EBPβ, C/EBPδ, and late stage adipogenesis regulators KLF15, C/EBPα, PPARγ, and aP2. There was also an increase in adipocyte stem cell markers CD34 and Sca-1 and preadipocyte markers Gata2 and Pref-1, indicating an increase in both stem cells and progenitor cells in the mutant MEFs. Furthermore, ERK was found constitutively activated in Anrd26−/− MEFs, and the addition of MEK inhibitors to mutant cells blocked ERK activation, decreased adipogenesis induction, and significantly reduced expression of C/EBPδ, KLF15, PPARγ2, CD34, and Pref-1 genes. We conclude that Ankrd26 gene disruption promotes adipocyte differentiation at both the progenitor commitment and differentiation steps and that ERK activation plays a role in this process.
Keywords: Adipocyte, C/EBP Transcription Factor, ERK, Insulin, Obesity, Ankrd26, ERK Phosphorylation, MEF, Adipogenesis Induction, Spontaneous Adipogenesis
Introduction
The incidence of obesity has increased and is now recognized as a risk factor for many diseases, including diabetes, heart disease, and cancer (1). We have recently reported the establishment of a new mouse model of obesity due to partial inactivation of the Ankrd26 gene (2). ANKRD26 is the ancestral gene for a primate-specific gene family POTE (3). POTE appears to be a proapoptotic gene that is highly expressed in testis and only in a few other normal tissues but is expressed in many cancers (4, 5). The ANKRD26 gene is much larger than POTE and contains many more exons. Ankrd26 is expressed in almost all normal tissues including brain, heart, liver, kidney, pancreas, and adipose tissue. The human and mouse Ankrd26 genes consist of 34 exons and encode a protein of 190 kDa in size that is localized to the inner aspect of the cell membrane. This location and the fact that ANKRD26 has ankyrin repeats and spectrin helices suggest that ANKRD26 could function as an adaptor protein in cell signaling.
A mouse line containing a mutant Ankrd26 gene was generated from mouse ES cells obtained from Bay Genomics in which a β-galactosidase cDNA was inserted into intron 24 of the Ankrd26 gene. As a result of the insertion, the final 10 exons of the gene are not transcribed, and the Ankrd26 protein is missing the last 519 amino acids. The heterozygous mice exhibit no phenotype, but the adult homozygous mice become extremely obese, indicating that the loss of the C terminus of the protein is responsible for the obese phenotype. Although the mice are hyperphagic and apparently do not respond to leptin, we believe that there are other factors contributing to their obesity outside of the CNS. One reason is that Ankrd26 is highly expressed in adipose tissue. A second is that white adipose tissue has enhanced insulin sensitivity in these mice.2
Adipogenesis is known to be controlled by a complex network of transcription factors (6–8) and generally includes two steps (6). The first is commitment, which involves differentiation of pluripotent or multipotent stem cells into preadipocytes, and the second is terminal differentiation in which preadipocytes differentiate into adipocytes. During adipocyte differentiation in the presence of hormonal inducers, growth-arrested preadipocytes undergo mitotic clonal expansion (7, 8) followed by the induction of the master regulator genes peroxisome proliferator-activated receptor γ (PPARγ)3 and CCAAT enhancer-binding protein α (C/EBPα) (9). These in turn induce downstream target genes such as aP2, leading to the formation of differentiated adipocytes. C/EBPβ and C/EBPδ are two well known early stage regulators (10) that have important roles in mitotic clonal expansion (11, 12). KLF5 (13) is a zinc finger transcription factor whose expression is stimulated by C/EBPβ and C/EBPδ. Krox20 promotes adipogensis by stimulating C/EBPβ expression (14), and KLF15 is another adipogensis regulator acting downstream of C/EBPβ and C/EBPδ and can stimulate PPARγ expression (15).
We report here that mouse embryo fibroblasts (MEFs) from mice with partial inactivation of the Ankrd26 gene are more readily induced to form adipocytes compared with control MEFs and that the mutant MEFs contain an increased number of both stem cells and progenitor cells for adipocytes.
EXPERIMENTAL PROCEDURES
Preparation of Primary MEF Cells
Primary MEF cells were isolated from embryos of wild-type (WT) and Ankrd26 C-terminal disruption homozygous mice at 13.5 days after coitus. Embryos were removed and separated from maternal tissues and yolk sack and were finely minced, digested with 0.05% trypsin/1 mm EDTA for 30 min at 37 °C, and centrifuged for 5 min at 1000 × g. The pellet was resuspended in culture medium before plating. Cells were cultured at 37 °C in high glucose DMEM (Invitrogen) supplemented with 10% (v/v) FBS (Omega Scientific) and 100 units/ml penicillin/streptomycin (Invitrogen). MEF cells were frozen in liquid nitrogen at passage 1 in aliquots of 1 × 10⁶ cells/vial.
MEF Cell Culture
Passage 1 cells were thawed, and experiments were performed at passage 3 or 4. MEF cells were plated in 6-well plates with 2.5 × 10⁵ cells/well and maintained at 37 °C with DMEM with 10% FBS, and 5% CO2.
For the ERK inhibition experiment, mutant (MT) MEF cells were treated with 30 μm ERK inhibitor U0126 (Cell Signaling Technology) or 40 μm PD0935 (Cell Signaling Technology) in dimethyl sulfoxide from day 3 after plating to the end of adipogenesis induction.
Adipogenesis Induction
For adipogenesis induction of MEF cells, 8 days after confluence the medium was replaced with the standard differentiation induction medium containing 0.5 mm methylisobutylxanthine, 1 μm dexamethasone (DEX), 10 μg/ml insulin, 10 μm troglitazone (TROG) and 10% (v/v) FBS (16). The cells were treated with differentiation agents for 3 days, and the medium was replaced with normal 10% FBS DMEM culture for another 2 days. Medium was renewed every 2 days. For Western blot analysis and real-time RT-PCR, cells were harvested before and after induction of differentiation.
Oil Red O Staining
Oil red O staining was performed on induction day 5. Cells were washed twice with PBS and fixed with 10% formalin in PBS for 1 h. They were washed three times with water, one time with 60% isopropyl alcohol, and stained with oil red O (six parts of 0.6% oil red O dye in isopropyl alcohol and four parts water) for 30 min. Excess stain was removed by washing once with 60% isopropyl alcohol and two times with water. The plates were then scanned. Spectrophotometric quantification of the stain was performed by dissolving the lipid in 100% isopropyl alcohol for 10 min. Optical density was then measured at 490 nm.
Western Blot Analysis
MEF cells were prepared for Western blot analysis by rinsing twice with PBS and scraping cells in lysis buffer containing 50 mm Tris-HCl, pH 8, 5 mm EGTA,150 mm NaCl, 0.5% Nonidet P-40, 0.5% Triton X-100 containing protease inhibitor mixture (Roche Applied Science, 11697498001) and phosphatase inhibitor mixture (Sigma, P5726). Cell lysates were incubated on ice for 30 min with occasional vortexing and then centrifuged for 15 min at 14,000 × g at 4 °C. Protein concentrations were determined by the Coomassie PlusTM protein assay (Thermo Scientific, 23236). Cell lysates were fractionated on 4–20% SDS-PAGE and transferred to PVDF membranes (Invitrogen, LC2002). Signals were visualized by ECL Advance Western blotting detection (GE Healthcare, RPN2135) for p-ERK; all others were detected with ECL plus Western blotting detection (GE Healthcare, RPN2132). Antibodies used were phospho-mTOR (Ser2448) (Cell Signaling Technology, 2971), mTOR (Cell Signaling Technology, 2972), ERK1/2 (Cell Signaling Technology, 9102), phospho-ERK1/2 (Cell Signaling Technology, 9106), phospho-MEK1/2 (Cell Signaling Technology, 2338), MEK1/2 (Cell Signaling Technology, 9122), insulin receptor β (Cell Signaling Technology, 3025), phospho-IGF-I receptor β/insulin receptor β (Cell Signaling Technology, 3024), phospho-Akt (Ser-473) (Cell Signaling Technology, 9271), Akt (Cell Signaling Technology, 9272), PPARγ 1B8 (Cell Signaling Technology, 2443), C/EBPδ (Cell Signaling Technology, 2318), FABP4 (aP2) (Cell Signaling Technology, 3544), C/EBPβ (Santa Cruz Biotechnology, sc-150), β-actin (Santa Cruz Biotechnology, sc-13065), secondary antibody goat anti-rabbit IgG-HRP (Santa Cruz Biotechnology, sc-2004), and secondary antibody sheep anti-mouse (GE Healthcare, NA931).
Immunofluorescence
Cells were cultured on sterile Permanox 4-well culture slides for 10 days after confluence in 10% FBS DMEM in 37 °C and 5% CO2. Cells were washed briefly with PBS, fixed for 15 min with 10% formalin in PBS, washed with PBS, and then incubated for 15 min with 0.5% Triton X-100 in PBS. Cells were then washed with 5% FBS in PBS at room temperature for 1 h and rinsed in PBS for 5 min three times. Cells were incubated with primary antibody at room temperature for 2 h, rinsed in PBS for 5 min three times, and then incubated with secondary antibody at room temperature for 1 h, rinsed in PBS for 5 min three times, and counterstained with DAPI for 10 min in PBS, and rinsed in PBS 5 min three times. Coverslips were placed on cells with anti-fade mounting medium, and cells were observed using confocal microscopy. Antibodies used were PPARγ (Cell Signaling Technology, 2443), C/EBPα (Cell Signaling Technology, 2295), p-ERK (Cell Signaling Technology, 9106), and Alexa Fluor® 488 goat anti-rabbit IgG (Invitrogen, A-11008).
RT and Real-time PCR
Total RNA was isolated using TRIzol reagent (Invitrogen, 15596-018). RNA was purified with an RNeasy Mini Kit (Qiagen, 74104), and 2 μg of total RNA was used to perform genomic DNA elimination and reverse transcription using an RT2 First Strand Kit (SABiosciences, C03). Real-time RT-PCR was performed on an ABI HT 7900 RT-PCR machine using the comparative CT method (ΔΔCT) method with a QuantiFast SYBR Green PCR kit (Qiagen,204054). Relative mRNA expression levels of target genes were normalized to β-actin (primer information is available in supplemental Table 1).
Statistical Analysis
The data are expressed as the mean ± S.D. Statistical analysis was performed using the Student's t test for comparison between two groups and one-way ANOVA.
RESULTS
Spontaneous Adipogenesis in Ankrd26 MT MEF Cells
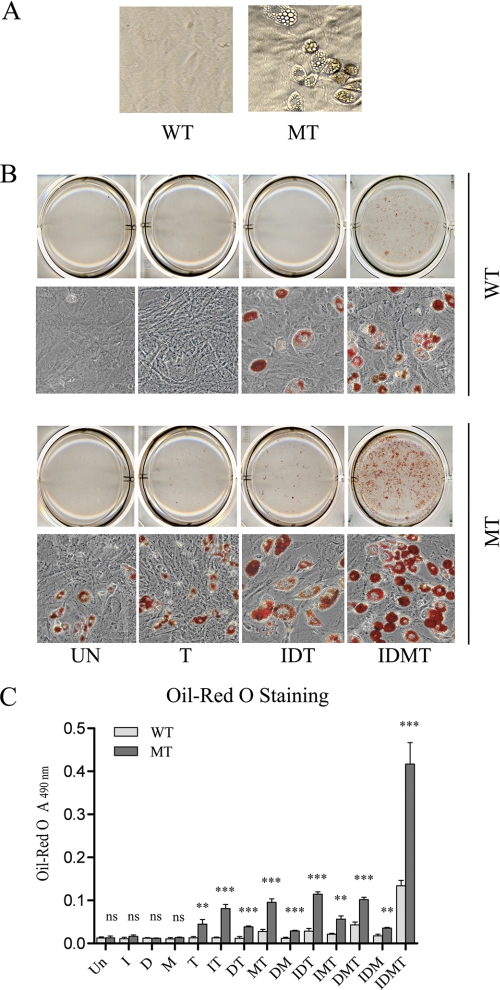
Primary MEFs are widely used in adipogenesis studies because they are multipotent cells and can be stimulated to differentiate into adipocytes. To investigate the role of the Ankrd26 gene in adipogensis, MEFs were prepared from pools of 13.5-day embryos from normal and Ankrd26−/− C57BL/6 mice. Each pool was made up of cells from 8 embryos, and all experiments were performed at passage 3 or 4. During the growth of the cells we observed a low level of spontaneous adipocyte formation on days 8–10 after confluence in the mutant cells (Fig. 1A), but otherwise the growth rate and morphological appearance of the mutant and wild-type cells were similar (data not shown).
FIGURE 1.
Ankrd26 disruption causes hyperadipogenesis in MEF cells. A, spontaneous adipogensis in MEF cells. MEF cells were under regular culture for 10 days after confluence. Spontaneous differentiated adipocytes were found in MT MEFs but not in WT MEFs. B, representative pictures of adipogenesis in MEFs induced with the indicated mixtures: UN, without induction; T, induced with TROG; IDT, induced with insulin, DEX, and TROG; IDMT, induced with insulin, DEX, IBMX, and TROG. C, oil red O staining assay of adipogenesis induction in MEF cells. Bars indicate the mean ± S.D. (error bars) of oil red O value measured at A490 nm. I, insulin; D, DEX; M, IBMX; T, TROG. **, p < 0.01 significant statistical difference; ***, p < 0.001 significant statistical difference; ns, no significant statistical difference at p < 0.05.
Enhanced Adipogensis in Ankrd26 MT MEFs
Insulin, DEX, IBMX, and TROG are commonly used to trigger the differentiation of adipocytes (17). Initially, we tried each of these agents alone to induce adipogenesis as evaluated by oil red O staining. We found that TROG was the only agent able to stimulate adipocyte formation in the mutant cells (Fig. 1, B and C). None of the drugs alone stimulated adipogenesis in normal MEFs. When we combined TROG with insulin, DEX, or IBMX, or combined all three there was consistently more adipogenesis in the mutant cells than in normal MEFs (Fig. 1, B and C). Fig. 1, B and C, shows that the combination of insulin, DEX, IBMX, and TROG (IDMT) induced a very striking increase in the number of adipocytes and in the total lipid production in MT MEFs compared with the WT MEF cells. These results indicate that induced Ankrd26 mutant fibroblasts generate more adipocytes than the control WT MEFs.
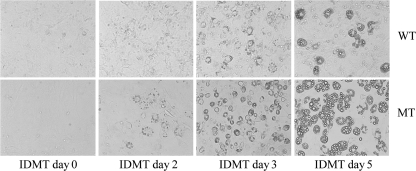
We next evaluated the time course of adipocyte induction in a medium containing 0.5 mm IBMX, 1 μm DEX, 10 μg/ml insulin, 10 μm TROG, and 10% FBS. As shown in Fig. 2, lipid droplets in the mutant cells were visible on postinduction day 2. The droplets had increased in size on day 3 and were very prominent on day 5. In contrast, lipid droplet formation in the normal MEFs was delayed, the lipid droplets only became visible on day 3, and the droplets were much smaller in size.
FIGURE 2.
Earlier shifts of lipid droplet formation in Ankrd26 MT MEF cells. MEF cells were treated with adipogenic differentiation medium IDMT 8 days after confluence, and microscopy pictures were taken on the indicated days: day 0 (before induction), day 2, day 3, and day 5 after induction. Lipid droplets are visible beginning on day 3 and are enlarged on day 5 after induction in WT MEFs, whereas droplets were visible beginning on induction day 2 and are enlarged on day 3 and day 5 after induction in MT MEF cells.
Master Regulators of Adipogenesis Are Up-regulated in Ankrd26 MT MEFs
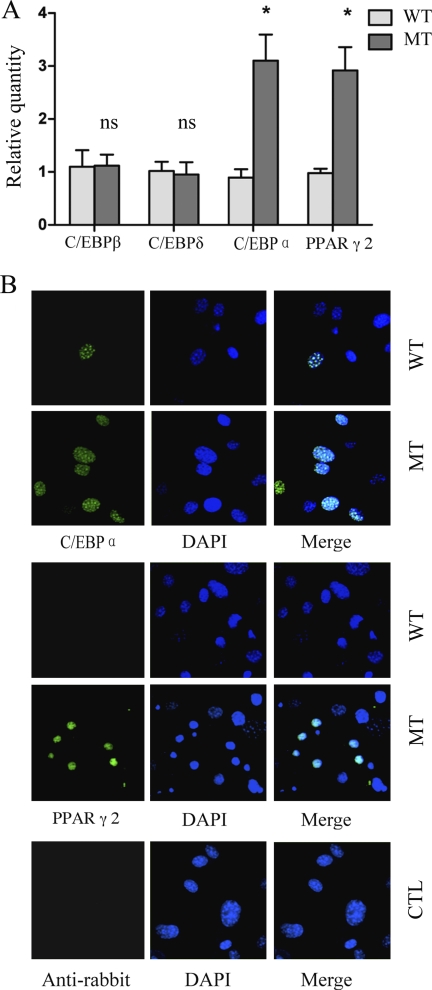
To understand how spontaneous adipogenesis occurred in cells grown for 10 days after confluence without inducers, we measured the expression of genes involved in the induction of adipogenesis and found that mRNA levels of C/EBPα and PPARγ were increased in the MT MEFs, with no change in C/EBPβ and C/EBPδ (Fig. 3A). To determine whether the changes in RNA expression also resulted in elevated protein levels and to determine how many cells were affected, we performed immunofluorescence studies. As shown in Fig. 3B, both C/EBPα and PPARγ proteins are readily detectable in the nuclei of these cells, and the frequency of positive cells is much higher in mutant MEFs than the WT MEFs. These results together with the RT-PCR data indicate that the low level of spontaneous adipogenesis of MT MEFs is likely to be a consequence of increased expression of C/EBPα and PPARγ in selected cells in the population.
FIGURE 3.
Up-regulated expression of later stage but not early stage regulators in Ankrd26-disrupted MEFs. A, real-time PCR analysis of C/EBPβ, C/EBPδ, C/EBPα, and PPARγ2 expression in WT and MT MEFs under regular culture 10 days after confluence. Relative quantity of mRNA expression was normalized to β-actin. Bars indicate the mean ± S.D. (error bars). *, p < 0.05, statistically significant difference between WT and MT MEF cells; ns, no statistical difference. B, immunofluorescence of C/EBPα and PPARγ expression in WT and MT MEFs under regular culture 10 days after confluence. There are more C/EBPα and PPARγ nuclear translocated cells found in MT than WT cell types. Cells stained with anti-rabbit secondary antibody only serve as a negative control.
Both Early and Late Stage Adipogenesis Regulators Are Hyperinducible in MT MEFs
To investigate the mechanism of the increased adipogenesis of Ankrd26 mutant cells, we measured the activity of genes that are associated with the adipogenesis cascade after induction with IBMT, using real-time RT-PCR and Western blot analysis.
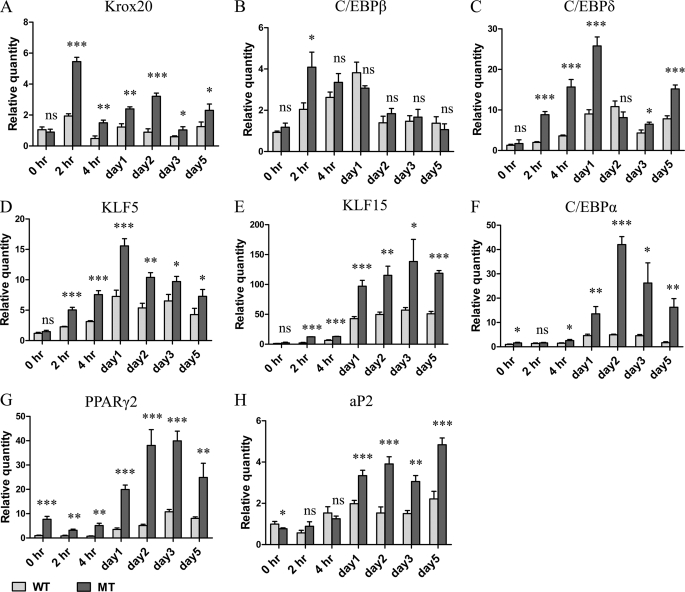
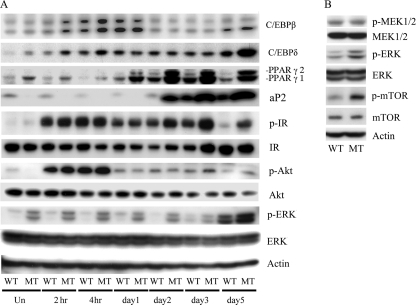
The data in Fig. 4A show that Krox20 mRNA peaks 2 h after induction, the increase is much greater in the mutant cells, and the increased expression relative to the WT MEFs is maintained over the 5 days of induction. C/EBPβ (18) expression (Figs. 4B and 5A) was also increased 2 h after induction and remained elevated for several days. The mRNA and the protein level in the mutant cells peaked at the 2- and 4-h time points and then decreased to levels similar to the WT MEFs.
FIGURE 4.
Real-time PCR analysis of adipogenesis regulators during differentiation induction. MEFs 8 days after confluence were treated with standard differentiation medium, IDMT for 3 days followed by regular DMEM for another 2 days. At the indicated time points cells were collected for RNA isolation and subjected to real-time PCR analysis. Bars represent the mean ± S.D. (error bars) of relative amount of mRNA expression normalized to β-actin. *, p < 0.05 significant statistical difference; **, p < 0.01 significant statistical difference; ***, p < 0.001 significant statistical difference; ns, no significant statistical difference at p < 0.05. Data are representative of at least two independent experiments.
FIGURE 5.
Western blot analysis of adipogenic protein expression. A, Western blot time course analysis of adipogenesis regulator protein expression during differentiation induction. MEFs 8 days after confluence were treated with standard differentiation medium IDMT for 3 days followed by regular DMEM for another 2 days. Total cellular protein was harvested at the indicated times. Equal amounts of cellular protein, 40 μg from each sample, were subjected to Western blot analysis using antibodies specific for the indicated proteins. B, MEK, ERK, and mTOR expression analyzed before induction and MEFs 8 days after confluence.
C/EBPδ, a third early stage marker of adipogenesis (18), was also highly expressed in the mutant cells beginning at the 2-h time point and remained elevated for 5 days. The protein level elevation was detected early after induction but not at later time points except for day 5 (Figs. 4C and 5A). The fourth early stage marker we examined was zinc finger transcription factor KLF5 (10). Similar to the other genes in this group, increased expression was detected at 2 h after induction in the mutant cells, which remained elevated for 5 days (Fig. 4D).
KLF15 is a zinc finger transcription factor expressed in later stages of adipogenesis (15). Real-time PCR data show that KLF15 levels are low before induction and begin to rise in the first few hours after induction (Fig. 4E). Increased expression is detected from day 1 to day 5 after induction, and the MT MEFs have higher expression in all tested time points. A similar pattern of expression was seen with two other key regulators, C/EBPα (Fig. 4F) and PPARγ (Figs. 4G and 5A) (18). aP2 levels were measured and found to be higher in the mutant cells beginning 1–2 days after induction (Fig. 4H). These data suggest that the mutant MEFs had increased levels of several factors that are involved in both early and late stages of adipocyte differentiation.
Higher Number of Adipocyte Stem Cells as Well as Progenitor Cells in Ankrd26 MT MEFs
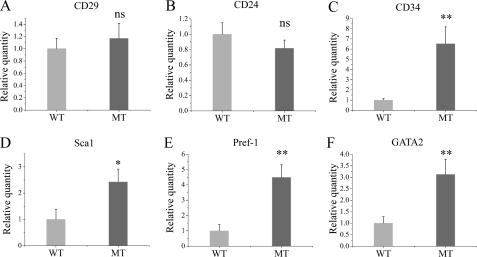
It has been reported that an undifferentiated adipocyte subpopulation of early adipocyte precursor cells that are CD29+, CD34+, Sca-1+, and CD24+ are capable of proliferating and differentiating into mature adipocytes in vitro and in vivo (19). We analyzed the expression of these genes in mutant and WT MEFs. Fig. 6 shows that CD34 and Sca-1 are expressed at higher levels in uninduced MT MEFs than in WT cells; we did not detect significant changes in CD29 and CD24. mRNA analysis showed that both preadipocyte markers Pref-1 (20) and Gata2 (21) are also expressed at higher levels in MT than in WT MEFs (Fig. 6, E and F). Combined, these results indicate that Ankrd26 gene disruption gives rise to more stem cells and preadipocytes.
FIGURE 6.
Real-time PCR analysis of markers for adipocyte stem cells and preadipocytes. MEFs 8 days after confluence were analyzed for mRNA expression of the indicated markers, normalized to β-actin. Bars represent the mean ± S.D. (error bars) of relative amount of mRNA. Data are representative of three independent experiments. *, p < 0.05 significant statistical difference; **, p < 0.01 significant statistical difference; ns, no significant statistical difference at p < 0.05.
Increased ERK Phosphorylation in Ankrd26 MT MEFs
It was well known that ERK signaling is important for adipogenesis. Insulin and cyclic AMP have been found to activate ERK (22, 23). We analyzed the phosphorylation of ERK, insulin receptor, and Akt before and after induction to see if this pathway had been altered by the Ankrd26 mutation. Fig. 5A shows that the level of phospho-ERK is higher in MT MEFs than in the WT MEFs with no change in the level of total ERK. This increase in phosphorylation was present before induction and lasted until day 5 post-induction (Fig. 5A) showing that the ERK pathway remains activated during the induction process. To determine the cellular distribution of activated p-ERK in uninduced mutant MEF, we performed immunofluorescence analysis using anti-p-ERK antibodies. As expected, we found positive staining in the mutant MEF, and the signal is distributed in the cytoplasm as well as in the nucleus. The signal is not detectable in the WT MEF (supplemental Fig. 1). Because ERK phosphorylation was increased, we also investigated the phosphorylation status of other important regulators. As shown in Fig. 5B, p-mTOR was elevated in mutant uninduced MEFs compared with WT MEFs. In contrast, we did not find an increase in phosphorylation of the insulin receptor, Akt, or MEK1/2 (Fig. 5B).
ERK Inhibitor Effect on Adipogenesis of Ankrd26 Gene-disrupted MEFs
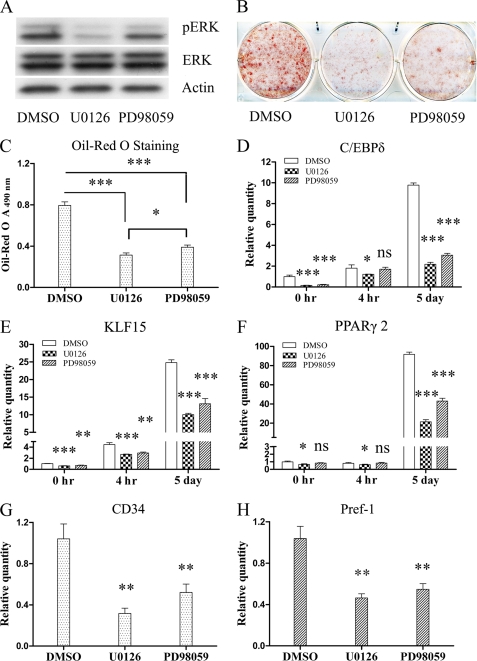
ERK1/2 MAPK is known to play important roles in adipogenesis; several earlier studies reported ERK activation promotes adipogenesis (7, 22, 24, 25), although there are other reports that it inhibits adipogenesis (26, 27). We hypothesized that the constitutively activated ERK contributes to adipogenesis. Because ERK is activated by MEK, we tested this hypothesis using MEK inhibitors, U0126 at 30 μm and PD98059 at 40 μm, to determine whether they could prevent ERK phosphorylation or MEFs differentiation. Fig. 7A shows that both compounds blocked ERK phosphorylation, although U0126 was more potent than PD98059, and the photograph in Fig. 7B shows that both these agents were inhibitors of adipogenesis with U0126 being more active. We quantified the amount of lipid produced and found that there was a significant decrease in total lipid production when the MEK inhibitors were present (Fig. 7, B and C). We also measured the expression level of several genes important for differentiation and found that inhibition of ERK phosphorylation significantly suppressed their expression. C/EBPδ expression was decreased both before and 5 days after induction (Fig. 7D). The expression of KLF15 (Fig. 7E) was partially suppressed before induction as well as 4 h and 5 days after induction, and PPARγ2 (Fig. 7F) was significantly reduced on day 5 after induction. What was of particular interest to us was that inhibition of ERK phosphorylation also suppressed expression of the adipocyte stem cell marker CD34 (Fig. 7G) and preadipocyte marker Pref-1 (Fig. 7H). The expression of both these genes is elevated in the uninduced MT MEFs. These data indicate that Ankrd26 gene disruption enhances adipogenesis of MEFs at least partly through constitutive ERK activation, and this activation contributes to enhanced adipogenesis at both the differentiation and commitment steps.
FIGURE 7.
Effect of ERK inhibition on adipogenesis of Ankrd26-disrupted MEFs. Ankrd26-disrupted MEF cells were treated with MEK inhibitors U0126 at 30 μm or PD98059 at 40 μm from day 1 of plating to the end of adipogensis induction; MT MEFs treated with dimethyl sulfoxide (DMSO) serve as a negative control. Adipogenesis induction was performed 8 days after confluence. A, Western blot of phospho-ERK and ERK, with β-actin loading control. B, oil red O staining of MT MEFs treated with dimethyl sulfoxide, U0126, or PD98059. C, measurement of oil red O staining. Bars indicate mean ± S.D. (error bars) of oil red O. D–H, real-time analysis of genes expression at indicated time points; bars indicate mean ± S.D. relative quantity expression normalized to β-actin. D–F were analyzed at the indicated time points, G–H were analyzed only before induction at day 8 after confluence. *, p < 0.05 significant statistical difference; **, p < 0.01 significant statistical difference; ***, p < 0.001 significant statistical difference; ns, no significant statistical difference at p < 0.05.
DISCUSSION
In this report we show that adipogenesis is greatly enhanced in Ankrd26-disrupted MEFs. There is a small increase in adipogenesis in MT MEFs prior to induction and a very large increase after induction. These results indicate that Ankrd26 is a novel regulator of adipogenesis in MEFs.
Our analysis of the genes and proteins expressed in mutant fibroblasts before induction showed that C/EBPα and PPARγ, two late stage regulators of adipogenesis, were both up-regulated. It is generally accepted that PPARγ and C/EBPα are two principal players in the adipogenesis cascade, and adipogenesis does not occur in either PPARγ- or C/EBPα-deficient mesenchymal stem cells (11, 12, 26, 27). On the other hand, constitutive expression of active PPARγ2 led to adipogensis in the absence of standard differentiating medium or any exogenous PPARγ ligand (28); thus, spontaneous adipogensis of Ankrd26-disrupted MEFs might result from PPARγ or C/EBPα up-regulation and activation (nuclear translocation). Also in support of this hypothesis, we found that the PPARγ agonist TROG alone induced adipogensis in MT MEFs, but not in WT MEFs.
The addition of inducers to the Ankrd26-disrupted fibroblasts caused a rapid increase in several early stage adipogenesis regulators. Krox20, C/EBPβ, C/EBPδ, and KLF5 were all significantly elevated compared with normal MEFs. Late stage regulators of adipogenesis (KLF15, C/EBPα, PPARγ, and aP2) were also much higher in induced MT MEFs than induced WT MEFs. These findings indicate that the mutant cells are very sensitive to hormonal stimulation as well and display a low level of spontaneous adipogenesis. It has been shown that in the adipogenesis program there is a commitment step that occurs before adipocyte differentiation. In this study, we found that the adipocyte stem cell markers CD34 and Sca-1 and the preadipocyte markers Pref-1 and Gata2 were up-regulated in Ankrd26-disrupted MEFs. These results suggest that Ankrd26 is a previously unidentified factor that participates in the regulation of commitment of adipocyte precursors.
We analyzed uninduced MT MEFs looking for differences that could help explain their sensitivity to adipocyte formation and found that p-ERK as well as p-mTOR were elevated in the mutant cells (Fig. 5B). ERK1/2 MAPKs are believed to play an important role in adipogenesis, although there are conflicting reports on the role of ERK. Some authors concluded that ERK activation promotes adipogenesis (7, 22, 24, 25) whereas others concluded that it inhibits (26, 27). There is also a study showing that adipogenesis requires appropriately timed ERK activation of a measured intensity. Too much or too little ERK activation was shown to disrupt the efficient activation of transcription factors critical to the adipogenic program (29). In this report, ERK was constitutively activated in MT MEFs, whereas other phospho-proteins (insulin receptor, Akt, and MEK) were not. ERK is known to be activated by MEK. Because we did not find an increase in MEK phosphorylation, the increased phosphorylation of ERK could be due to a decrease in the activity of a phosphatase that dephosphorylates ERK or by phosphorylation of ERK by an unidentified protein kinase. It has also been reported that ERK plays an important role in retinoic acid-mediated embryonic stem cell commitment into the adipocyte lineage (14) and that RA is a potential mediator of S6K1 activation during early adipocyte development (17). Therefore, ERK might also be required for S6K1-mediated adipocyte lineage commitment.
In this study, we showed that we could prevent ERK phosphorylation by inhibiting MEK using U0126 or PD98059 in Ankrd26 gene-disrupted MEFs, and this was associated with a decreased expression of the adipocyte marker CD34 and the preadipocyte marker Pref-1. This result supports the proposal that Ankrd26 disruption could facilitate preadipocyte commitment via constitutive activation of ERK. However, the partial effect of the MEK inhibitors on adipogenic induction could be due to the involvement of other signaling pathways. It is possible that the mTOR pathway is also involved because we found that the level of p-mTOR was increased in the mutant fibroblast.
In our previous report we described an increased p-Akt level in the mutant heart (2). Although several lines of evidence have implicated the PI3K/Akt pathway as a positive regulator of adipogenic differentiation of murine preadipocyte (30–32), we did not find any difference in p-Akt levels between the mutant and the WT MEFs, suggesting that Ankrd26 regulates the signaling pathway in a tissue-specific manner.
The detailed mechanism by which Ankrd26 enhances adipogenesis, as well as the phenotypic relevance of the Ankrd26 knock-out mice to human metabolic syndrome, is still unclear and needs further investigation. The Ankrd26 protein is large and contains several different motifs, suggesting it can interact with several different proteins. We have begun to investigate proteins that bind to Ankrd26 using the yeast two-hybrid system and have identified several interacting proteins. We are now engaged in validating that these interactions occur in mouse and human cells.
Supplementary Material
Acknowledgments
We thank Steve Neal for help in preparing the figures and Dawn A. Walker and Jaime Eberle for help with the manuscript.
This work was supported, in whole or in part, by the Intramural Research Program of the National Institutes of Health, National Cancer Institute, Center for Cancer Research.

The on-line version of this article (available at http://www.jbc.org) contains supplemental Table 1 and Fig. 1.
G. A. Raciti, T. K. Bera, O. Gavrilova, and I. Pastan, unpublished observations.
- PPARγ
- peroxisome proliferator-activated receptor γ
- C/EBP
- CCAAT enhancer-binding protein
- DEX
- dexamethasone
- IBMX
- 3-isobutyl-1-methylxanthine
- IDMT
- insulin, DEX, IBMX, TROG
- MEF
- mouse embryo fibroblast
- MT
- mutant
- mTOR
- mammalian target of rapamycin
- TROG
- troglitazone.
REFERENCES
- 1. Haslam D. W., James W. P. (2005) Lancet 366, 1197–1209 [DOI] [PubMed] [Google Scholar]
- 2. Bera T. K., Liu X. F., Yamada M., Gavrilova O., Mezey E., Tessarollo L., Anver M., Hahn Y., Lee B., Pastan I. (2008) Proc. Natl. Acad. Sci. U.S.A. 105, 270–275 [DOI] [PMC free article] [PubMed] [Google Scholar]
- 3. Hahn Y., Bera T. K., Pastan I. H., Lee B. (2006) Gene 366, 238–245 [DOI] [PubMed] [Google Scholar]
- 4. Bera T. K., Saint Fleur A., Lee Y., Kydd A., Hahn Y., Popescu N. C., Zimonjic D. B., Lee B. K., Pastan I. (2006) Cancer Res. 66, 52–56 [DOI] [PubMed] [Google Scholar]
- 5. Liu X. F., Bera T. K., Liu L. J., Pastan I. (2009) Apoptosis 14, 1237–1244 [DOI] [PMC free article] [PubMed] [Google Scholar]
- 6. Carnevalli L. S., Masuda K., Frigerio F., Le Bacquer O., Um S. H., Gandin V., Topisirovic I., Sonenberg N., Thomas G., Kozma S. C. (2010) Dev. Cell 18, 763–774 [DOI] [PMC free article] [PubMed] [Google Scholar]
- 7. Tang Q. Q., Otto T. C., Lane M. D. (2003) Proc. Natl. Acad. Sci. U.S.A. 100, 44–49 [DOI] [PMC free article] [PubMed] [Google Scholar]
- 8. Rosen E. D., Walkey C. J., Puigserver P., Spiegelman B. M. (2000) Genes Dev. 14, 1293–1307 [PubMed] [Google Scholar]
- 9. Linhart H. G., Ishimura-Oka K., DeMayo F., Kibe T., Repka D., Poindexter B., Bick R. J., Darlington G. J. (2001) Proc. Natl. Acad. Sci. U.S.A. 98, 12532–12537 [DOI] [PMC free article] [PubMed] [Google Scholar]
- 10. Farmer S. R. (2006) Cell Metab. 4, 263–273 [DOI] [PMC free article] [PubMed] [Google Scholar]
- 11. Hishida T., Nishizuka M., Osada S., Imagawa M. (2009) Biochimie 91, 654–657 [DOI] [PubMed] [Google Scholar]
- 12. Zhang J. W., Tang Q. Q., Vinson C., Lane M. D. (2004) Proc. Natl. Acad. Sci. U.S.A. 101, 43–47 [DOI] [PMC free article] [PubMed] [Google Scholar]
- 13. Oishi Y., Manabe I., Tobe K., Tsushima K., Shindo T., Fujiu K., Nishimura G., Maemura K., Yamauchi T., Kubota N., Suzuki R., Kitamura T., Akira S., Kadowaki T., Nagai R. (2005) Cell Metab. 1, 27–39 [DOI] [PubMed] [Google Scholar]
- 14. Chen Z., Torrens J. I., Anand A., Spiegelman B. M., Friedman J. M. (2005) Cell Metab. 1, 93–106 [DOI] [PubMed] [Google Scholar]
- 15. Mori T., Sakaue H., Iguchi H., Gomi H., Okada Y., Takashima Y., Nakamura K., Nakamura T., Yamauchi T., Kubota N., Kadowaki T., Matsuki Y., Ogawa W., Hiramatsu R., Kasuga M. (2005) J. Biol. Chem. 280, 12867–12875 [DOI] [PubMed] [Google Scholar]
- 16. Kim K. A., Kim J. H., Wang Y., Sul H. S. (2007) Mol. Cell. Biol. 27, 2294–2308 [DOI] [PMC free article] [PubMed] [Google Scholar]
- 17. Wang W., Huang L., Huang Y., Yin J. W., Berk A. J., Friedman J. M., Wang G. (2009) Dev. Cell 16, 764–771 [DOI] [PMC free article] [PubMed] [Google Scholar]
- 18. Rangwala S. M., Lazar M. A. (2000) Annu. Rev. Nutr. 20, 535–559 [DOI] [PubMed] [Google Scholar]
- 19. Rodeheffer M. S., Birsoy K., Friedman J. M. (2008) Cell 135, 240–249 [DOI] [PubMed] [Google Scholar]
- 20. Wang Y., Kim K. A., Kim J. H., Sul H. S. (2006) J. Nutr. 136, 2953–2956 [DOI] [PubMed] [Google Scholar]
- 21. Tong Q., Tsai J., Hotamisligil G. S. (2003) Drug News Perspect. 16, 585–588 [DOI] [PubMed] [Google Scholar]
- 22. Prusty D., Park B. H., Davis K. E., Farmer S. R. (2002) J. Biol. Chem. 277, 46226–46232 [DOI] [PubMed] [Google Scholar]
- 23. Petersen R. K., Madsen L., Pedersen L. M., Hallenborg P., Hagland H., Viste K., Døskeland S. O., Kristiansen K. (2008) Mol. Cell Biol. 28, 3804–3816 [DOI] [PMC free article] [PubMed] [Google Scholar]
- 24. Belmonte N., Phillips B. W., Massiera F., Villageois P., Wdziekonski B., Saint-Marc P., Nichols J., Aubert J., Saeki K., Yuo A., Narumiya S., Ailhaud G., Dani C. (2001) Mol. Endocrinol. 15, 2037–2049 [DOI] [PubMed] [Google Scholar]
- 25. Sale E. M., Atkinson P. G., Sale G. J. (1995) EMBO J. 14, 674–684 [DOI] [PMC free article] [PubMed] [Google Scholar]
- 26. Font de Mora J., Porras A., Ahn N., Santos E. (1997) Mol. Cell. Biol. 17, 6068–6075 [DOI] [PMC free article] [PubMed] [Google Scholar]
- 27. Hu E., Kim J. B., Sarraf P., Spiegelman B. M. (1996) Science 274, 2100–2103 [DOI] [PubMed] [Google Scholar]
- 28. Li Y., Lazar M. A. (2002) Mol. Endocrinol. 16, 1040–1048 [DOI] [PubMed] [Google Scholar]
- 29. Kortum R. L., Costanzo D. L., Haferbier J., Schreiner S. J., Razidlo G. L., Wu M. H., Volle D. J., Mori T., Sakaue H., Chaika N. V., Chaika O. V., Lewis R. E. (2005) Mol. Cell. Biol. 25, 7592–7604 [DOI] [PMC free article] [PubMed] [Google Scholar]
- 30. Tomiyama K., Nakata H., Sasa H., Arimura S., Nishio E., Watanabe Y. (1995) Biochem. Biophys. Res. Commun. 212, 263–269 [DOI] [PubMed] [Google Scholar]
- 31. Kohn A. D., Summers S. A., Birnbaum M. J., Roth R. A. (1996) J. Biol. Chem. 271, 31372–31378 [DOI] [PubMed] [Google Scholar]
- 32. Yu W., Chen Z., Zhang J., Zhang L., Ke H., Huang L., Peng Y., Zhang X., Li S., Lahn B. T., Xiang A. P. (2008) Mol. Cell Biochem. 310, 11–18 [DOI] [PubMed] [Google Scholar]
Associated Data
This section collects any data citations, data availability statements, or supplementary materials included in this article.


