Abstract
We demonstrate the capability of a new generation adaptive optics scanning laser ophthalmoscope (AOSLO) to resolve cones and rods in normal subjects, and confirm our findings by comparing cone and rod spacing with published histology measurements. Cone and rod spacing measurements are also performed on AOSLO images from two different diseased eyes, one affected by achromatopsia and the other by acute zonal occult outer retinopathy (AZOOR). The potential of AOSLO technology in the study of these and other retinal diseases is illustrated.
OCIS codes: (010.1080) Active or adaptive optics, (170.0110) Imaging systems, (170.4460) Ophthalmic optics and devices, (170.4470) Ophthalmology
1. Introduction
In 1997, Liang et al. reported the first retinal imaging system equipped with adaptive optics (AO), showing high resolution images from retinas of several healthy subjects where the cone photoreceptor mosaic was clearly identified at different eccentricities [1]. Although the cone photoreceptor mosaic had been observed before without the use of AO [2], using this technique increased the resolution of the images obtained compared to those of traditional fundus cameras.
AO imaging has been since widely used due to its potential to resolve microscopic structure in the in vivo human retina, and it has been successfully combined with scanning laser ophthalmoscopy (SLO) and optical coherence tomography (OCT) [3–7]. AO ophthalmoscopy systems have been used to study and characterize normal human retina [8–12], to characterize changes in retinal structure caused by several different degenerative retinal diseases [13–23], and to assess progression of these diseases and responses to treatment [24].
Although the improvement in image quality produced with AO enhanced systems is clearly established [1,3–7], it seems to have fallen behind the theoretical predictions of image resolution for aberration-free systems. Aberration-free systems are diffraction-limited, and therefore only the numerical aperture of the eye limits the resolution of the images obtained using them. In this sense, some retinal features such as foveal cones and rod photoreceptors should be visible when imaged using AO-enhanced systems if the pupil size of the subject imaged is large enough. Ongoing efforts to increase image quality of data obtained using AO enhanced systems have employed post-acquisition image processing, AO loop control development and the use of complex AO systems using more than one wavefront corrector [25–27].
In this article the results obtained with a new generation adaptive optics scanning laser ophthalmoscope (AOSLO) system are reported. In this system the optical design has been meticulously developed to minimize astigmatism in the pupil plane. To demonstrate its enhanced performance, the system has been used to image normal subjects and patients with retinal disease. This article presents data related to images of cone photoreceptors and structures that appear consistent with rod photoreceptors.
2. Optical design
In the new generation AOSLO system described here, the optical design has been based on that developed by Zhang et al. [28], which is shown in Fig. 1a . Usually, SLO systems are built using spherical mirrors rather than lenses. In this manner, back reflections from optical elements of the system are eliminated, avoiding their effect on the wavefront sensor measurements. However, in order to use spherical mirrors the light beam hits these elements at a certain angle with respect to the optical axis, introducing astigmatism in the beam. In traditional designs of retinal imaging systems, like the one shown in Fig. 1a, this incident angle is always contained in the same plane as the beam travels through the different optical elements. Astigmatism builds up after each reflection on a spherical mirror, and it is corrected at the eye pupil plane along with the subject’s prescription by means of trial lenses (TL in Fig. 1a). The back reflections of these trial lenses and the cornea are filtered by means of an iris labeled RF in Fig. 1a.
Fig. 1.
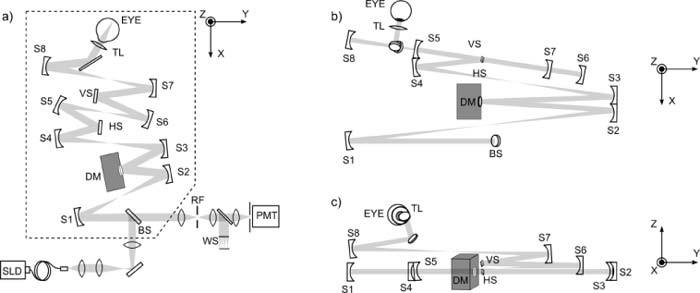
a) Optical design for a traditional AOSLO system with all the optical elements arranged along the same plane [28]. b) and c) show the optical design of the system presented in this paper from the light delivery beam and collection beam splitter (BS) to the eye. In b) and c) the beam reaches the different optical elements in the same order as in a), so the labels can help understand the light path. In b) and c) the optical elements are not arranged in just one plane, but they are placed at different heights. b) shows the projection of the system on the xy plane, and c) shows the same design projected on the yz plane.
Astigmatism generated by beam reflections on a spherical mirror with incident angles in perpendicular planes have opposite signs. Therefore, by alternating the incident angle plane from horizontal to vertical, the overall astigmatism can be reduced [29]. Some systems have already been built alternating the incident angle plane to avoid astigmatism build up [30–32]. The system presented in this paper was designed using this concept. The angles of incidence of the beam on the spherical mirrors were optimized using Zemax (Bellevue, WA, USA) to avoid astigmatism build up. Although alternating horizontal and vertical angles of incidence would be the ideal case [29], the size of the deformable mirror box did not allow for this possibility with the focal lengths of the spherical mirrors used. Figure 1b) and c) show the resulting optimized design, used to obtain the results presented in this paper. The first two telescopes (formed by S1-S2, both of 200mm focal length, and S3-S4, of 200mm and 100mm focal length respectively) are contained in the xy plane, while the rest (S5-S6, of 100mm and 150 mm focal length respectively, and S7-S8 of 100mm and 200mm focal length respectively) are contained in the yz plane, perpendicular to the previous one. Since the design does not fall on a plane, two different projections are presented in Fig. 1b) along the xy plane and Fig 1c) along the yz plane. Also, for the purpose of clarity, the light delivery and collection arms are not represented in Figs. 1b) and 1c), since no changes were introduced with respect to the design shown in Fig. 1a).
A consequence of avoiding astigmatism build up, as opposed to relying on its correction in the pupil plane using a trial lens, is an increase in the quality of the image of the pupil plane onto the wavefront sensor. The reconstruction of the wavefront of the probing beam should therefore be more accurate, and the quality of AO correction improved. The absence of astigmatism build up also reduces beam-wandering in the pupil plane. Beam wandering blurs the image of the wavefront pattern on the wavefront sensor, and reducing it improves the fidelity of the wavefront measurement.
As a consequence of optical design improvement, the size of the confocal pinhole was reduced in this system with respect to the system from Zhang et al. [28], from 75μm to 25μm. This translates into an increase in the contrast of the acquired images due to better confocality of the system, and better resolution.
The deformable mirror used is a 140 actuator, 5.5μm maximum stroke MEMS mirror (Boston Micromachines, Cambridge, MA, USA). The high number of actuators in this deformable mirror allows good matching of the shape of the mirror with the wavefront measured by the wavefront sensor.
The wavelength of the illuminating beam chosen was 830nm. Although a shorter wavelength would produce a smaller diffraction spot, near infrared wavelengths such as the one chosen are much more comfortable for the subject under study. This is a very important point since imaging sessions are long and the results are better if the subject is comfortable, especially when they are not experienced in the imaging process. The optical power reaching the cornea was 300μW, which is more than 10 times below the maximum permissible exposure (MPE) set by the ANSI laser safety standards for a system like the one described.
According to the Rayleigh criterion, the resolution for a diffraction-limited imaging system like the one described here where the pupil is limited to a 6mm circle in the plane of the eye pupil, the lateral resolution would be of 2.8μm.
There are a series of very important constraints that rule the optical design of the system described in this article. These constraints are mainly related to the system size, since it was conceived to be deployed in a clinical environment. The focal lengths of the spherical mirrors used in this system have been doubled with respect to those of Zhang et al. [28] in order to remove astigmatism build up in the plane where the pupil of the eye is placed. However, the new focal lengths allow all the optics to fit on a 600x600mm plate. This characteristic provides the system with the versatility needed in terms of mobility and space occupied, as these two qualities are very desirable in a clinical environment. Better image quality could be achieved if such constraints were not present, as has been shown recently by Dubra et al. [31,32]. However, the authors believe that the compromise reached between size and performance of the system is very satisfactory.
The system is at this moment being used routinely to image both normal subjects and patients with retinal diseases in a clinic environment.
3. Image acquisition methods
All research procedures described in this article were performed in accordance with the Declaration of Helsinki. The study protocol was approved by the institutional review boards of the University of California, San Francisco and the University of California at Berkeley. All subjects gave written informed consent before participation in the studies.
Pupils of 3 normal subjects were dilated with 1% tropicamide and 2.5% phenylephrine prior to AOSLO imaging. Videos of small patches (0.7° to 1.2° size squares) of the subjects’ retinas at different locations were recorded at 30 frames per second. Single frames of these videos were warped due to sinusoidal scanning in the horizontal axis from the resonant scanner used. The images were de-warped and scaled using images of a characterized model eye with MATLAB (MathWorks, Natik, MA, USA) software developed by Dubra et al. [33]. Involuntary eye movements were also corrected in order to average a number of stabilized images and reduce noise [34]. The number of images averaged to reduce noise depended on the subject, but more than 30 images were usually used. Images of different areas of the retina were then assembled together after averaging to create a montage of a retinal area that covered up to 13° eccentricity from the central fovea.
4. Study of normal healthy eyes
Montages from 3 different subjects were generated using the methods described in the previous section. Subjects were 22 to 34 years old, 1 male and 2 female. 2 of them did not wear glasses, and the third one needed a spherical correction of −3.25 diopters.
Figure 2 shows cone spacing measurements from these montages at different eccentricities. Cone spacing was calculated as described by Rodieck [16,36], and in order to transform angular separation in the retina into distances the assumption of 289 μm/deg was followed [37,38]. The error bars show the range of cone-to-cone distances that include 95% of the measurements performed. The same method was used to characterize cone spacing from histological images from Curcio et al. [35]. Also, average cone density measurements obtained from histological images by Curcio et al. were used to calculate cone spacing at different eccentricities. No error bars could be determined for these data.
Fig. 2.
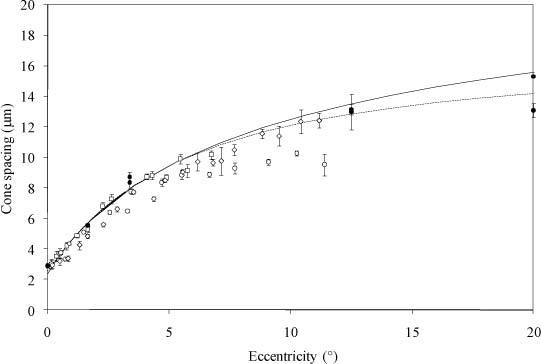
Cone spacing vs eccentricity: 1. Cone spacing computed from AOSLO images of 3 different healthy subjects (◇ nasal direction, □◯ inferior direction); 2. Cone spacing computed from published histological images (black solid circles) by Curcio et al. [35]; 3. Cone spacing in the temporal (solid line) and nasal (dotted line) directions inferred from density data reported by Curcio et al. [35].
Since AOSLO images are obtained in vivo, the range of eccentricities where cone spacing can be measured is limited, in contrast to the range of regions that can be studied in histological sections. At high incidence angles, the subject’s pupil becomes effectively elliptical, clipping the probing beam, and obstructing wavefront sensor measurements to determine the aberrations of the eye. Also, oblique incidence in the eye introduces high amounts of astigmatism in the beam which degrade the image quality, making it difficult to obtain cone spacing measurements.
At low eccentricities (up to 10°), cone spacing measurements derived from AOSLO images, histological images and cone density measurements are in agreement. However, differences appear between data derived from histological images and cone density measurements at high eccentricities. Each of the points in the graph showing cone spacing data from histological images is obtained from a particular image of a single subject. However, cone density measurements are averaged over a series of subjects. This may explain the differences between these two sources at high eccentricities. It should be mentioned that AOSLO data presented here was collected at different directions from the fovea including nasal and inferior to the fovea.
The authors believe the results presented in Fig. 2 validate the technique used to calculate cone spacing, and similarly, distance measurements within the retinal images obtained using AOSLO.
Figure 3 shows an image obtained using AOSLO at 7° eccentricity from one of the healthy subjects mentioned above. The image shows the cone mosaic pattern, which has been reported in previous reports from AO systems [39]. Cones in the image present a bright spot in their center, fading to dark toward the edges of the aperture, which is compatible with the lowest order wave-guide mode pattern described by Enoch et al. [40] as HE11 and more commonly labeled as LP01. The space between cones is filled by a smaller structure wherever cones are far enough apart. Histology images show that close-packed mosaics of rod photoreceptors occupy the space between cones at these eccentricities. The spacing between these structures has been determined on AOSLO images for the 3 healthy subjects mentioned above using the same methods described for cone photoreceptors and only using patches of images within which there were no cones. In order to compare this structure to the expected size and spacing of rod photoreceptors, the spacing between rods was also calculated from published histological images from Curcio et al. [35]. In addition, rod spacing was inferred from published rod density measures in the following way: first, the fraction of the retinal surface area occupied by cones was removed from the total area using information of cone diameter at different eccentricities [41]. Then, assuming rods are close-packed in hexagonal geometry to tile the area between cones, the distance between rod photoreceptors was estimated from rod density measurements [35]. These results are displayed in Fig. 4 . This figure shows that the results computed from AOSLO images are in clear agreement with rod spacing measured from histological images. Furthermore, they correspond to recent reports on in-vivo rod imaging [42]. This agreement strengthens the statement that the structures shown in AOSLO images correspond to rod photoreceptors. The discrepancies with rod spacing calculated from density data may be due to two different factors: first, overestimation of the area subtended by cones calculated from cone diameter data, and second, errors related to the packing geometry model chosen. Although hexagonal geometry is close to rod packing geometry, real rods do not always arrange themselves regularly, especially when only a row of rods fits between cones.
Fig. 3.
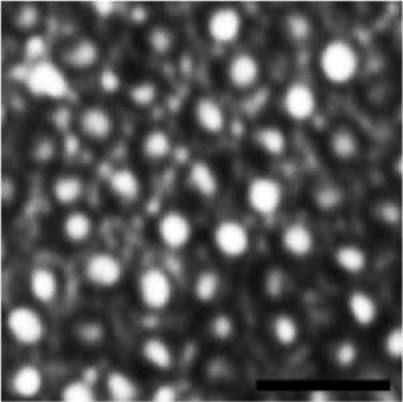
AOSLO retinal image at 7° eccentricity for one of the healthy subjects showing the cone photoreceptor mosaic and a finer structure filling in the space between these cone photoreceptors (scale bar is 20μm).
Fig. 4.
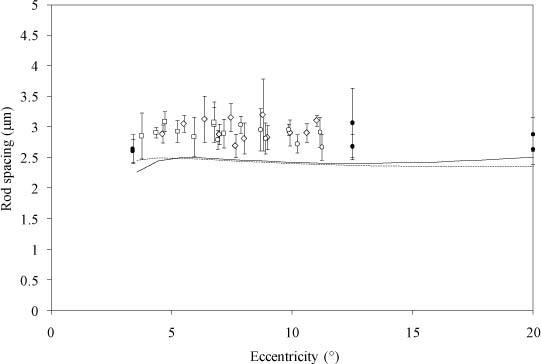
Rod spacing vs eccentricity. 1. Rod spacing computed from AOSLO images of 3 different healthy subjects (◇ nasal direction, □◯ inferior direction); 2. Rod spacing computed from published histological images (black circles) by Curcio et al. [35]; 3. Rod spacing in the temporal (solid line) and nasal (dotted line) directions inferred from rod density published data by Curcio et al. [35].
However, the data presented here clearly shows that the smaller structures visible in AOSLO images do not correspond to cone photoreceptors, and that the data obtained from previously published histological images of rods is compatible in terms of spacing.
5. Study of diseased eyes
5.1. Achromatopsia
The left eye of a 39 year old male patient with incomplete achromatopsia caused by a mutation in the cyclic nucleotide-gated channel, beta 3 (CNGB3) gene was imaged using AOSLO following the procedures described in section 4.
Achromatopsia is a disease characterized by lack of color discrimination, low visual acuity beginning at birth, and nystagmus. Electroretinograms (ERGs) show very little or no cone function. Rod photoreceptors are responsible for visual function. Many genetic causes of achromatopsia have been identified, including mutations in the cyclic nucleotide-gated channel, beta-3 [43].
Genomic DNA was obtained from the patient’s white blood cells. DNA was directly sequenced through the portions of the coding sequences of the CNGA3 and CNGB3 genes that have been previously reported to harbor achromatopsia-causing genetic variations. One homozygous sequence variation was present in the coding sequence of the CNGB3 gene, a homozygous 1 base pair deletion of C at codon 283, predicted to result in a high-penetrance disease-causing sequence variation. Color vision was examined using the Farnsworth Dichotomous Test D-15 [44]. The data were analyzed using a web-based platform scoring method [45], and the error scores were calculated using methods proposed by Bowman [46]. The Total Color Difference Score was 374.9 in the right eye (OD) and 294.8 in the left eye (OS), and the Color Confusion Index (CCI = TCDS actual/TCDS normal) was 3.20 OD and 2.52 OS, consistent with pathologic color discrimination and a diffuse color discrimination error.
Pupils were dilated with 1% tropicamide and 2.5% phenylephrine prior to obtaining OCT and infrared SLO images (Spectralis HRA + OCT Laser Scanning Camera System, Heidelberg Engineering, Vista, CA, USA).
Figure 5 shows images obtained using AOSLO as described in section 3, comparing patches of the retina at different eccentricities for a healthy subject and the patient with achromatopsia. In the OCT image of the patient in Fig. 6 , reflections corresponding to an intact photoreceptor layer (external limiting membrane, ELM, and inner segment/outer segment, IS/OS, junction layers) are present throughout the macular area imaged. These intact structures provide support that the features seen in the AOSLO image are indeed photoreceptors. The figure also shows an OCT image obtained from a normal subject for comparison purposes.
Fig. 5.
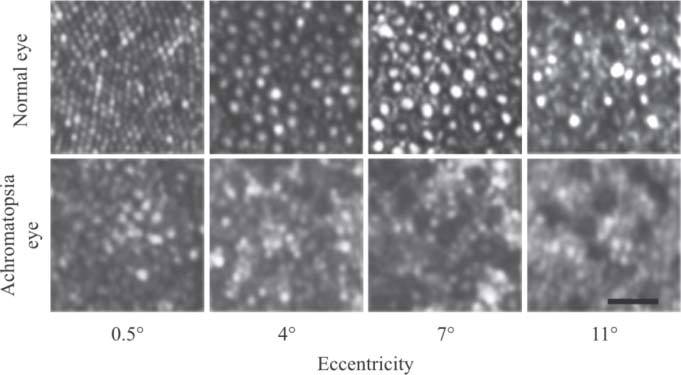
AOSLO retinal images at different eccentricities for a normal subject and a 39 year old patient with achromatopsia. The patient’s prescription on the eye imaged was −4.50sph, +0.50cyl, axis105 deg. Scale bar is 20 μm.
Fig. 6.

OCT image from a normal subject (left) and an achromatopsia patient (right). Due to nystagmus it was difficult to acquire an OCT image at the exact center of the anatomical fovea of the achromatopsia patient. The image presented is the closest to the anatomical fovea that could be acquired. The image shows ELM (bright), IS (dark) and OS (dark) layers visible throughout both images.
Spacing between photoreceptors present in the AOSLO images was calculated at different eccentricities, and the results are shown in Fig. 7 .
Fig. 7.
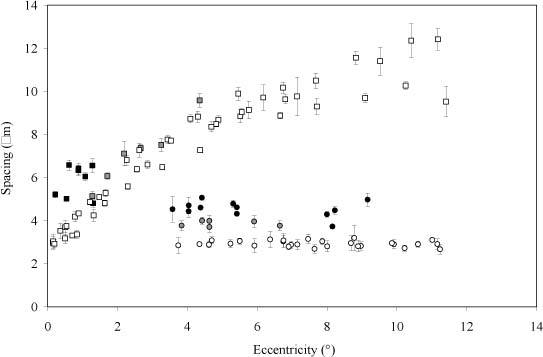
Cone (squares) and rod (circles) spacing calculated from AOLSO images for 3 different healthy subjects (open symbols), a patient with achromatopsia (black filled symbols) and a patient with AZOOR (grey filled symbols).
It is possible that the photoreceptors at the anatomic fovea are abnormal cones, since the patient perceived some color vision. However, Fig. 7 shows spacing for these cone photoreceptors is greater than normal at corresponding eccentricities. Also, the fovea in the AOSLO montage appeared darker than what is typically observed in normal subjects. The cause for this could perhaps be the fact that photoreceptors in that area are not normal cones, or because other factors may influence photoreceptor reflectivity in achromatopsia.
Figure 5 shows dark spots evident at eccentricities 7° and 11°. These dark spots are observed throughout the retina and, although they may represent cones, they are too far apart to be considered normally spaced. The low reflectivity areas observed in AOSLO images may be a consequence of diffuse abnormalities of cone function and structure caused by mutation in the CNGB3 gene [47]. Figure 7 also shows photoreceptor spacing calculated for larger eccentricities. In this case spacing is too small for the photoreceptor cells identified to be considered cones, as reported by Carroll et al. [47], and the cells imaged are more consistent with rods, albeit with larger spacing.
From all the data compiled, the scenario is compatible with the patient having abnormal cones at the anatomical fovea that have increased spacing and reduced density compared with normal subjects. However, the cones retain some function, which provide the patient with residual, but abnormal, color vision. These abnormal cones are not as reflective as normal cones, which is compatible with the fact that the patient’s fovea is darker than that of normal subjects studied using AOSLO. Also, low reflectivity of abnormal cones would appear at higher eccentricities as dark spots, also observed in AOSLO images. Finally, the measurements of photoreceptor spacing in the current image show structures that are larger than normal rods, although smaller than normal cones.
Histological studies on achromatopsia have come to different conclusions as to whether central photoreceptors in patients with achromatopsia represent abnormal foveal cones or rods [48–50]. The findings in this paper are compatible with the conclusion that abnormal cones are observed in the fovea of this patient, and that photoreceptors imaged in the retinal periphery are most likely rods with abnormally increased spacing [48].
5.2. AZOOR
Acute zonal occult outer retinopathy (AZOOR) is a rare disease characterized by focal photoreceptor abnormalities, in which photoreceptors may be present but have abnormal function [51,52]. Patients report an acute onset of scotoma, also associated with photopsia, and often the scotoma has been observed to grow, usually up to a period of six months. Some reports conclude that the cause of the visual field loss is related to degeneration of the photoreceptor outer segments, and that they are detectable in OCT images as irregularities or absence of the IS/OS junction layer [53–55].
The left eye of a patient that was diagnosed with AZOOR was studied. This 46 year old woman presented with acute onset of photopsias within a relative scotoma beginning from 4 to 6 degrees nasal to fixation in the left eye. Figure 8 shows the visual field (Pattern Deviation plots, Humphrey 30-2, Carl Zeiss Meditec AG) as well as imaging results. OCT images of this eye showed reflections of the ELM and the IS/OS junction through the relative scotoma. Although the reflections were decreased in intensity within the relative scotoma, their presence was consistent with the presence of a contiguous array of waveguiding photoreceptors. AOSLO images at different eccentricities were also acquired as detailed in section 3 on the area of the retina corresponding to the OCT scan shown in Fig. 8. Some patches of the montage assembled with these images are shown in Fig. 9 . Areas outside the relative scotoma (in this case 1.5° and 2.5°) show a typical photoreceptor mosaic, also seen in the pictures of a normal eye in Fig. 5. However, images within the relative scotoma (6° and 7° in this case), do not show the usual mosaic structure. The cone mosaic appears normal around the relative scotoma, but is not seen within it. The edge of the area of the relative scotoma was imaged and is shown in the bottom image of Fig. 9. The interface between the areas with and without cones is very well-defined.
Fig. 8.
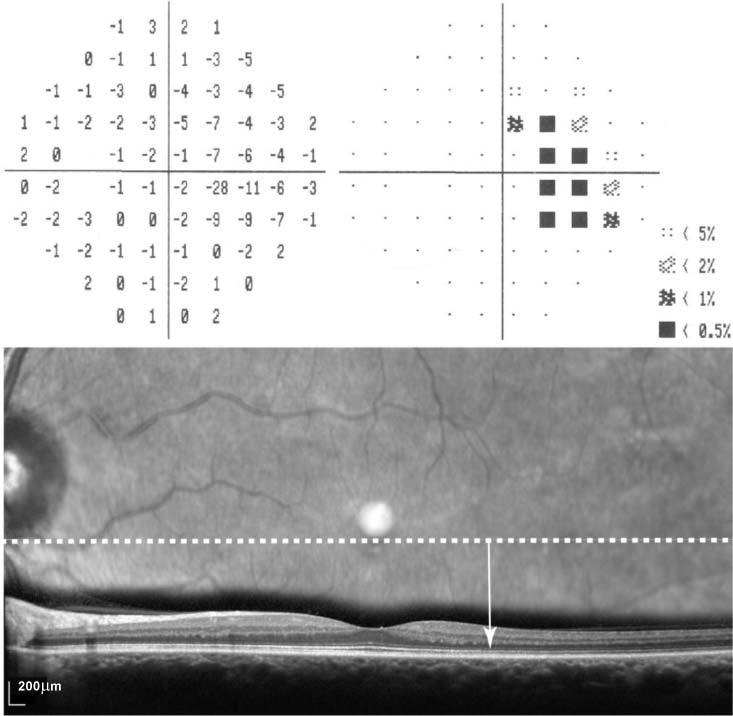
Visual field, infrared scanning laser ophthalmoscope image and OCT B-scan of an AZOOR patient. The two visual fields on the top panel show the deviation from normal (pattern deviation) over a 60 degree visual field. The numbers on the left field indicate the sensitivity difference from normal in decibels. The right field plots the probability that the visual sensitivity is part of a normal distribution. The relative scotoma starts between 4 and 6 degrees to the right of the fovea. The SLO fundus image (middle panel) spans 30 degrees and the location of the OCT B-scan (bottom panel) is indicated by the dashed white line. The arrow at 4.5 degrees corresponds to the point beyond which the regular mosaic of cones is no longer visible (Fig. 9). The OCT B-scan shows reflections, corresponding to an intact ELM and IS/OS junction, that persist into the relative scotoma, although the magnitude of the reflection is reduced.
Fig. 9.
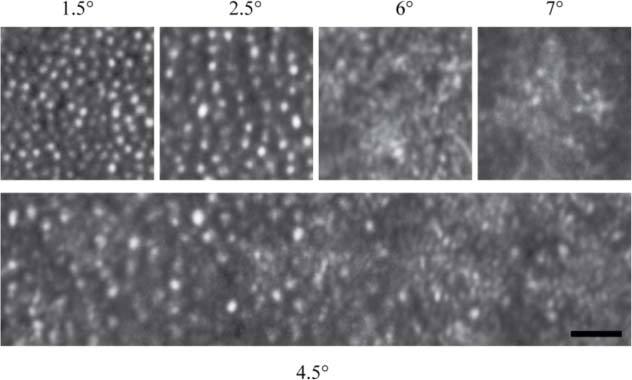
AOSLO images from an eye of a 46 year old female patient affected by AZOOR. The top images correspond to 4 different eccentricities. Images at 1.5° and 2.5° eccentricity are outside the scotoma, while images at 6° and 7° eccentricity are within it. The bottom image, centered at 4.5° eccentricity, corresponds to the edge of the area where cones are not visible. The patient’s prescription was −1.50 sph, +1.25 cyl, axis 90 deg. Scale bar is 20μm.
Cone spacing was calculated in regions of the AOSLO montage, and the results are shown in Fig. 7. Cones appear normally spaced outside the relative scotoma, and correspond to retinal regions with normal visual function. Within the relative scotoma, cones are not visualized, and the spacing of the visible structures corresponds better with spacing from rods of healthy eyes, although with increased spacing. This suggests that, in this patient with AZOOR, significant loss of cone photoreceptors within the relative scotoma has occurred, while the rods have remained relatively unaffected. The increased spacing of the rods compared to normal may have occurred because they have spread out to fill in the spaces left behind by degenerated cones. A more extensive report of this and other AZOOR patients, including functional and structural testing, is part of a second manuscript [56].
6. Conclusion
Results obtained using a new generation AOSLO system to study healthy and diseased eyes are presented. Data related to cone spacing compared favorably to histological data. Also, some features in the images acquired using the new generation AOSLO system are compatible with rod photoreceptors.
AOSLO images for a patient with achromatopsia were also analyzed. Spacing and reflectivity of clearly-visualized structures were characterized and appeared consistent with abnormal cone or rod photoreceptors. Photoreceptor spacing was also analyzed and the results confirmed previous reports of AO retinal images in a patient with a different mutation in the CNGB3 gene, and retinal images from patients with achromatopsia derived from histological data.
AOSLO images from an eye affected by AZOOR were also analyzed. Normal retina was observed in the areas with normal visual function. Discontinuity in the cone photoreceptor mosaic in the area of the relative scotoma was observed [51,52]. Photoreceptor spacing in the area of the relative scotoma is consistent with the existence of rod photoreceptors.
AOSLO has been shown to be able to detect not only the cone photoreceptor mosaic, but also that of rods. Both cone and rod photoreceptors were detected and characterized not only in healthy subjects but also in patients with different diseases. This feature opens the possibility of using AOSLO images to study new parameters in retinal diseases to improve understanding and to facilitate the development of possible treatments.
Acknowledgments
Thanks to Brandon Lujan and Marianna Mkrtchyan for their assistance with this manuscript. This publication was made possible by grants from the National Institutes of Health—National Eye Institute, numbers EY014375 (AR) and EY002162 (JLD), in addition to the Foundation Fighting Blindness, a Physician-Scientist Award, and unrestricted funds from Research to Prevent Blindness, That Man May See, Inc., The Bernard A. Newcomb Macular Degeneration Fund, and Hope for Vision.
References and links
- 1.Liang J., Williams D. R., Miller D. T., “Supernormal vision and high-resolution retinal imaging through adaptive optics,” J. Opt. Soc. Am. A 14(11), 2884–2892 (1997). 10.1364/JOSAA.14.002884 [DOI] [PubMed] [Google Scholar]
- 2.Miller D. T., Williams D. R., Morris G. M., Liang J., “Images of cone photoreceptors in the living human eye,” Vision Res. 36(8), 1067–1079 (1996). 10.1016/0042-6989(95)00225-1 [DOI] [PubMed] [Google Scholar]
- 3.Roorda A., Romero-Borja F., Donnelly III W., Queener H., Hebert T., Campbell M., “Adaptive optics scanning laser ophthalmoscopy,” Opt. Express 10(9), 405–412 (2002). [DOI] [PubMed] [Google Scholar]
- 4.Hermann B., Fernández E. J., Unterhuber A., Sattmann H., Fercher A. F., Drexler W., Prieto P. M., Artal P., “Adaptive-optics ultrahigh-resolution optical coherence tomography,” Opt. Lett. 29(18), 2142–2144 (2004). 10.1364/OL.29.002142 [DOI] [PubMed] [Google Scholar]
- 5.Zhang Y., Rha J., Jonnal R. S., Miller D. T., “Adaptive optics parallel spectral domain optical coherence tomography for imaging the living retina,” Opt. Express 13(12), 4792–4811 (2005). 10.1364/OPEX.13.004792 [DOI] [PubMed] [Google Scholar]
- 6.Zawadzki R. J., Jones S. M., Olivier S. S., Zhao M., Bower B. A., Izatt J. A., Choi S., Laut S., Werner J. S., “Adaptive-optics optical coherence tomography for high-resolution and high-speed 3D retinal in vivo imaging,” Opt. Express 13(21), 8532–8546 (2005). 10.1364/OPEX.13.008532 [DOI] [PMC free article] [PubMed] [Google Scholar]
- 7.Merino D., Dainty C., Bradu A., Podoleanu A. G., “Adaptive optics enhanced simultaneous en-face optical coherence tomography and scanning laser ophthalmoscopy,” Opt. Express 14(8), 3345–3353 (2006). 10.1364/OE.14.003345 [DOI] [PubMed] [Google Scholar]
- 8.Roorda A., Williams D. R., “The arrangement of the three cone classes in the living human eye,” Nature 397(6719), 520–522 (1999). 10.1038/17383 [DOI] [PubMed] [Google Scholar]
- 9.Li K. Y., Tiruveedhula P., Roorda A., “Intersubject variability of foveal cone photoreceptor density in relation to eye length,” Invest. Ophthalmol. Vis. Sci. 51(12), 6858–6867 (2010). 10.1167/iovs.10-5499 [DOI] [PMC free article] [PubMed] [Google Scholar]
- 10.Jonnal R. S., Besecker J. R., Derby J. C., Kocaoglu O. P., Cense B., Gao W., Wang Q., Miller D. T., “Imaging outer segment renewal in living human cone photoreceptors,” Opt. Express 18(5), 5257–5270 (2010). 10.1364/OE.18.005257 [DOI] [PMC free article] [PubMed] [Google Scholar]
- 11.Chui T. Y., Song H., Burns S. A., “Adaptive-optics imaging of human cone photoreceptor distribution,” J. Opt. Soc. Am. A 25(12), 3021–3029 (2008). 10.1364/JOSAA.25.003021 [DOI] [PMC free article] [PubMed] [Google Scholar]
- 12.Torti C., Považay B., Hofer B., Unterhuber A., Carroll J., Ahnelt P. K., Drexler W., “Adaptive optics optical coherence tomography at 120,000 depth scans/s for non-invasive cellular phenotyping of the living human retina,” Opt. Express 17(22), 19382–19400 (2009). 10.1364/OE.17.019382 [DOI] [PMC free article] [PubMed] [Google Scholar]
- 13.Wolfing J. I., Chung M., Carroll J., Roorda A., Williams D. R., “High-resolution retinal imaging of cone-rod dystrophy,” Ophthalmology 113(6), 1014–1019.e1 (2006). 10.1016/j.ophtha.2006.01.056 [DOI] [PubMed] [Google Scholar]
- 14.Choi S. S., Doble N., Hardy J. L., Jones S. M., Keltner J. L., Olivier S. S., Werner J. S., “In vivo imaging of the photoreceptor mosaic in retinal dystrophies and correlations with visual function,” Invest. Ophthalmol. Vis. Sci. 47(5), 2080–2092 (2006). 10.1167/iovs.05-0997 [DOI] [PMC free article] [PubMed] [Google Scholar]
- 15.Kitaguchi Y., Fujikado T., Bessho K., Sakaguchi H., Gomi F., Yamaguchi T., Nakazawa N., Mihashi T., Tano Y., “Adaptive optics fundus camera to examine localized changes in the photoreceptor layer of the fovea,” Ophthalmology 115(10), 1771–1777 (2008). 10.1016/j.ophtha.2008.03.026 [DOI] [PubMed] [Google Scholar]
- 16.Duncan J. L., Zhang Y., Gandhi J., Nakanishi C., Othman M., Branham K. E. H., Swaroop A., Roorda A., “High-resolution imaging with adaptive optics in patients with inherited retinal degeneration,” Invest. Ophthalmol. Vis. Sci. 48(7), 3283–3291 (2007). 10.1167/iovs.06-1422 [DOI] [PubMed] [Google Scholar]
- 17.Choi S. S., Zawadzki R. J., Keltner J. L., Werner J. S., “Changes in cellular structures revealed by ultra-high resolution retinal imaging in optic neuropathies,” Invest. Ophthalmol. Vis. Sci. 49(5), 2103–2119 (2008). 10.1167/iovs.07-0980 [DOI] [PMC free article] [PubMed] [Google Scholar]
- 18.Yoon M. K., Roorda A., Zhang Y., Nakanishi C., Wong L.-J. C., Zhang Q., Gillum L., Green A., Duncan J. L., “Adaptive optics scanning laser ophthalmoscopy images in a family with the mitochondrial DNA T8993C mutation,” Invest. Ophthalmol. Vis. Sci. 50(4), 1838–1847 (2009). 10.1167/iovs.08-2029 [DOI] [PMC free article] [PubMed] [Google Scholar]
- 19.Duncan J. L., Talcott K. E., Ratnam K., Sundquist S. M., Lucero A. S., Day S., Zhang Y., Roorda A., “Cone structure in retinal degeneration associated with mutations in the peripherin/RDS gene,” Invest. Ophthalmol. Vis. Sci. 52(3), 1557–1566 (2011). 10.1167/iovs.10-6549 [DOI] [PMC free article] [PubMed] [Google Scholar]
- 20.Godara P., Dubis A. M., Roorda A., Duncan J. L., Carroll J., “Adaptive optics retinal imaging: emerging clinical applications,” Optom. Vis. Sci. 87(12), 930–941 (2010). 10.1097/OPX.0b013e3181ff9a8b [DOI] [PMC free article] [PubMed] [Google Scholar]
- 21.Rha J., Dubis A. M., Wagner-Schuman M., Tait D. M., Godara P., Schroeder B., Stepien K., Carroll J., “Spectral domain optical coherence tomography and adaptive optics: imaging photoreceptor layer morphology to interpret preclinical phenotypes,” Adv. Exp. Med. Biol. 664, 309–316 (2010). 10.1007/978-1-4419-1399-9_35 [DOI] [PMC free article] [PubMed] [Google Scholar]
- 22.Choi S. S., Zawadzki R. J., Lim M. C., Brandt J. D., Keltner J. L., Doble N., Werner J. S., “Evidence of outer retinal changes in glaucoma patients as revealed by ultrahigh-resolution in vivo retinal imaging,” Br. J. Ophthalmol. 95(1), 131–141 (2011). 10.1136/bjo.2010.183756 [DOI] [PMC free article] [PubMed] [Google Scholar]
- 23.Ooto S., Hangai M., Sakamoto A., Tsujikawa A., Yamashiro K., Ojima Y., Yamada Y., Mukai H., Oshima S., Inoue T., Yoshimura N., “High-resolution imaging of resolved central serous chorioretinopathy using adaptive optics scanning laser ophthalmoscopy,” Ophthalmology 117(9), 1800–1809.e2 (2010). 10.1016/j.ophtha.2010.01.042 [DOI] [PubMed] [Google Scholar]
- 24.Talcott K. E., Ratnam K., Sundquist S. M., Lucero A. S., Lujan B. J., Tao W., Porco T. C., Roorda A., Duncan J. L., “Longitudinal study of cone photoreceptors during retinal degeneration and in response to ciliary neurotrophic factor treatment,” Invest. Ophthalmol. Vis. Sci. 52(5), 2219–2226 (2011). 10.1167/iovs.10-6479 [DOI] [PMC free article] [PubMed] [Google Scholar]
- 25.Christou J. C., Roorda A., Williams D. R., “Deconvolution of adaptive optics retinal images,” J. Opt. Soc. Am. A 21(8), 1393–1401 (2004). 10.1364/JOSAA.21.001393 [DOI] [PubMed] [Google Scholar]
- 26.K. Y. Li, S. Mishra, P. Tiruveedhula, and A. Roorda, “Comparison of control algorithms for a MEMS-based adaptive optics scanning laser ophthalmoscope,” in American Control Conference, 2009. ACC '09 (IEEE, 2009), pp. 3848–3853. [DOI] [PMC free article] [PubMed] [Google Scholar]
- 27.Chen D. C., Jones S. M., Silva D. A., Olivier S. S., “High-resolution adaptive optics scanning laser ophthalmoscope with dual deformable mirrors,” J. Opt. Soc. Am. A 24(5), 1305–1312 (2007). 10.1364/JOSAA.24.001305 [DOI] [PubMed] [Google Scholar]
- 28.Zhang Y., Poonja S., Roorda A., “MEMS-based adaptive optics scanning laser ophthalmoscopy,” Opt. Lett. 31(9), 1268–1270 (2006). 10.1364/OL.31.001268 [DOI] [PubMed] [Google Scholar]
- 29.Gómez-Vieyra A., Dubra A., Malacara-Hernández D., Williams D. R., “First-order design of off-axis reflective ophthalmic adaptive optics systems using afocal telescopes,” Opt. Express 17(21), 18906–18919 (2009). 10.1364/OE.17.018906 [DOI] [PMC free article] [PubMed] [Google Scholar]
- 30.Burns S. A., Tumbar R., Elsner A. E., Ferguson D., Hammer D. X., “Large-field-of-view, modular, stabilized, adaptive-optics-based scanning laser ophthalmoscope,” J. Opt. Soc. Am. A 24(5), 1313–1326 (2007). 10.1364/JOSAA.24.001313 [DOI] [PMC free article] [PubMed] [Google Scholar]
- 31.Dubra A., Sulai Y., “Reflective afocal broadband adaptive optics scanning ophthalmoscope,” Biomed. Opt. Express 2(6), 1757–1768 (2011). 10.1364/BOE.2.001757 [DOI] [PMC free article] [PubMed] [Google Scholar]
- 32.Dubra A., Sulai Y., Norris J. L., Cooper R. F., Dubis A. M., Williams D. R., Carroll J., “Non-invasive in vivo imaging of the human rod photoreceptor mosaic using a confocal adaptive optics scanning ophthalmoscope,” Biomed. Opt. Express 2(7), 1864–1876 (2011). 10.1364/BOE.2.001864 [DOI] [PMC free article] [PubMed] [Google Scholar]
- 33.A. Dubra, “Monochrome AVI desinusoid software,” http://www.cvs.rochester.edu/dubralab/image_processing/index.htm
- 34.Stevenson S. B., Roorda A., “Correcting for miniature eye movements in high resolution scanning laser ophthalmoscopy,” Proc. SPIE 5688A, 145–151 (2005). 10.1117/12.591190 [DOI] [Google Scholar]
- 35.Curcio C. A., Sloan K. R., Kalina R. E., Hendrickson A. E., “Human photoreceptor topography,” J. Comp. Neurol. 292(4), 497–523 (1990). 10.1002/cne.902920402 [DOI] [PubMed] [Google Scholar]
- 36.Rodieck R. W., “The density recovery profile: a method for analysis of points in the plane applicable to retinal studies,” Vis. Neurosci. 20(3), 349 (2003). 10.1017/S0952523803203138 [DOI] [PubMed] [Google Scholar]
- 37.Bennett A. G., Rudnicka A. R., Edgar D. F., “Improvements on Littmann’s method of determining the size of retinal features by fundus photography,” Graefes Arch. Clin. Exp. Ophthalmol. 232(6), 361–367 (1994). 10.1007/BF00175988 [DOI] [PubMed] [Google Scholar]
- 38.Rossi E. A., Weiser P., Tarrant J., Roorda A., “Visual performance in emmetropia and low myopia after correction of high-order aberrations,” J. Vis. 7(8), 14 (2007). 10.1167/7.8.14 [DOI] [PubMed] [Google Scholar]
- 39.Chui T. Y. P., Song H., Burns S. A., “Individual variations in human cone photoreceptor packing density: variations with refractive error,” Invest. Ophthalmol. Vis. Sci. 49(10), 4679–4687 (2008). 10.1167/iovs.08-2135 [DOI] [PMC free article] [PubMed] [Google Scholar]
- 40.Enoch J. M., “Wave-guide modes in retinal receptors,” Science 133(3461), 1353–1354 (1961). 10.1126/science.133.3461.1353 [DOI] [PubMed] [Google Scholar]
- 41.Curcio C. A., Sloan K. R., “Packing geometry of human cone photoreceptors: variation with eccentricity and evidence for local anisotropy,” Vis. Neurosci. 9(2), 169–180 (1992). 10.1017/S0952523800009639 [DOI] [PubMed] [Google Scholar]
- 42.Doble N., Choi S. S., Codona J. L., Christou J., Enoch J. M., Williams D. R., “In vivo imaging of the human rod photoreceptor mosaic,” Opt. Lett. 36(1), 31–33 (2011). 10.1364/OL.36.000031 [DOI] [PMC free article] [PubMed] [Google Scholar]
- 43.McKusick-Nathans Institute of Genetic Medicine, Johns Hopkins University (Baltimore, MD) and National Center for Biotechnology Information, National Library of Medicine (Bethesda, MD), “Online Mendelian inheritance in man, OMIM (TM),” http://www.ncbi.nlm.nih.gov/omim/
- 44.D. Farnsworth, “The Farnsworth dichotomous test for color blindness-Panel D-15,” Psychological Corporation (1947).
- 45.B. Török, “WEB-based scoring software for the Farnsworth-Munsell 100-Hue, Roth 28-Hue, Farnsworth D-15, and the Lanthony D-15 desaturated color tests,” http://www.torok.info/colorvision
- 46.Bowman K. J., “A method for quantitative scoring of the Farnsworth Panel D-15,” Acta Ophthalmol. (Copenh.) 60(6), 907–916 (1982). 10.1111/j.1755-3768.1982.tb00621.x [DOI] [PubMed] [Google Scholar]
- 47.Carroll J., Choi S. S., Williams D. R., “In vivo imaging of the photoreceptor mosaic of a rod monochromat,” Vision Res. 48(26), 2564–2568 (2008). 10.1016/j.visres.2008.04.006 [DOI] [PMC free article] [PubMed] [Google Scholar]
- 48.Falls H. F., Wolter J. R., Alpern M., “Typical total monochromacy. A histological and psychophysical study,” Arch. Ophthalmol. 74(5), 610–616 (1965). [DOI] [PubMed] [Google Scholar]
- 49.Harrison R., Hoefnagel D., Hayward J. N., “Congenital total color blindness: a clincopathological report,” Arch. Ophthalmol. 64, 685–692 (1960). [DOI] [PubMed] [Google Scholar]
- 50.Glickstein M., Heath G. G., “Receptors in the monochromat eye,” Vision Res. 15(6), 633–636 (1975). 10.1016/0042-6989(75)90276-X [DOI] [PubMed] [Google Scholar]
- 51.Gass J. D. M., “Acute zonal occult outer retinopathy. Donders Lecture: The Netherlands Ophthalmological Society, Maastricht, Holland, June 19, 1992,” J. Clin. Neuroophthalmol. 13(2), 79–97 (1993). [PubMed] [Google Scholar]
- 52.Monson D. M., Smith J. R., “Acute zonal occult outer retinopathy,” Surv. Ophthalmol. 56(1), 23–35 (2011). 10.1016/j.survophthal.2010.07.004 [DOI] [PubMed] [Google Scholar]
- 53.Li D., Kishi S., “Loss of photoreceptor outer segment in acute zonal occult outer retinopathy,” Arch. Ophthalmol. 125(9), 1194–1200 (2007). 10.1001/archopht.125.9.1194 [DOI] [PubMed] [Google Scholar]
- 54.Zibrandtsen N., Munch I. C., Klemp K., Jørgensen T. M., Sander B., Larsen M., “Photoreceptor atrophy in acute zonal occult outer retinopathy,” Acta Ophthalmol. (Copenh.) 86(8), 913–916 (2008). 10.1111/j.1600-0420.2007.01140.x [DOI] [PubMed] [Google Scholar]
- 55.Fine H. F., Spaide R. F., Ryan E. H., Jr, Matsumoto Y., Yannuzzi L. A., “Acute zonal occult outer retinopathy in patients with multiple evanescent white dot syndrome,” Arch. Ophthalmol. 127(1), 66–70 (2009). 10.1001/archophthalmol.2008.530 [DOI] [PubMed] [Google Scholar]
- 56.Mkrtchyan M., Lujan B. J., Merino D., Thirkill C. E., Roorda A., Duncan J., “Outer retinal structure in patients with acute zonal occult outer retinopathy,” submitted to Am. J. Ophthalmol. . [DOI] [PMC free article] [PubMed] [Google Scholar]


