Abstract
Here, we report in vivo 3-D visualization of the layered organization of a rat olfactory bulb (OB) by a swept source optical coherence tomography (SS-OCT). The SS-OCT operates at a wavelength of 1334 nm with respective theoretical depth and lateral resolutions of 6.7 μm and 15.4 μm in air and hence it is possible to get a 3D structural map of OB in vivo at the micron level resolution with millimeter-scale imaging depth. Up until now, with methods such as MRI, confocal microscopy, OB depth structure in vivo had not been clearly visualized as these do not satisfy the criterion of simultaneously providing micron-scale spatial resolution and imaging up to a few millimeter in depth. In order to confirm the OB’s layered organization revealed by SS-OCT, we introduced the technique of electrocoagulation to make landmarks across the layered structure. To our knowledge this is such a first study that combines electrocoagulation and OCT in vivo of rat OB. Our results confirmed the layered organization of OB, and moreover the layers were clearly identified by electrocoagulation landmarks both in the OCT structural and anatomical slice images. We expect such a combined study is beneficial for both OCT and neuroscience fields.
OCIS codes: (170.3880) Medical and biological imaging, (170.4500) Optical coherence tomography, (170.6900) Three-dimensional microscopy, (170.6935) Tissue characterization, (170.5380) Physiology
1. Introduction
Optical coherence tomography (OCT) has been widely established as a diagnostic tool for noninvasive imaging of retina and other biological tissues in vivo [1–6]. In this study of in vivo brain structural visualization by OCT, we focused on rat olfactory bulb (OB), one of the common targets in neuroscience for its simplicity in organization with well investigated and understood anatomical structure [7–10]. In the case of imaging rat OB, currently existing imaging methods such as MRI [11], confocal microscopy either lack the ability of providing micrometer resolutions in both lateral and depth directions or restricted by the range of imaging depth. In contrast, Fourier domain OCT systems provide micrometer resolutions in both lateral and depth directions, an imaging depth of up to a few millimeter, and a high temporal resolution of a few microseconds for single A-scan. In this paper, we have employed a swept source optical coherence tomography (SS-OCT) at a wavelength of 1334 nm. Further, to confirm the OCT structural results obtained we have introduced the technique of electrocoagulation to make landmarks and, to our knowledge, this is the first such study done in rat OB in vivo. In order to give a general idea on the organization of OB, we give a brief description of the organization of OB with Fig. 1 .
Fig. 1.

(a) A schematic view of the olfactory bulb (OB) location in a rat. (b) A schematic view of the layer structure of rat OB and (c) an anatomical slice view of Nissl stained OB in red region of (a). OB consists of different layers namely: glomerulous layer (GL), external plexiform layer (EPL), mitral cell body layer (MCL), and granule cell layer (GCL). A, anterior; P, posterior; D, dorsal; V, ventral. Scale bar, 100 μm (c).
Figure 1 gives a schematic of rat OB along with the anatomical layer organization. OB indicated as a blue square in Fig. 1(a) is actually an outgrowth of the forebrain. It consists of distinctive different layers, namely: glomerulous layer (GL), external plexiform layer (EPL), mitral cell body layer (MCL) and granule cell layer (GCL) as indicated in the schematic of Fig. 1(b) and the corresponding Nissl stained anatomical image of Fig. 1(c). It should be mentioned here that, Nissl stain would stain mainly the nuclei of neuronal cells and clumps of material surrounding the nuclei. The Nissl stain thus can visualize arrangement of neurons in different parts of the brain tissue. As seen from the schematic of Fig. 1(b), the layers contain sharply differentiated cells with extending axons and branches. The layer GL is made of fibers having almost spherical shape (also called neuropil) where connections between axon terminals from olfactory nerve, dendrites from mitral cell and periglomerular (PG) cells are formed as dendro-dendritic synapses. A glomerulus has an approximate diameter of 50-300 μm. Moreover, in the GL, a small number of PG cell bodies surround each glomerulus and they have a diameter of 6-8 μm. EPL consists of dendrites of mitral and tufted cells and tufted cell bodies. MCL consists of high density mitral cell bodies formed rather as a thin sheet with cell bodies having a diameter 15-30 μm while GCL consists of granule cells with 6-8 μm in diameter [7].
As seen from the description of the organizational structure of OB, OCT has got just the suitable resolution requirements for visualizing the layered organization. In this study, as we have employed a swept-source OCT, it is possible to perform 3D scans and hence get a 3D structural map of OB at micrometer resolutions in vivo. In order to confirm the structure revealed by OCT, we have conducted electrocoagulation in conjunction with OCT to make landmark sites in the structural image. We expect these landmark sites to be visualized both by OCT and by Nissl stained anatomical slices. Such a comparative study of OCT in conjunction with electrocoagulation and anatomy would provide new insights on the structural information obtained through OCT. Our results indeed confirmed that the OCT was effective in the visualization of the layered structure of OB. Earlier, a study of comparison had been done only between the OCT image and its anatomical image with xenopus laevis (African frog) tadpole [12].
Section 2 describes the experimental method giving a description of the SS-OCT system, details on animal preparation, electrocoagulation technique, anatomical slice preparation and finally OCT image alignment and processing details. In section 3, we present the OCT results of OB visualization by SS-OCT and discuss the images in comparison with the corresponding electrocoagulation and anatomical results. Finally, we summarize the results of our combined technique.
2. Experimental Method
2.1 Fiber-Based SS-OCT System
Figure 2 shows a schematic of the custom made SS-OCT system (Santec corporation, Aichi, Japan). We used a swept source laser (Santec, HSL-2000) that has a center wavelength 1334 nm with a full width half maximum (FWHM) 117 nm and providing an average output power of 18.1 mW. Scanning speed of the swept source laser was 20 kHz. The theoretical values for depth and lateral resolutions are 6.7 μm and 15.4 μm, respectively. The light from the source was split into two beams with a 95/5 optical coupler with 95% illuminating the sample and 5% illuminating the reference arm mirror after passing through the respective circulators. The light reflected respectively from the sample and the reference mirror were recombined by a 2x2 optical coupler (coupling ratio of 50%/50%). The probe unit for collecting reflected light from the sample consisted of two mirrors to perform surface scans. They were mounted on galvanometers for scanning x and y axes and controlled by a D/A converter (National instruments, PCI-6221). In the probe arm, a collimating lens having a beam diameter of 7.0 mm, an objective lens having a numerical aperture of 0.192, f-number 2.6, and a focal length of 60 mm were used. The unit was also equipped with a CCD camera to identify the scanning area of the sample and also a visible guide beam of 625 nm to indicate the exact scan locations. The averaged emitted power at the sample surface was 10 mW. The interference signal was detected by a balanced detector (New Focus, 1817) to remove DC component and source fluctuations and digitized by a 14 bit A/D converter having a sampling frequency of 100 MHz (Signatec, PDA14). Image acquisition and recording software were modified based on the OCT software library (Santec) provided along with the SS-OCT system. The library was written in LabVIEW (National Instruments, LabVIEW).
Fig. 2.

A Schematic of the SS-OCT system. Swept light source with center wavelength 1334 nm, FWHM of 117nm and a scanning speed of 20 kHz provided an average power of 18.1 mW. The first 1x2 fiber coupler with a coupling ratio 95/5 near the light source splits the light from the source respectively to sample arm (95%) and reference arm (5%). The second 2x2 fiber coupler with a coupling ratio of 50/50 was used to combine reflected lights from the sample and the reference arms and this provides equally divided interference signal to be detected by the balanced receiver. The balanced detector was used to remove the common source fluctuations and DC component from the interference signal. The signal from the balanced photo receiver was finally converted to digital signal with a A/D converter that was analyzed with a computer. Here, PC indicates a polarization controller and was used to optimize the interference signal.
2.2 Animal Preparation Details
Sprague-Dawley rats (SLC Japan, 6-8weeks, 190-300g) were anesthetized with medetomidine hydrochloride (Orion, Domitor, 0.05ml/100g i.m.) and ketamine hydrochloride (Daiichi-Sankyo, Ketalar, 0.15ml/100g i.p.). The results presented in this report were mainly obtained from five different rats. The body temperature was maintained at 37.0 degrees Celsius with a temperature controlled heat blanket (Nihon Kohden, ATB-1100). The heartbeat was continuously monitored during experiment by a heart rate counter equipped with a bioelectric amplifier (Nihon Kohden, AT-601G and AB-621G). The rats were mounted on a stereotaxic frame with an ear-bar set. Only the dorsal right OB region was exposed after removing the skull with a dental drill and covered with mineral oil (Sigma, M3516). During the experiments, we kept the heart rate of the animal to be around 220-260/min and injected thiopental sodium (Mitsubishi Tanabe Pharma, Ravonal, 0.1ml/100g i.p.) every 2 hours to have a stable anesthetized condition. The experimental protocol was approved by the Animal Experiments Committee of RIKEN that follows the guideline of the National Institute of Health.
2.3 Details of Modified Electrocoagulation Method
The method of electrocoagulation for brain researches has been used in histological identification of electrophysiological recording sites [13] and also in making mouse models with permanent middle cerebral artery occlusion for cerebral ischemia investigation [14]. In this study, to visualize electrocoagulation sites in OCT image, we used a tungsten electrode (FHC, Catalog# UEWLEJTMNNIE) and modified the tip to have the insulation stripped to a length of approximately 200-300 μm as shown by the optical micrograph in Fig. 3(c) . This enabled us to reduce the size of the volume of coagulation region. The modified electrode was inserted from the dorsal side of the posterior part to the ventral side of the anterior part across the sagittal plane as shown in Fig. 3(a). Electrocoagulation was performed by applying a small electrical direct current (5 μA for 10 sec) with a current source (Stoelting, model 51413) to the tip of the electrode. Passing current directly caused increase of the tissue temperature and resulted in vaporization of water in the cells in the vicinity of the electrode site. As a result, a darkening or a cavity and hardening of the surroundings of the cavity in the tissue were observed in OCT images. The values for the amount and the duration of the current were optimized from real time observation of OCT images.
Fig. 3.
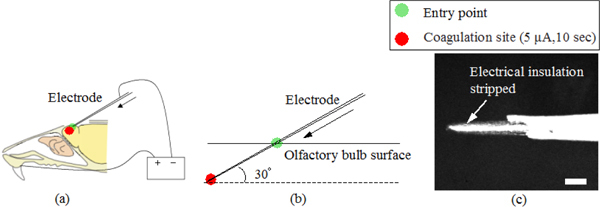
Schematic views describing (a) the electrocoagulation process and (b) a magnified view of the penetration of the electrode tip. (c) shows an optical micrograph of the magnified view of the insulation stripped tip region with the scale bar corresponding to 100μm.
2.4 Anatomical Slice Preparation Procedure
At the end of OCT imaging, rats were injected with a lethal dose of pentobarbital (Kyoritsu Seiyaku, Somnopentyl). After that, animals were perfused with physiological saline and 4% paraformaldehyde (PFA). The brains were removed and postfixated with 4% PFA and substituted with 30% sucrose solution. After freezing, sagittal sections of 50 μm thickness were done by a micro slicer that included the slices of the coagulation sites. The sections were Nissl stained for clear visualization of the cell bodies and the sites. Images of the slices were visualized by a laser scanning optical microscope (Olympus, FV1000-D) equipped with a viewer software (Olympus, Fluoview). The microscope having an objective lens (Olympus, UPLSAPO4X) with a numerical aperture of 0.16, f-number 26.5, and a focal length of 13 mm were used. Slice images were acquired in the bright field mode.
2.5 Image Acquisition and Image Processing
We formulated our image acquisition protocol so as to improve the signal to noise ratio (SN ratio) of the OCT images obtained. Generally, the number of data points for raw interference signals for one volume consisted of 3800 (z-axis: λ (wavelength)) x 250 (x-axis) x 250 (y-axis) voxels and it took a data acquisition time of 10 seconds. To minimize the acquisition times as small as possible, and also to obtain as many images as possible, we performed the data acquisition in the following way: At first, A/D converter board operated to pool the volume data into A/D converter's onboard memory. The limits on the recording period of a net 10 seconds were mainly due to the A/D converter's onboard memory size (512 Mbyte in our case) and the speed of data transfer from onboard memory to PC main memory after A/D conversion. Thus, in our protocol to reduce acquisition times, we performed simultaneous data transfer process from PC main memory to hard disk with another thread loop. To convert the raw OCT data signal from frequency domain to depth space of OCT signal, we performed λ-k (wavelength-wave number) conversion with interpolation, and FFT computation for each axial line (A-Scan) in offline. After the calculations, each volume data consisted of 400 (z-axis: depth) x 250 (x-axis) x 250 (y-axis) voxels corresponding to respective physical dimensions of 2.9 mm(z-axis: depth) x 2.5 mm(x-axis) x 2.5 mm(y-axis). x and y corresponded to lateral scanning by galvano scanners. Each voxel size across z, x, y corresponds respectively to 7.25 μm, 10 μm and 10 μm. We also performed B-Scan so as to obtain improved images with high SN ratio by having the galvano scanner of y fixed at a particular position of interest and scanning only the x-position. The B-scan images were corrected for any misalignment due to movement of the brain through the process of cross-correlation [15]. The movements were mainly due to the respiration and the heartbeat and filling in due to cerebrospinal fluid (CSF) flow. Corrections were performed offline with the LabVIEW and MATLAB (MathWorks, MATLAB) softwares. It should be pointed out here, that though all the images shown in the results section are presented in decibels or logarithmic scale, image processing of image alignment and averaging (a few hundred images) had been done in linear scale. The image in Fig. 4(a) was obtained by using a function of “projection view” with the 3D visualization software (Visualization Science Group & Maxnet, Avizo) in logarithmic scale.
Fig. 4.
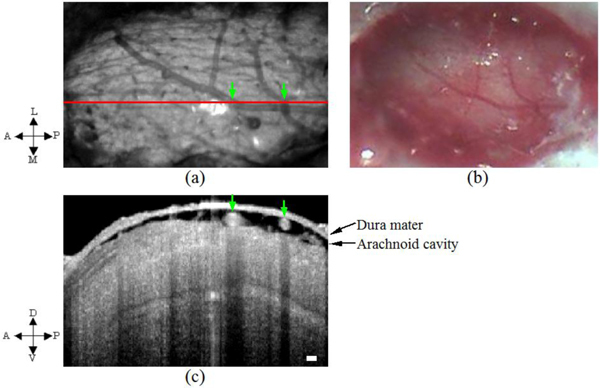
(a) OCT projection image (integration performed across the entire imaging depth, 2.9mm). (b) Corresponding CCD image. The red line in (a) indicates the scan position of the OCT image with the green arrows indicating the surface blood vessels and the corresponding shadows seen in (c) across the entire imaging depth. In the OCT images shown in this report, all depths were those measured in air and were not corrected of the refractive index of the medium. A, anterior; P, posterior; L, lateral; M, medial; D, dorsal; V, ventral. Scale bars, 100 μm.
3. Result and Discussion
3.1 Visualization of Olfactory Bulb by SS-OCT
We showed OCT and CCD in vivo images in Fig. 4. The CCD camera image of OB surface (Fig. 4(b)) reveals some surface blood vessels. Figure 4(a) shows integrated 3D OCT signal across the entire imaging depth at the same angle of Fig. 4(b). In Fig. 4(a), we recognized the same blood vessels as seen in the CCD image of Fig. 4(b). In Fig. 4(c), we show 2D cross sectional depth reflectivity variation i.e., the image across the horizontal red line in Fig. 4(a). From the top of the image, the first layer was identified as the dura mater while the second layer as the arachnoid cavity with the surface blood vessels and the image below identified as the tissue of the olfactory bulb consisting of a layered organization. In Fig. 4(c), we identified some white circular structures that exactly correspond to the surface blood vessel positions in Fig. 4(a) with vertical shadows extending across the scanned depth below indicated by the green arrows.
3.2 Visualization of Layered Structure of OB by SS-OCT
For both the images shown in Figs. 5(a) and 5(d), which correspond to results obtained from two different rats, clear layered organizations were visualized. We have indicated the different layers that putatively correspond to layers such as GL, EPL, MCL and GCL on the left side of the figure. In order to understand the layer that is supposed to be the GL layer, magnified views of the region encased within the blue dotted lines of Fig. 5(a) are shown in Fig. 5(b) with the glomeruli encircled in red circles for clarity and Fig. 5(c) without any red encircled circles to avoid the obstruction of the edges of the glomeruli themselves by the circles. Again the same kind of figures have been provided also for Fig. 5(d) with the magnified views shown in respectively Fig. 5(e) and Fig. 5(f) with the glomeruli encircled by red line and without the red encircles. In both cases of Figs. 5(a)–5(f), the almost round structures putatively correspond to glomeruli as the sizes of the structures coincide with the range of glomerulus sizes. The layer marked as MCL, appearing as a white thin line in Fig. 5(a) and 5(d) putatively correspond to mitral cell layer. So there arises a need for confirming this layered organization. In the next section, we present confirmation results obtained by electrocoagulation that were later compared with anatomical sections.
Fig. 5.
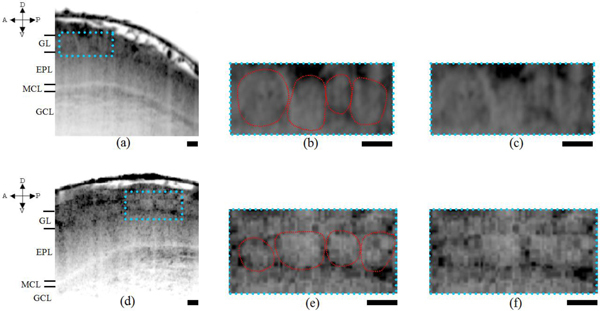
OCT structural images obtained from two different rats ((a) and (d). Magnified views of the probable glomeruli encased in blue squares shown in (a) and (d) are shown, respectively in (b), (c) and (e), (f). The red encircled regions in (b) and (e) correspond putatively to glomeruli. In spite of the fact the individual glomerulus like circular structures appear to have poor optical contrast as they consist mainly of fibers being optically homogeneous we still could identify the structures. In the magnified views of (b), (c) and (e), (f), we can make out the circular structures. The arrows indicate respectively, the anterior-posterior and dorsal-ventral parts of the rat. Scale bars, 100 μm.
3.3 A Comparison of the OCT Image and Anatomical Image under Electrocoagulation
Figure 6 shows the confirmation results of structural images of OB with the landmark sites marked through the electrocoagulation technique described in section 2.3. The electrocoagulation was performed by injecting current through the electrode from the dorsal posterior to the ventral anterior as shown by the arrows on the left of the Fig. 3. We inserted the electrode obliquely while observing under a microscope at approximately an angle of 30 degrees with respect to the rat surface and proceeded the tip of the electrode. Simultaneously, we made real time monitoring of the OCT images and stopped the tip of the electrode at the investigating layer of interest. Here, we show two different sites. The first one is shown just below the putative glomerulus layer (GL) in Figs. 6(a) and 6(b). The other site at the putative mitral cell layer (MCL) is shown in Figs. 6(c) and 6(d). In order to clarify the sites and the layers for comparison, we show both the real and the inverted intensity mapped images.
Fig. 6.
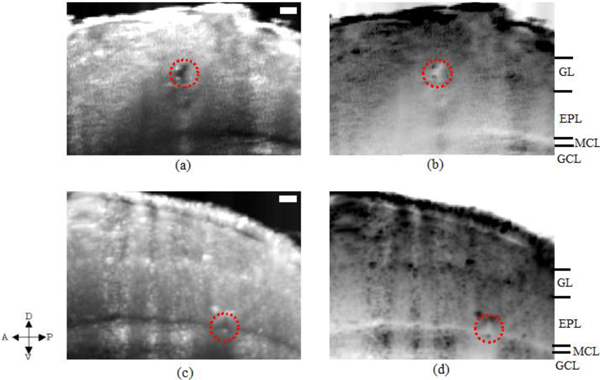
OCT images of OB obtained from two different electrocoagulation sites one in the GL layer while the other in the MCL layer. Red circled regions indicate the coagulation sites in both the real OCT backscattered intensity map (a) and (c). The same results (a) and (c) are again shown for clarity as inverted intensity maps respectively in (b) and (d). Figures 5(d)–5(f) and Figs. 6(a) and 6(b) were obtained from the same rat OB but cross sectional planes were different. The arrows on the left corner indicate the anterior-posterior and dorsal-ventral parts of the rat. Scale bars, 100 μm.
In all Figs. 6(a)–6(d), the coagulation sites were shown as red encircled regions. We confirmed that the method of electrocoagulation did indeed worked very well in making landmark positions in the tissue in vivo to differentiate the different layers. Next, we compared the results of OCT images having landmark sites with the anatomical images.
The anatomical section was cut out in a sagittal plane as shown in Fig. 7 . In Fig. 7, first of all we identified the layered organization. The layered organization shown in Figs. 7(a) and 7(b) almost corresponded to the OCT images obtained before coagulation shown in Figs. 5(a) and 5(c). We identified the coagulation sites with one site just located below GL and the other site within MCL. We identified the correspondence of the layered structure (GL, EPL, MCL and GCL), between the OCT image and the anatomical image by coagulation sites.
Fig. 7.
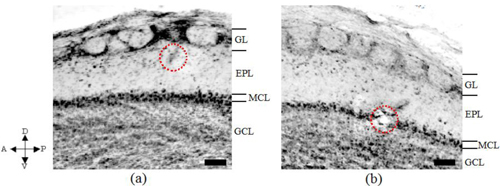
Anatomical images obtained after electrocoagulation with the site just below GL shown in (a) and the site in MCL shown in (b). The coagulation sites in the GL and MCL layers were shown as the red encircled regions. The arrows indicate respectively the anterior-posterior and dorsal-ventral parts of the rat. (a) and (b) respectively correspond to Figs. 6(a) and 6(b), and Figs. 6(c) and 6(d). Scale bars, 100 μm.
4. Summary
We succeeded in visualizing rat olfactory bulb in vivo by using SS-OCT. We identified the layered organization along with the protective layers such as dura mater and arachnoid cavity. We identified the surface cerebral blood vessels through the depth integrated surface image of 3-D OCT images. We proposed the use of electrocoagulation technique in conjunction with OCT imaging for confirmation of the layered organization revealed by OCT. We indeed showed that the proposed combination technique worked well and we made landmarks that were visualized later by anatomical slices. We clearly identified the different important layers (GL, EPL, MCL, GCL) that consist of a group of cell bodies. We also succeeded in making landmark sites at those layers that were identified and confirmed through the anatomical slices. Our proposed approach opens up the possibility of visualizing and identifying different layers simultaneously and therefore makes it a suitable and promising technique toward applying it to neuroscientific investigations with high resolution.
One possibility of extending the current study is toward the investigation of functional interaction among the layers by fOCT [5,6,15,16] as currently, there is no technique available to study the interaction providing both high spatial resolution at a larger imaging depth. Further, we also suggest this kind of combined study of OCT and electrode study could act as a combined tool in direct visualization of the electrode penetration studies used in electrophysiology where rather blind penetrations of the electrodes are usually done [17]. OCT could also been used as a diagnostic tool of brain disease such as Alzheimer's disease [18], through detection of morphological or structural changes at an early stage.
Acknowledgments
We thank Ms. Kei Hagiya for her assistance with the surgical procedures and particularly in the procedure of exposing the rat OB. We also thank Mr. Takayuki Sato and Dr. Go Uchida for their advice on electrocoagulation and image processing of the results. We thank Dr. Ryota Homma for his useful advice on OB imaging at early stage of this work. We would like to thank Dr. Tsutomu Hashikawa and the other staff members of the Support Unit for Neuromorphological Analysis, RIKEN BSI for assistance in performing the anatomical procedures. We also would like to thank RIKEN BSI-Olympus Collaboration Center for their technical support in obtaining optical images of the anatomical slices. We thank “Rapid engineering team” of RIKEN for supporting in the design of the experimental devices. We would like to thank the staff members of Research Resources Center in taking care of the animals. Finally, we also thank Mr. Atsushi Morosawa and Mr. Takuya Suzuki of Santec Corporation (Aichi, Japan) for their technical assistance in customizing the SS-OCT system.
References and links
- 1.Huang D., Swanson E. A., Lin C. P., Schuman J. S., Stinson W. G., Chang W., Hee M. R., Flotte T., Gregory K., Puliafito C. A., Fujimoto J. G., “Optical coherence tomography,” Science 254(5035), 1178–1181 (1991). 10.1126/science.1957169 [DOI] [PMC free article] [PubMed] [Google Scholar]
- 2.Wojtkowski M., “High-speed optical coherence tomography: basics and applications,” Appl. Opt. 49(16), D30–D61 (2010). 10.1364/AO.49.000D30 [DOI] [PubMed] [Google Scholar]
- 3.W. Drexler and J. G. Fujimoto eds., Optical Coherence Tomography (Springer-Verlag, 2008). [Google Scholar]
- 4.B. E. Bouma and G. J. Tearney eds., Handbook of Optical Coherence Tomography (Marcel Dekker, 2002). [Google Scholar]
- 5.Suzuki W., Hanazono G., Nanjo T., Ito K., Nishiyama J., Tanifuji M., Tsunoda K., “Intrinsic signals in different layers of macaque retina revealed by optical coherence tomography (OCT),” Abstr. Soc. Neurosci. 171.19 (2010). [Google Scholar]
- 6.Chen Y., Aguirre A. D., Ruvinskaya L., Devor A., Boas D. A., Fujimoto J. G., “Optical coherence tomography (OCT) reveals depth-resolved dynamics during functional brain activation,” J. Neurosci. Methods 178(1), 162–173 (2009). 10.1016/j.jneumeth.2008.11.026 [DOI] [PMC free article] [PubMed] [Google Scholar]
- 7.G. M. Shepherd, W. R. Chen, and C. A. Greer, “OLFACTORY BULB,” in The Synaptic Organization of the Brain, G. M. Shepherd, eds. (Oxford University Press, 2004), pp. 165–216. [Google Scholar]
- 8.Lledo P. M., Gheusi G., Vincent J. D., “Information processing in the mammalian olfactory system,” Physiol. Rev. 85(1), 281–317 (2005). 10.1152/physrev.00008.2004 [DOI] [PubMed] [Google Scholar]
- 9.Mombaerts P., “How smell develops,” Nat. Neurosci. 4(Suppl), 1192–1198 (2001). 10.1038/nn751 [DOI] [PubMed] [Google Scholar]
- 10.Mori K., Nagao H., Yoshihara Y., “The olfactory bulb: coding and processing of odor molecule information,” Science 286(5440), 711–715 (1999). 10.1126/science.286.5440.711 [DOI] [PubMed] [Google Scholar]
- 11.Yang X., Renken R., Hyder F., Siddeek M., Greer C. A., Shepherd G. M., Shulman R. G., “Dynamic mapping at the laminar level of odor-elicited responses in rat olfactory bulb by functional MRI,” Proc. Natl. Acad. Sci. U.S.A. 95(13), 7715–7720 (1998). 10.1073/pnas.95.13.7715 [DOI] [PMC free article] [PubMed] [Google Scholar]
- 12.Boppart S. A., Bouma B. E., Pitris C., Southern J. F., Brezinski M. E., Fujimoto J. G., “In vivo cellular optical coherence tomography imaging,” Nat. Med. 4(7), 861–865 (1998). 10.1038/nm0798-861 [DOI] [PubMed] [Google Scholar]
- 13.Sato T., Uchida G., Tanifuji M., “Cortical columnar organization is reconsidered in inferior temporal cortex,” Cereb. Cortex 19(8), 1870–1888 (2009). 10.1093/cercor/bhn218 [DOI] [PMC free article] [PubMed] [Google Scholar]
- 14.Chauveau F., Moucharrafie S., Wiart M., Brisset J. C., Berthezène Y., Nighoghossian N., Cho T. H., “In vivo MRI assessment of permanent middle cerebral artery occlusion by electrocoagulation: pitfalls of procedure,” Exp. Transl. Stroke. Med 2(1), 1–4 (2010). 10.1186/2040-7378-2-4 [DOI] [PMC free article] [PubMed] [Google Scholar]
- 15.Maheswari R. U., Takaoka H., Kadono H., Homma R., Tanifuji M., “Novel functional imaging technique from brain surface with optical coherence tomography enabling visualization of depth resolved functional structure in vivo,” J. Neurosci. Methods 124(1), 83–92 (2003). 10.1016/S0165-0270(02)00370-9 [DOI] [PubMed] [Google Scholar]
- 16.Nakamichi Y., Kalatsky V. A., Watanabe H., Rajagopalan U. M., Tanifuji M., “3D structure of the orientation column in cat primary cortex revealed by functional optical coherence tomography,” Abstr. Soc. Neurosci. submitted [DOI] [PubMed] [Google Scholar]
- 17.Watanabe H., Maheswari R. U., Nakamichi Y., Igarashi K., Madjarova V. D., Kadono H., Tanifuji M., “A swept source optical coherence tomography revealed depth structures of rat olfactory bulb in vivo,” Abstr. Soc. Neurosci. submitted [Google Scholar]
- 18.Jafri M. S., Tang R., Tang C. M., “Optical coherence tomography guided neurosurgical procedures in small rodents,” J. Neurosci. Methods 176(2), 85–95 (2009). 10.1016/j.jneumeth.2008.08.038 [DOI] [PubMed] [Google Scholar]


