Abstract
Recent clinical studies on human skin indicated that in vivo multi-harmonic generation microscopy (HGM) can achieve sub-micron resolution for histopathological analysis with a high penetration depth and leave no energy or photodamages in the interacted tissues. It is thus highly desired to apply HGM for in vivo mucosa histopathological diagnosis. In this paper, the first in vivo optical virtual biopsy of human oral mucosa by using epi-HGM is demonstrated. We modified an upright microscope to rotate the angle of objective for in vivo observation. Our clinical study reveals the capability of HGM to in vivo image cell distributions in human oral mucosa, including epithelium and lamina propria with a high penetration depth greater than 280 μm and a high spatial resolution better than 500 nm. We also found that the third-harmonic-generation (THG) contrast on nucleus depends strongly on its thicknesses, in agreement with a numerical simulation. Besides, 4% acetic acid was found to be able to enhance the THG contrast of nucleus in oral mucosa, while such enhancement was found to decay due to the metabolic clearance of the contrast enhancer by the oral mucosa. Our clinical study indicated that, the combined epi-THG and epi-second-harmonic-generation (SHG) microscopy is a promising imaging tool for in vivo noninvasive optical virtual biopsy and disease diagnosis in human mucosa.
OCIS codes: (180.6900) Three-dimensional microscopy, (180.5810) Scanning microscopy, (190.4160) Multiharmonic generation
1. Introduction
Abnormalities in oral mucosa lead to precancerous or even cancerous lesions. Early disease diagnosis and intervention are essential for the clinical success. Physical biopsy is currently the gold standard for diagnosing oral mucosal abnormalities. However, the invasive and painful biopsy procedure does not always predict the clinical outcome of the disease. The biopsy process is often uncomfortable and exposes patients to a wide spectrum of potential risks and complications such as tissue trauma, bleeding, and spreading of cancer cells. Besides, the sampled slice of tissue may not represent the worst part of the whole lesion and may lead to underestimation of the disease progression [1,2], and result in poor treatment outcome. It is therefore desirable to develop non-invasive imaging tools with a capability of histopathological analysis to assist the clinical diagnosis, not to mention that during the early disease stage, physical biopsy is usually not recommended.
With recent advancement in optronics, two optical imaging modalities have demonstrated their capability to be able to provide in vivo structural information in human oral cavity, including optical coherent tomography (OCT) [3–5] and reflectance confocal microscopy [6–8]. However, these in vivo modalities cannot provide sub-micron spatial resolution for accurate pathological cellular structure analysis. Non-linear imaging techniques, including multi-photon fluorescence [9,10] and higher harmonic generation microscopy (HGM) [11], have been previously applied to image hamster oral mucosa in vivo with a sub-micron spatial resolution. However, the laser power applying in multi-photon fluorescence microscopy should be considered for safety as described in Hopt’s report [12]. On the other hand, recent embryo viability studies of HGM indicated its unique capability to meet high safety standard [13–18], while this high safety standard was further confirmed in clinical in vivo human skin studies [18,19]. It is thus highly desirable to extend this new modality for human oral mucosa imaging in vivo.
In this paper, the first in vivo optical virtual biopsy of human oral mucosa based on epi-HGM is demonstrated. We combined a modified upright laser scanning microscope system with a rotatable objective to facilitate the clinical study. Utilizing epi-third-harmonic-generation (THG) and epi-second-harmonic-generation (SHG) signals, the microscopic cellular and subcellular structures of epithelium and lamina propria in human oral mucosa can be obtained without fluorescence signals, with a lateral spatial resolution better than 500 nm even at 280 μm beneath the surface. The histological information including the sizes, shapes, and distributions of epithelial cells and the moving erythrocytes in the capillary were provided by epi-THG signals. SHG revealed the structure and distribution of the collagen fibers in lamina propria as expected. In comparison with the previous animal study [11], a higher lateral resolution and a deeper penetration depth in human oral mucosa can be found. Besides, we followed the approach of Schins et al. [20] to numerically simulate the thickness- and χ(3)-dependencies of THG intensities in cell nuclei. We reported our finding that the THG contrast on epithelial nucleus is strongly influenced by its thickness. In order to further enhance the THG contrast of nucleus in oral mucosa, we applied acetic acid to human oral mucosa. The THG enhancement of nuclear border can be observed, while the THG enhancement in nucleus border degraded due to the metabolic clearance of the contrast enhancer in oral mucosa. The image acquisition process was performed under the informed consent, which was reviewed and approved by the National Taiwan University Hospital Ethics Committee. No damage was reported in this clinical study. Our study indicates a high potential of HGM for non-invasive in vivo disease diagnosis, classification, and staging in human oral mucosa.
2. Materials and Methods
2.1. In Vivo Harmonic Generation Microscope
The in vivo harmonic generation biopsy system is shown in Fig. 1 . A home-built Cr:forsterite laser operating at 1230 nm was used to observe the tissues [21,22]. This excitation wavelength enables minimal light attenuation in biological mucosa tissues [23] and the SHG and THG can be generated to fall within the visible spectrum range for deep tissue signal detection [24]. Average excitation power after the objective was around but slightly less than 100 mW. As shown in Fig. 1(a), the collimated laser beam was scanned by a pair of high-speed galvanometer mirrors (Olympus, Flouview 300) and focused by an IR water immersion objective (Olympus, UPlanApo/60X/NA1.2/Working distance 280 μm). The frame rate of Fluoview 300 was about two frames per second with 512 × 512 pixels per frame. Three dimensional HGM images can be acquired by using a z-motor to change the tissue stabilizer position along the light propagation axis so that the relative position between the objective and the tissue surface can be controlled. Different imaging depths can thus be achieved.
Fig. 1.
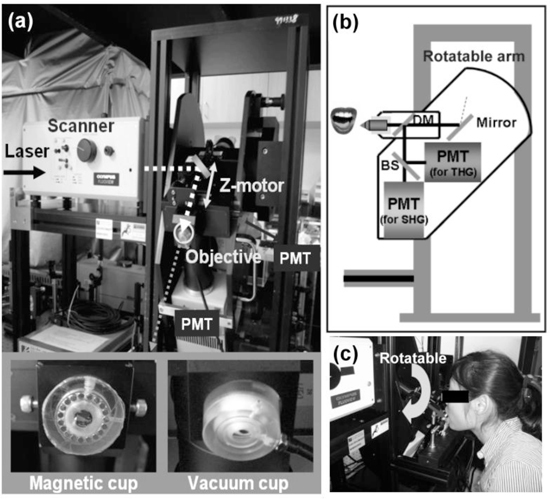
In vivo harmonic generation biopsy system. (a) Photograph of the optical virtual biopsy system. The illumination source was a Cr:forsterite laser. The collimated laser beam performed a 2D scan by a pair of fast galvanometer mirrors and PMT (photomultiplier tube) recorded the harmonic signals. A z-motor changed the tissue stabilizer (magnetic cup and vacuum cup) position along the light propagation axis so that the relative position between the objective and the tissue surface can be controlled. (b, c) A schematic diagram and a photograph of the rotatable system. SHG and THG signals were divided by a beamsplitter and guided into two PMTs. The objective of the imaging system was fixed on a rotatable arm to adapt the volunteer’s oral cavity.
Connected with the z-motor, oral tissues were immobilized by a magnetic cup stabilizer or a vacuum cup stabilizer as shown in the inset of Fig. 1(a). The stabilizer helps to hold the distance between the microscope z-motor and volunteer's oral mucosa. A vacuum cup was designed to suck the oral mucosa nearby the imaging window. The imaging window is surrounded by a circular intaglio and a duct is drilled through the cup to connect the circular intaglio to a vacuum pump. Oral mucosa nearby can thus be sucked and stabilized when the vacuum pump starts to pump out air. The magnetic cup is surrounded by a circular intaglio with a circular magnet. For the magnetic cup, it was attached to the oral mucosa and we used another magnet in the opposite of oral mucosa to stabilize it. These setups are suitable for comfortable imaging of the subject for more than ten minutes.
Figure 1(b) is the schematic diagram of the rotatable system. SHG and THG signals were divided by a beamsplitter and guided into two PMTs (photomultiplier tube). We modified an upright microscope (Olympus, BX51) with a rotatable arm, which enabled more flexible adjustment of the objective to adapt the volunteer’s oral vestibule [see Fig. 1(c)]. Sequences of multi-harmonic sections were taken from the top surface of the epithelium down to the underlying lamina propria.
2.2. Subjects
This clinical study included five healthy volunteers and their demographics information are as following: V1 (female, 28 years old, Asian), V2 (female, 26 year old, Asian), V3 (female, 25 years old, Asian), V4 (female, 27 years old, Asian), and V5 (female, 22 years old, Asian). The image acquisition process was performed under the informed consent. The protocol was reviewed and approved by the National Taiwan University Hospital Ethics Committee (NTUH IRB, 200806021D).
2.3. Damage Evaluation
Current ANSI laser standards do not provide the criteria for the laser exposures on oral mucosa [25]. It is thus critical to perform laser safety evaluation. The 1230 nm laser power after the objective lens was around but slightly below 100 mW and the total exposure time of the laser light for 1 volunteer was equal to or slightly less than 30 minutes. Our study indicated that all volunteers felt no pain nor had other unpleasant feeling (for example, stinking sensation) during and after the experiments. In order to confirm the non-invasiveness of the studied virtual biopsy system, the observed site was examined by a physician after in vivo observation immediately to check for tissue damage, clinical adverse signs and symptoms such as itching, pain, changes in color and texture of the mucosa, local swelling, presence of blister or ulceration. None of these oral mucosa changes can be found on the observed cites.
3. Results and Discussion
3.1. In Vivo Optical Virtual Biopsy of Human Oral Mucosa
THG was reported to provide image contrast for cell membrane [14,26–28] and laminated organelles [16], thus the morphology of mucous cells can be revealed. Healthy mucous membrane of oral mucosa consists of non-keratinized stratified squamous epithelium and the underlying lamina propria [29]. The epithelial cells increase in size as they migrate from the basal layer upward toward the superficial layer [29]. The different cell morphology and sizes can be visualized clearly in the various optical tissue sections provided by the in vivo epi-THG images (presented by purple pseudocolor) from the depth of 25 μm to 250 μm, as exampled in Fig. 2(a) –2(f). The nuclei in the superficial cell layer were clearly visible as THG-bright structures [Fig. 2(a), 2(b) (arrowheads)], but on the contrary the nuclei were THG-dark structures within basal cells [Fig. 2(d) (arrowheads)]. In normal epithelial differentiation, the superficial epithelial cells present in a large flatten shape compared to those in the deep basal layer [30]. Thus, we supposed that the difference in the THG nucleus contrast may arise from the thickness difference of the cell nuclei. The detailed discussion about the relation between THG contrasts and thickness of cell nucleus will be given in a later section. Different from THG, SHG is known to provide high contrast for collagen fibers [31,32], which is abundant in lamina propria. Basal cells close to the lamina propria can be observed with THG contrast in adjacent to collagen fibers with bright SHG contrast [Fig. 2(d)]. The lamina propria could be further divided into two histological layers: the papillary layer and the reticular layer. The collagen fibers are thinner and more loosely organized in the superficial papillary layer than those in the reticular layer. This phenomenon could be observed in the in vivo SHG images [Fig. 2(e) and Fig. 2(f)]. THG contrasts inside lamina propria revealed the moving erythrocytes in the capillary [18,19,33] due to the THG contrast on oxy-hemoglobin [34], as shown in Fig. 2(e) (arrowhead), which enables real-time observation of the capillary blood flow. A previous study indicated that the nuclear size, cytoplasmic size and their ratio have been shown to be significant in the evaluation of oral lesions [35]. With a sub-micron spatial resolution, we were thus able to provide accurate nuclear-cytoplasmic (NC) ratio analysis, which is an important index for malignant transformation to specify the morphological changes of the epithelial cells [36]. Following our previous analysis protocol [18], the area of the whole cell and nucleus can be defined using the high-resolution THG contrast as shown with dashed and solid lines in Fig. 3(a) , respectively. Thus, subtracting area of the nucleus from area of the whole cell, the 2D area of cytoplasm can be obtained. By analyzing the 2D areas with a previous proposed protocol [18], the 3-D volume analysis can thus be obtained. For each volunteer, at least 30 epi-THG-imaged cells have been analyzed while the quality of the chosen images should allow at least 5 cells clearly-identifiable. The NC ratio of the volunteer was then obtained by the total summation of nuclei area from all chosen frames divided by that of cytoplasm area. Thus analyzed NC ratios in the superficial and the basal cell layers for five volunteers are summarized in Fig. 3(b). The average values of thus analyzed NC ratios in the superficial and basal cell layers for five volunteers are 0.051 ± 0.006 and 0.392 ± 0.045, respectively. Our reported NC ratios are in good agreement with the previously reported electron microscopic analysis for the superficial epithelium (0.045 ± 0.02) and for the basal epithelium (0.40 ± 0.14) [37], while previous quantitative analysis required the removal of the oral mucous tissues. Since all volunteers are healthy Asian female and they are aged 22-28 years, the deviation of NC ratio between patients may thus be due to individual differences. In this study, we do not provide the NC ratio analysis on sex, age, ethnicity, and diseased states. In order to differentiate normal and the diseased state with the NC ratio provided by our demonstrated HGM technique, more clinical research should be conducted in order to define the cut-off value. With the capability to noninvasively obtain the NC ratio and with a low deviation on the analyzed data, this study indicates a high potential of HGM to differentiate the diseased states.
Fig. 2.
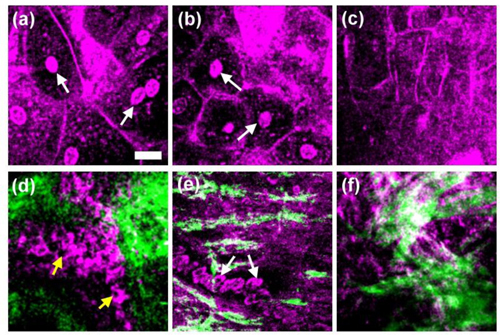
Harmonic generation images of normal oral mucosa tissue in one healthy human subject. The horizontal section images are serial sections beginning at the top surface of the mucosa and progressing deeper into the tissue. The purple color represents THG signals and the green color indicates SHG signals. (a) The superficial epithelial cell layer at a depth of 25 μm; (b) the deeper superficial epithelial cell layer at a depth of 40 μm; (c) the intermediate epithelial cell layer at a depth of 90 μm; (d) the basal cell layer and the adjacent collagen fibers at a depth of 190 μm; (e) the collagen fibers and the erythrocytes (arrowheads) in the lamina propria with blood flow at a depth of 220 μm; (f) collagen fibers in the deeper lamina propria at a depth of 250 μm. (Scale bar: 20 μm).
Fig. 3.
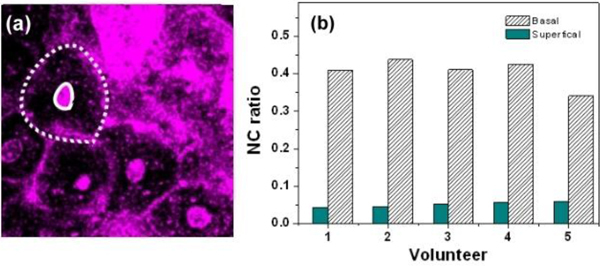
(a) Sample THG image for NC ratio analysis. The areas of cells and nuclei were defined with dashed and solid lines, respectively. (b) The nucleus-cytoplasmic (NC) ratio in the superficial and the basal cell layers from five volunteers. The average values of thus analyzed NC ratios in the superficial and basal cell layers for five volunteers are 0.051 ± 0.006 and 0.392 ± 0.045, respectively.
3.2. Resolution Analysis
To analyze thus obtained image resolution, twenty independent measurements were acquired for the analysis. In Fig. 4(a) , the spatial intensity distribution across the collagen fibers [Fig. 4(b) (arrowhead)] and epithelial cell membranes [Fig. 4(c) (arrowhead)] were fitted with Gaussian curves to analyze the lateral resolutions of SHG and THG images, respectively. Figure 4(d) summarizes thus analyzed SHG and THG lateral resolution versus depth in the epithelium and the lamina propria. Based on the same analysis protocol of a previous skin study [18], our result suggested that HGM could provide sub-500-nm lateral resolution within 270 μm depth of human oral mucosa. With the same objective and the same laser wavelength, our achieved lateral resolution in human oral mucosa was found to be much better than that in human skin [19,38,39]. For example, in the same depth of 200 μm, the resolutions of THG are 428 μm in oral mucosa but are 620 μm in skin [19]. The outermost layer of the human skin is the stratum corneum, which is keratinized stratified squamous epithelium, while the oral mucosa consists of non-keratinized stratified squamous epithelium. A significant correlation between skin roughness and stratum corneum has been observed [40], and the distortion of the point spread function in the human skin has also been reported [39]. This study also suggests that the keratinized stratum corneum would induce the distortion of the point spread function in human skin and degrade the HGM resolution. Without the keratinized stratum corneum, the HGM resolution in oral mucosa is thus relatively improved. Our study thus indicates a great potential of the HGM system for the mucous tissue diagnosis due to the higher penetration and improved resolution.
Fig. 4.

The lateral resolution of HGM images in human oral mucosa. (a) The spatial intensity distribution of SHG or THG was fitted by a Gaussian curve. We analyzed the resolutions of SHG and THG images by using (b) collagen fibers (arrowhead) for SHG and (c) cell membranes (arrowhead) for THG. (d) THG (solid squares) and SHG (solid triangles) lateral resolution versus depth in epithelium and lamina propria are summarized. (Scale bar: 20 μm)
3.3. Thickness-Dependence THG Intensity of Epithelial Cell Nucleus
Figure 2(a) and 2(d) show typical epi-THG images obtained in the superficial layer and the basal layer in the oral cavity. Significant difference can be observed on the THG contrast on cell nuclei. In the superficial layer, cell nuclei appear THG bright (white arrow), while in the basal layer, cell nuclei appear THG-dark (yellow arrow). To investigate the main physical mechanism behind this interesting contrast change, we followed the similar approaches of Schins et al. [20] to numerically simulate the thickness- and χ(3)-dependency of THG intensities of cell nuclei. In this simulation, we considered a focused Gaussian beam propagating through an isolated nucleus (with a shape of a flat disk facing the incoming beam) in cytoplasm in z direction, and the position z = 0 was set in the middle of the nucleus as shown in Fig. 5(a) . The refractive indices in the simulation were 1.374 in cytoplasm and 1.423 in nucleus [41]. Concerning the 1.23 μm laser wavelength, the confocal parameter of the laser beam can be derived from the THG lateral resolution and the related resolution formula [20,39] is about 0.90 μm, and beam waist is 0.42 μm . We considered that the nucleus lateral size was much larger than the beam waist so that we neglected the inhomogeneity in the x-y plane. We also assumed that the nucleus is homogeneous inside and the susceptibility of the nucleus is uniform. We studied three conditions. First, the third-order susceptibility of the nucleus (χ(3)nucl) is equal to the third-order susceptibility of the cytoplasm (χ(3)cyto). Second, χ(3)nucl is much greater than χ(3)cyto. Third, χ(3)nucl is much smaller than χ(3)cyto. With the light propagation direction defined as the z-direction, and we numerically altered the laser beam focusing position z relative to the center of nucleus to obtain the THG intensity, and the obtained THG intensity versus beam focusing position with different nuclear thicknesses are summarized in Fig. 5(b), assuming χ(3)nucl = χ(3)cyto. Taking the nuclear with thickness of 9 μm for example, two THG peaks can be obtained when the laser beam was focused near the nuclear boundaries (at the positions of 5 and −5 μm relative to the center of the cell nucleus), and the THG was found to be extremely weak when focused in the middle of the nucleus. On the contrary, there was only one centralized THG peak when the nuclear thickness is less than 3 μm. Therefore, the numerical calculation result most likely corresponds to the different THG contrasts of cell nuclei observed in the superficial and in the basal cell layer. In this study, we also utilized the tissue specimens to confirm the thicknesses of different nuclei. The oral specimens including normal and cancerous tissues were surgically removed from the patients with oral cancer. The Ethics Committee of National Taiwan University Hospital approved the study and the patient provided written informed consent. Figure 5(c) is the H&E stained transverse histological image of normal human oral mucosa. By analyzing the histological image, the thicknesses of the cell nuclei in the superficial cell layer (white arrow) and the deeper epithelial cell layer (yellow arrow) are 3.36 ± 0.94 μm and 9.03 ± 0.71 μm, respectively. The histological and simulation results support our finding that the nucleus THG contrast was strongly influenced by the nucleus thickness and explain our observation that cell nuclei appeared THG bright in the superficial and intermediate layer, but THG-dark in the basal layer. This is because when we scanned in the lateral center of the cell nucleus, the focus will also be located in the axial center of the cell nucleus, while the interesting THG phase matching behavior under the tightly focused Gaussian beam play a role.
Fig. 5.
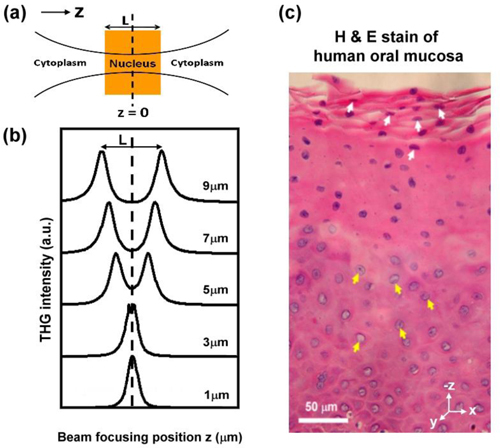
(a) A diagram of the laser beam focusing in a cell. The position z = 0 is set in the middle of the cell nucleus and the third-order susceptibility of the nucleus is equal to the susceptibility of the cytoplasm. (b) Numerical simulations of THG intensities versus beam focusing position z with different thickness of the cell nucleus (L). (c) Transverse histological image of human oral mucosa. The thicknesses of cell nuclei in the superficial cell layer (white arrow) and the deeper epithelial cell layer (yellow arrow) are 3.36 ± 0.94 μm and 9.03 ± 0.71 μm, respectively.
Since there is no literature value of χ(3)nucl and χ(3)cyto, to study the effect of the relative value between χ(3)nucl and χ(3)cyto, we simulated the THG intensity profiles with different third-order susceptibility conditions, including χ(3)cyto = 0 (red line), χ(3)nucl = 0 (blue line), and χ(3)nucl = χ(3)cyto (black line), shown in Fig. 6 . The THG intensities in these three cases have general likeness as varying the thicknesses of the nucleus. These results indicated that the THG contrasts on epithelial nuclei are strongly influenced by the nucleus thicknesses relative to the excitation beam confocal parameter, almost independent of the relative nonlinear susceptibility value, of the cell nuclei. It is also interesting to notice that the simulation result was based on a forward propagation condition, suggesting that our epi-collected THG images from nucleus were partially contributed from backscattered forward THG signals.
Fig. 6.
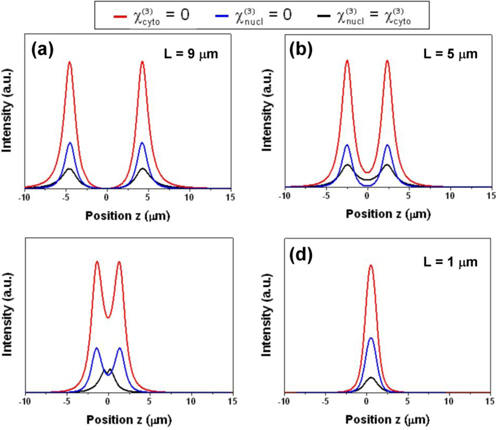
Numerical simulations of THG intensities as a function of beam focusing position z with different third-order susceptibility conditions, including χ(3)cyto = 0 (red line), χ(3)uncl = 0 (blue line), and χ(3)uncl = χ(3)cyto (black line). THG intensities with the nucleus thicknesses of (a) 9 μm, (b) 5 μm, (c) 3 μm, and (d) 1μm.
3.4. Applying Acetic Acid as a THG Contrast Agent
Previous studies [11,42,43] demonstrated that acetic acid could serve as a THG contrast agent for imaging cell nucleus. We applied 4% acetic acid before imaging the oral mucosa to study the enhancement of THG contrast between nucleus and cytoplasm. Before applying acetic acid, the specific in vivo THG images of oral mucosa in the intermediate epithelial cell layer show a relative low contrast difference between nuclei and cytoplasm [Fig. 7(a) ] due to the fact that they both generate equal amount of THG signals. Five minutes after applying the acetic acid, the nuclear contrast of the epithelial cells improved significantly in the intermediate epithelial layer as presented in the Fig. 7(b), attributed to the modification of the refractive index inside the cell nucleus [43], thus breaking the balance between the generated THG intensities from cytoplasm and nucleus. However, twenty minutes after applying the acetic acid, the THG enhancement in nucleus border degraded as shown in Fig. 7(c) that was attributed to the metabolic clearance of the contrast enhancer in human oral mucosa. We used the nuclear-membrane (NM) ratio to indicate the relative THG intensity of the nuclei at different stages before and after applying acetic acid [Fig. 7(d)]. The values of the NM ratio before, after five and after twenty minutes of acetic acid application are 1.001 ± 0.239, 1.583 ± 0.148 and 1.209 ± 0.148, respectively. The results revealed that acetic acid could serve as a THG nucleus contrast enhancer in human oral epithelium. It is important to notice that after adding acetic acid in epithelium the nuclei will have extra nucleic acid and there will be additional nucleoprotein within the nucleus and cytoplasm, as indicated in previous studies [44]. This effect will change the NC ratio of epithelial cells. We have also analyzed the NC ratio in the superficial layer for the volunteer 10 minutes after applying the acetic acid. A much increased NC ratio of 0.094 can be obtained. Even though applying the acetic acid will change the result of the NC ratio analysis, however, applying acetic acid on oral mucosa can reveal the THG images of the nucleus in the intermediate layer. It implies that we can get more information in oral epithelium after applying acetic acid and it is thus helpful for clinical diagnosis, even though more studies on the changes of NC ratio affected by acetic acid, on both normal and diseased states, should be conducted to evaluate its potential for accurate diagnosis.
Fig. 7.
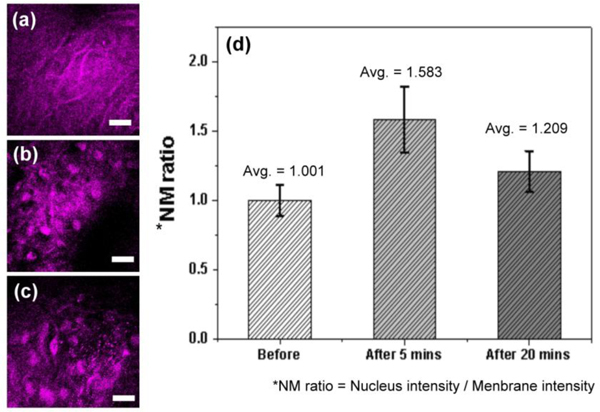
Comparison of in vivo THG images of human oral epithelium in the same epithelial layer, (a) before, (b) 5 minutes after, and (c) 20 minutes after applying acetic acid. (d) The values of nucleus-to-membrane (NM) ratio were summarized. (Scale bar: 20 μm)
4. Conclusion
In this paper, we demonstrated the in vivo optical virtual biopsy of human oral mucosa by using epi-HGM with a modified microscope. Epi-HGM is applied to five volunteers’ oral cavity, and no visible damage was found after continuous observation for 30 min. Epi-HGM provided in vivo images in human oral mucosa, including epithelium and lamina propria with a high penetration depth greater than 280 μm. The lateral resolution can be better than 500 nm and 600 nm for THG and SHG microscopy, respectively. By analyzing the epi-THG contrasts on nucleus and using a numerical simulation, we found that the epi-THG contrast on nucleus depends strongly on its thicknesses, and is almost independent of the relative nonlinear susceptibility value, of the cell nuclei. The capability of epi-THG modality to resolve the shapes, distribution, and sizes of human oral epithelial cells in superficial and basal cell layers can provide the accurate NC ratio without removing tissues. With the unique capability to specify the morphological changes of the epithelial cells, epi-THG microscopy is with a high potential for diagnosing the abnormality of oral mucosa or even precancerous and cancer lesions.
Acknowledgments
This research is sponsored by National Health Research Institute of Taiwan (NHRI-EX99-9936EI), and National Taiwan University Research Center for Medical Excellence.
References and links
- 1.Houssami N., Ciatto S., Ellis I., Ambrogetti D., “Underestimation of malignancy of breast core-needle biopsy: concepts and precise overall and category-specific estimates,” Cancer 109(3), 487–495 (2007). 10.1002/cncr.22435 [DOI] [PubMed] [Google Scholar]
- 2.Zografos G. C., Zagouri F., Sergentanis T. N., Nonni A., Koulocheri D., Fotou M., Panopoulou E., Pararas N., Fotiadis C., Bramis J., “Minimizing underestimation rate of microcalcifications excised via vacuum-assisted breast biopsy: a blind study,” Breast Cancer Res. Treat. 109(2), 397–402 (2008). 10.1007/s10549-007-9662-0 [DOI] [PubMed] [Google Scholar]
- 3.Feldchtein F., Gelikonov V., Iksanov R., Gelikonov G., Kuranov R., Sergeev A., Gladkova N., Ourutina M., Reitze D., Warren J., “In vivo OCT imaging of hard and soft tissue of the oral cavity,” Opt. Express 3(6), 239–250 (1998). 10.1364/OE.3.000239 [DOI] [PubMed] [Google Scholar]
- 4.Ridgway J. M., Armstrong W. B., Guo S., Mahmood U., Su J., Jackson R. P., Shibuya T., Crumley R. L., Gu M., Chen Z., Wong B. J., “In vivo optical coherence tomography of the human oral cavity and oropharynx,” Arch. Otolaryngol. Head Neck Surg. 132(10), 1074–1081 (2006). 10.1001/archotol.132.10.1074 [DOI] [PubMed] [Google Scholar]
- 5.Ozawa N., Sumi Y., Shimozato K., Chong C., Kurabayashi T., “In vivo imaging of human labial glands using advanced optical coherence tomography,” Oral Surg. Oral Med. Oral Pathol. Oral Radiol. Endod. 108(3), 425–429 (2009). 10.1016/j.tripleo.2009.05.035 [DOI] [PubMed] [Google Scholar]
- 6.White W. M., Rajadhyaksha M., González S., Fabian R. L., Anderson R. R., “Noninvasive imaging of human oral mucosa in vivo by confocal reflectance microscopy,” Laryngoscope 109(10), 1709–1717 (1999). 10.1097/00005537-199910000-00029 [DOI] [PubMed] [Google Scholar]
- 7.Sung K.-B., Liang C., Descour M., Collier T., Follen M., Richards-Kortum R., “Fiber-optic confocal reflectance microscope with miniature objective for in vivo imaging of human tissues,” IEEE Trans. Biomed. Eng. 49(10), 1168–1172 (2002). 10.1109/TBME.2002.803524 [DOI] [PubMed] [Google Scholar]
- 8.Maitland K. C., Gillenwater A. M., Williams M. D., El-Naggar A. K., Descour M. R., Richards-Kortum R. R., “In vivo imaging of oral neoplasia using a miniaturized fiber optic confocal reflectance microscope,” Oral Oncol. 44(11), 1059–1066 (2008). 10.1016/j.oraloncology.2008.02.002 [DOI] [PMC free article] [PubMed] [Google Scholar]
- 9.Wilder-Smith P., Osann K., Hanna N., Abbadi N. E., Brenner M., Messadi D., Krasieva T., “In vivo multiphoton fluorescence imaging: a novel approach to oral malignancy,” Lasers Surg. Med. 35(2), 96–103 (2004). 10.1002/lsm.20079 [DOI] [PubMed] [Google Scholar]
- 10.Sun J., Shilagard T., Bell B., Motamedi M., Vargas G., “In vivo multimodal nonlinear optical imaging of mucosal tissue,” Opt. Express 12(11), 2478–2486 (2004). 10.1364/OPEX.12.002478 [DOI] [PubMed] [Google Scholar]
- 11.Tai S.-P., Lee W.-J., Shieh D.-B., Wu P.-C., Huang H.-Y., Yu C.-H., Sun C.-K., “In vivo optical biopsy of hamster oral cavity with epi-third-harmonic-generation microscopy,” Opt. Express 14(13), 6178–6187 (2006). 10.1364/OE.14.006178 [DOI] [PubMed] [Google Scholar]
- 12.Hopt A., Neher E., “Highly nonlinear photodamage in two-photon fluorescence microscopy,” Biophys. J. 80(4), 2029–2036 (2001). 10.1016/S0006-3495(01)76173-5 [DOI] [PMC free article] [PubMed] [Google Scholar]
- 13.Chu S.-W., Chen S.-Y., Tsai T.-H., Liu T.-M., Lin C.-Y., Tsai H.-J., Sun C.-K., “In vivo developmental biology study using noninvasive multi-harmonic generation microscopy,” Opt. Express 11(23), 3093–3099 (2003). 10.1364/OE.11.003093 [DOI] [PubMed] [Google Scholar]
- 14.Sun C.-K., Chu S.-W., Chen S.-Y., Tsai T.-H., Liu T.-M., Lin C.-Y., Tsai H.-J., “Higher harmonic generation microscopy for developmental biology,” J. Struct. Biol. 147(1), 19–30 (2004). 10.1016/j.jsb.2003.10.017 [DOI] [PubMed] [Google Scholar]
- 15.Chen S.-Y., Hsieh C.-S., Chu S.-W., Lin C.-Y., Ko C.-Y., Chen Y.-C., Tsai H.-J., Hu C.-H., Sun C.-K., “Noninvasive harmonics optical microscopy for long-term observation of embryonic nervous system development in vivo,” J. Biomed. Opt. 11(5), 054022 (2006). 10.1117/1.2363369 [DOI] [PubMed] [Google Scholar]
- 16.Hsieh C.-S., Chen S.-U., Lee Y.-W., Yang Y.-S., Sun C.-K., “Higher harmonic generation microscopy of in vitro cultured mammal oocytes and embryos,” Opt. Express 16(15), 11574–11588 (2008). [PubMed] [Google Scholar]
- 17.Hsieh C.-S., Ko C.-Y., Chen S.-Y., Liu T.-M., Wu J.-S., Hu C.-H., Sun C.-K., “In vivo long term continuous observation of gene expression in zebrafish embryos nerve systems by using harmonic generation microscopy and morphant technology,” J. Biomed. Opt. 13(6), 064041 (2008). 10.1117/1.3050423 [DOI] [PubMed] [Google Scholar]
- 18.Chen S.-Y., Chen S.-U., Wu H.-Y., Lee W.-J., Liao Y.-H., Sun C.-K., “In vivo virtual biopsy of human skin by using noninvasive higher harmonic generation microscopy,” IEEE J. Sel. Top. Quantum Electron. 16(3), 478–492 (2010). 10.1109/JSTQE.2009.2031987 [DOI] [Google Scholar]
- 19.Chen S.-Y., Wu H.-Y., Sun C.-K., “In vivo harmonic generation biopsy of human skin,” J. Biomed. Opt. 14(6), 060505 (2009). 10.1117/1.3269676 [DOI] [PubMed] [Google Scholar]
- 20.Schins J. M., Schrama T., Squier J., Brakenhoff G. J., Muller M., “Determination of material properties by use of third-harmonic generation microscopy,” J. Opt. Soc. Am. B 19(7), 1627–1634 (2002). 10.1364/JOSAB.19.001627 [DOI] [Google Scholar]
- 21.Chu S.-W., Chen I.-H., Liu T.-M., Chen P. C., Sun C.-K., Lin B.-L., “Multimodal nonlinear spectral microscopy based on a femtosecond Cr:forsterite laser,” Opt. Lett. 26(23), 1909–1911 (2001). 10.1364/OL.26.001909 [DOI] [PubMed] [Google Scholar]
- 22.Chia S.-H., Liu T.-M., Ivanov A. A., Fedotov A. B., Zheltikov A. M., Tsai M.-R., Chan M.-C., Yu C.-H., Sun C.-K., “A sub-100 fs self-starting Cr:forsterite laser generating 1.4 W output power,” Opt. Express 18(23), 24085–24091 (2010). 10.1364/OE.18.024085 [DOI] [PubMed] [Google Scholar]
- 23.Bouma B. E., Tearney G. J., Bilinsky I. P., Golubovic B., Fujimoto J. G., “Self-phase-modulated Kerr-lens mode-locked Cr:forsterite laser source for optical coherence tomography,” Opt. Lett. 21(22), 1839–1841 (1996). 10.1364/OL.21.001839 [DOI] [PubMed] [Google Scholar]
- 24.Sun C.-K., “Higher harmonic generation microscopy,” Adv. Biochem. Eng. Biotechnol. 95, 17–56 (2005). [DOI] [PubMed] [Google Scholar]
- 25.A. N. S. I. Standard, Z136.1–2007, American National Standard for the Safe Use of Lasers (2007).
- 26.Chu S.-W., Tai S.-P., Ho C.-L., Lin C.-H., Sun C.-K., “High-resolution simultaneous three-photon fluorescence and third-harmonic-generation microscopy,” Microsc. Res. Tech. 66(4), 193–197 (2005). 10.1002/jemt.20160 [DOI] [PubMed] [Google Scholar]
- 27.Barzda V., Greenhalgh C., Aus der Au J., Elmore S., van Beek J., Squier J., “Visualization of mitochondria in cardiomyocytes by simultaneous harmonic generation and fluorescence microscopy,” Opt. Express 13(20), 8263–8276 (2005). 10.1364/OPEX.13.008263 [DOI] [PubMed] [Google Scholar]
- 28.Millard A. C., Fittinghoff D. N., Wiseman P. W., Muller M., Brakenhoff G. J., Squier J. A., Wilson K. R., “Three dimensional, third harmonic microscopy of living systems,” Biophys. J. 78, 800 (2000).10653792 [Google Scholar]
- 29.D. W. Fawcett, “Oral cavity and associated glands,” in A Textbook of Histology (Saunders, 1986), pp. 579–601. [Google Scholar]
- 30.H. G. Burkitt, B. Young, and J. W. Heath, Wheater's Functional Histology: A Text and Colour Atlas, (Churchill-Livingstone, 1993), pp. 235–246. [Google Scholar]
- 31.Chu S.-W., Chen I.-H., Liu T.-M., Sun C.-K., Lee S.-P., Lin B.-L., Cheng P.-C., Kuo M.-X., Lin D.-J., Liu H.-L., “Nonlinear bio-photonic crystal effects revealed with multimodal nonlinear microscopy,” J. Microsc. 208(3), 190–200 (2002). 10.1046/j.1365-2818.2002.01081.x [DOI] [PubMed] [Google Scholar]
- 32.Chu S.-W., Tai S.-P., Chan M.-C., Sun C.-K., Hsiao I.-C., Lin C.-H., Chen Y.-C., Lin B.-L., “Thickness dependence of optical second harmonic generation in collagen fibrils,” Opt. Express 15(19), 12005–12010 (2007). 10.1364/OE.15.012005 [DOI] [PubMed] [Google Scholar]
- 33.Sun C.-K., Yu C.-H., Tai S.-P., Kung C.-T., Wang I.-J., Yu H.-C., Huang H.-J., Lee W.-J., Chan Y.-F., Sun C.-K., “In vivo and ex vivo imaging of intra-tissue elastic fibers using third-harmonic-generation microscopy,” Opt. Express 15(18), 11167–11177 (2007). 10.1364/OE.15.011167 [DOI] [PubMed] [Google Scholar]
- 34.Chang C.-F., Yu C.-H., Sun C.-K., “Multi-photon resonance enhancement of third harmonic generation in human oxyhemoglobin and deoxyhemoglobin,” J Biophotonics 3(10-11), 678–685 (2010). 10.1002/jbio.201000045 [DOI] [PubMed] [Google Scholar]
- 35.Cowpe J. G., Longmore R. B., Green M. W., “Quantitative exfoliative cytology of abnormal oral mucosal smears,” J. R. Soc. Med. 81(9), 509–513 (1988). [DOI] [PMC free article] [PubMed] [Google Scholar]
- 36.Hande A. H., Chaudhary M. S., “Cytomorphometric analysis of buccal mucosa of tobacco chewers,” Rom. J. Morphol. Embryol. 51(3), 527–532 (2010). [PubMed] [Google Scholar]
- 37.Landay M. A., Schroeder H. E., “Quantitative electron microscopic analysis of the stratified epithelium of normal human buccal mucosa,” Cell Tissue Res. 177(3), 383–405 (1977). 10.1007/BF00220313 [DOI] [PubMed] [Google Scholar]
- 38.Tai S.-P., Tsai T.-H., Lee W.-J., Shieh D.-B., Liao Y.-H., Huang H.-Y., Zhang K. Y.-J., Liu H.-L., Sun C.-K., “Optical biopsy of fixed human skin with backward-collected optical harmonics signals,” Opt. Express 13(20), 8231–8242 (2005). 10.1364/OPEX.13.008231 [DOI] [PubMed] [Google Scholar]
- 39.Tsai T.-H., Tai S.-P., Lee W.-J., Huang H.-Y., Liao Y.-H., Sun C.-K., “Optical signal degradation study in fixed human skin using confocal microscopy and higher-harmonic optical microscopy,” Opt. Express 14(2), 749–758 (2006). 10.1364/OPEX.14.000749 [DOI] [PubMed] [Google Scholar]
- 40.Sato J., Yanai M., Hirao T., Denda M., “Water content and thickness of the stratum corneum contribute to skin surface morphology,” Arch. Dermatol. Res. 292(8), 412–417 (2000). 10.1007/s004030000143 [DOI] [PubMed] [Google Scholar]
- 41.Myakov A., Nieman L., Wicky L., Utzinger U., Richards-Kortum R., Sokolov K., “Fiber optic probe for polarized reflectance spectroscopy in vivo: design and performance,” J. Biomed. Opt. 7(3), 388–397 (2002). 10.1117/1.1483314 [DOI] [PubMed] [Google Scholar]
- 42.Balas C. J., Themelis G. C., Prokopakis E. P., Orfanudaki I., Koumantakis E., Helidonis E. S., “In vivo detection and staging of epithelial dysplasias and malignancies based on the quantitative assessment of acetic acid-tissue interaction kinetics,” J. Photochem. Photobiol. B 53(1-3), 153–157 (1999). 10.1016/S1011-1344(99)00133-5 [DOI] [PubMed] [Google Scholar]
- 43.Lee W.-J., Yu C.-H., Tai S.-P., Huang H.-Y., Sun C.-K., “Acetic acid as a cell nucleus contrast agent in third-harmonic generation microscopy,” J. Med. Biol. Eng. 27, 161–164 (2007). [Google Scholar]
- 44.MacLean A. B., “Acetowhite epithelium,” Gynecol. Oncol. 95(3), 691–694 (2004). 10.1016/j.ygyno.2004.08.006 [DOI] [PubMed] [Google Scholar]


