Abstract
The 3-D spectral-domain optical coherence tomography (SD-OCT) images of the retina often do not reflect the true shape of the retina and are distorted differently along the x and y axes. In this paper, we propose a novel technique that uses thin-plate splines in two stages to estimate and correct the distinct axial artifacts in SD-OCT images. The method was quantitatively validated using nine pairs of OCT scans obtained with orthogonal fast-scanning axes, where a segmented surface was compared after both datasets had been corrected. The mean unsigned difference computed between the locations of this artifact-corrected surface after the single-spline and dual-spline correction was 23.36 ± 4.04 μm and 5.94 ± 1.09 μm, respectively, and showed a significant difference (p < 0.001 from two-tailed paired t-test). The method was also validated using depth maps constructed from stereo fundus photographs of the optic nerve head, which were compared to the flattened top surface from the OCT datasets. Significant differences (p < 0.001) were noted between the artifact-corrected datasets and the original datasets, where the mean unsigned differences computed over 30 optic-nerve-head-centered scans (in normalized units) were 0.134 ± 0.035 and 0.302 ± 0.134, respectively.
OCIS codes: (100.0100) Image processing, (100.6890) Three-dimensional image processing, (110.4500) Optical coherence tomography
1. Introduction
Optical coherence tomography (OCT) is a non-invasive imaging modality and is widely used in the diagnosis and management of ocular diseases. The new spectral-domain optical coherence tomography (SD-OCT) [1, 2] scanners not only show a higher signal-to-noise ratio than the previous generation time-domain OCT scanners, but also provide close-to-isotropic volumetric images (see Fig. 1(a)) of the retina. However, these images often show large artifactual shifts of the individual A-scans, which are thought to be the result of a number of factors, including motion of the eye and positioning of the camera. Furthermore, these distortions differ along the slow scanning axis (Bs-scans or yz slices) and the fast scanning axis (Bf-scans or xz slices), as depicted in Figs. 1(b) and 1(c). The Bf-scans often show large tilts, which are thought to be caused by imaging paraxially to the optical axis of the eye, while the high frequency artifacts seen in the Bs-scans are attributed to eye and head motion.
Fig. 1.
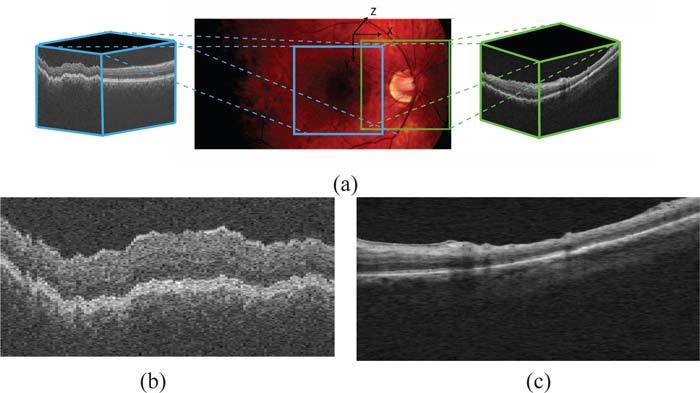
(a) Fundus photograph depicting the regions scanned in macula-centered and ONH-centered OCT images. (b) A typical central Bs-Scan from a macula-centered image showing artifacts characteristic to yz-slices. (c) A typical central Bf-scan (xz-slice) from an unprocessed ONH-centered volume, showing the tilt artifact commonly seen in these slices.
These artifacts not only make it difficult to visualize the data, but they also affect the further processing of the images. Of course, the retina in these scans is also curved due to the natural scleral curvature and while this is not an artifact, it can be advantageous to at least temporarily also remove this curvature for some applications. For instance, segmentation algorithms that incorporate learned information about the layers [3, 4] do so by modeling the behavior of the surfaces of interest. But this is hard to do in the presence of unpredictable artifacts such as those that are seen in the Bs-scans of the OCT images. Surface behavior is also of interest clinically, where it could be used to compare pathological changes to normal data. Bringing the data into a consistent format is also important in 3-D registration applications [5], such as registering ONH to macular scans. Here, a predictable consistent shape can have a significant impact on the result. Thus, the need to correct these artifacts and bring the dataset into a more consistent, predictable shape is compelling.
Since the correction process is intended to be a preprocessing step, it should alter as little as possible of the actual A-scans to avoid losing any information. To this end, numerous approaches have been reported that use correlation in 1-D [6] and 2-D rigid registration [7–13] to correct these artifacts. These registration based methods, while effective, are 2-D methods and thus, do not incorporate 3-D contextual information. The new availability of orthogonal scans has also led to methods [14, 15] that incorporate information from both scans to realign the dataset and remove motion artifact. This is an effective method that not only removes motion artifact but also reconstructs the “true” shape of the retina. However, the application of these methods is restricted by the availability of the orthogonal scans, which are not typically acquired clinically.
Garvin et al. [3], as a preprocessing step for a 3-D intraretinal segmentation algorithm, described a 3-D segmentation-based method that corrects motion artifacts by re-aligning the columns of the image with respect to a smooth “reference” plane. This reference plane is constructed by fitting a smoothing thin-plate spline (TPS) to a surface segmented in a lower resolution. The small number of control points and the large regularization term used in the spline-fit process reduces the dependence on the segmentation result, but the spline is not able to model the fast variations seen along the slow scanning axis. A smaller regularization term would have provided a closer fit to the control points, but this would increase the dependence of the artifact correction on the segmentation result.
In this paper, we describe a segmentation-based method for the correction of distortions seen along the fast and slow scanning axes in OCT retinal scans. The method focuses on correcting the artifacts along each axis separately while retaining the overall 3-D context, which makes our approach able to better address the differences in the types of artifacts characteristic of each axis. This is done by incorporating a priori information regarding the different artifacts seen along these two axial directions and correcting them using dual-stage thin-plate splines fitted to a segmented surface. Additionally, we also present a method to reconstruct the “true” scleral curvature (which is removed by the artifact correction method) given the new availability of orthogonal scans. Note that having orthogonal scans for the optional scleral curvature reconstruction step is important as the scleral curvature is severely disrupted along the slow scanning axis by motion artifact. However, not all applications need the scleral reconstruction step (such as segmentation, registration and thickness-measurement applications).
In addition to visual assessments, the artifact-correction method was validated using pairs of datasets obtained from the same eye using orthogonal fast-scanning directions and depth maps created from stereo fundus photographs. In both validation techniques, significant differences (which are visually apparent) were noted between the original datasets, datasets corrected using a single spline-fit and the datasets corrected using the proposed dual-spline fit process.
2. Methods
The artifact correction process needs a stable surface to which a thin-plate spline can be fit. We therefore, begin by segmenting a surface using an automated graph-theoretic approach [3], which incorporates contextual information (as the segmentation is carried out in 3-D) and also ensures the global optimality of the segmented surface. The surface between the inner and outer segments of the photoreceptor cells (depicted in Fig. 2) is used, as it can be easily and reliably detected in OCT volumes. Two stages of smoothing thin-plate splines (described below) are then used to estimate the distinct artifacts seen in OCT images. In the first stage, a smoothing thin-plate spline is used to estimate and correct the tilt artifacts commonly seen in the Bf-scans. At this stage, the scleral curvature is also removed. A second spline-fit is then used to model and correct the rapidly varying motion artifact characteristic of the Bs-scans.
Fig. 2.

Selected slices from an OCT dataset showing the two surfaces segmented in the original volume. The reference plane is created by fitting a spline in two stages to the lower surface. The inner limiting membrane (ILM) as well as the lower surface are used in validation processes.
Thin-plate splines were first formulated by Duchon [16], who compared the process to the physical bending of a thin sheet of metal. The TPS formulation [17, 18] used in our method generates a smoothing interpolation function as follows:
We begin by defining f to be a function that maps R2 to R for a given set of N points in R2, ν = {νi: i = 1, 2,...,N}. Then, the thin plate spline interpolation function s will be one that minimizes the energy equation:
| (1) |
where x and y are the two components of θ. Let us also define [ϕ1(t), ϕ2(t), ϕ3(t)] = [1, x, y]. Now, for the above energy equation there exists a unique minimizer sλ given by
| (2) |
The parameters dk and ci can be estimated by solving N linear equations. Thus, a 2-D TPS can be fit to a 3-D segmented surface to obtain a smooth (where the smoothness is controlled by λ) 3-D reference plane with respect to which the dataset is flattened. Henceforth in this paper, we shall refer to the surface obtained through the 2-D TPS fit as the 3-D spline surface, and the curve obtained through the 1-D TPS fit as the 2-D spline curve.
To compensate for the two different artifacts seen in the dataset, the flattening is done in two steps (see Fig. 3):
A 2-D TPS is fit to the surface, where the number of control points used is determined by the size of the surface along each axial dimension. At this stage, the number is set to 10% and 5% of the dimensions along the x and y axial directions, respectively, and the control points are evenly distributed along each direction. A relatively large smoothing regularization term (λ = 0.1) is used so that the 3-D spline-fit surface thus created is relatively smooth and approximates the overall curvature of the retinal surfaces seen in the Bf-scans. (Experimentally, we found that values of λ between [0.07, 0.13] provide consistent results.) However, at this stage, the large regularization term used makes it difficult to accurately estimate the artifacts in the slow-scanning direction (Bs-scans). The dataset is now flattened with respect to this reference plane by realigning the columns of the dataset, which eliminates the curvature seen in the Bf-scans as well as any tilt artifacts that may be present.
- The rapid variations seen in the Bs-scans can be corrected in one of two ways:
- The previously computed 3-D spline surface estimates and corrects the artifact along the fast-scanning axis, thus a single 2-D spline curve (computed using a 1-D TPS) can be used to model the artifacts in the Bs-scans. The segmented surface is averaged across the fast-scanning direction to create a single 2-D vector, which approximates the artifact seen in the Bs-scans. A single 1-D spline can now be fit to this vector using evenly spaced control points (totaling 25% of the axial dimension) and a relatively small regularization term (λ = 0.07) to give us a 2-D spline curve, which is used to correct the motion artifact in all the Bs-scans. (Consistent results were obtained for λ = [0.01, 0.07].) Note that the initial creation of the averaged 2-D vector (across all of the Bs-scans) helps to ensure that only the motion artifacts in this direction will be corrected rather than also flattening local retinal distortions, such as those from pathology. This method can be used to correct artifacts in macula scans as the volumes do not contain any regions where the surfaces are discontinuous.
- In the case of optic nerve head (ONH) centered scans (where the surfaces become indistinct at the optic disc), a second 2-D thin-plate spline is fit to the new surface. The 2-D TPS now uses a larger number of control points in the y-direction (25% of the axial dimension) than the x-direction (5% of the axial dimension). These control points are chosen from outside the optic disc region, where the margin is approximated using a circle (2.1mm in diameter). Note that in the case of abnormal optic discs, this margin can be more precisely (and still automatically) determined [19]. The regularization term used in this step is also smaller (λ = 0.05), enabling the resulting 3-D spline surface to model the rapid variations seen along the slow scanning axis. (Consistent results were obtained for λ = [0.03, 0.07].)
Fig. 3.
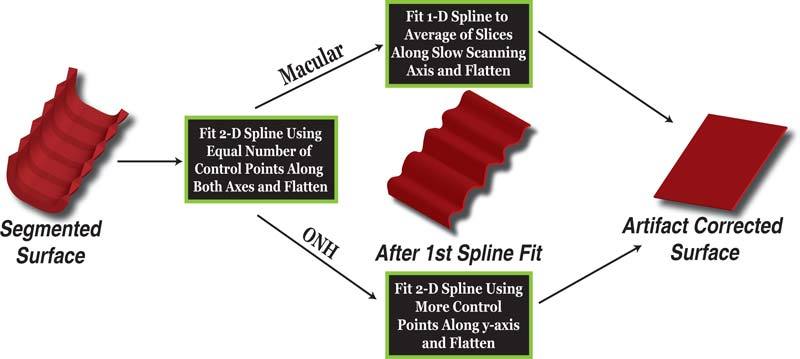
Overview of method to determine flattening plane. The flattening plane is determined by fitting a spline to a surface twice, to eliminate the two distinct artifacts seen in these images.
The final artifact-corrected dataset is now obtained by flattening the image once more with respect to the plane obtained in one of the two ways described above.
3. Experimental Methods
The proposed artifact correction technique was validated using the following two approaches:
The first approach uses pairs of macula OCT scans acquired from the same eye, using orthogonal fast scanning axes. The pairs of OCT scans also made the reconstruction of the ocular curvature in OCT volumes possible. Nine pairs of macula-centered OCT scans were obtained on a SD-OCT1000 spectral-domain scanner (Topcon Corp., Tokyo, Japan) from 9 normal subjects participating in the Rotterdam Study, which is a prospective population-based cohort study investigating age-related disorders. The study population consisted of 7983 individuals aged 55 years and older living in the Ommoord district of Rotterdam, the Netherlands [20–22]. These OCT images, wich were obtained as part of latest follow up in addition to other ophthalmic tests, had dimensions of 512 × 128 × 480 voxels obtained from a 6 × 6 × 2 mm3 region centered on the macula.
The second approach uses 3-D reconstructions of the ONH from stereo fundus photographs. The stereo fundus photographs and the ONH-centered OCT scans were acquired from the same patient on the same day, from both eyes of 15 patients from the Glaucoma Clinic at the University of Iowa. The scans were obtained from a Cirrus spectral-domain scanner (Carl Zeiss Meditec, Dublin, CA, USA), and had dimensions of 200 × 200 × 1024 voxels obtained from a 6 × 6 × 2 mm3 region centered on the ONH.
These two validation methods were used for the macula and ONH-centered scans, respectively, and provided a quantitative assessment of the two variations of the artifact-correction method.
3.1. Validation Using Paired OCT Scans with Orthogonal Fast-Scanning Axes
Since the artifacts seen in OCT images are strongly dependent on the orientation of the fast scanning axis, a pair of OCT scans acquired from the same eye with orthogonal fast scanning axes can be used to assess the accuracy of the artifact correction process. The tilt and low variation artifacts associated with Bf-scans now appear in perpendicular scans in the second dataset, and the same is true of high frequency variations associated with Bs-scans.
Figure 4 shows an example of a pair of OCT images and their mode of acquisition. The central Bf-scan in Fig. 4(a) corresponds to the central Bs-scan in Fig. 4(b), and it is easily seen that the artifacts in the two slices are very different. The curvature and tilt artifacts associated with the Bf-scans are far easier to correct than the rapid variations seen in the Bs-scans, thus, the Bf-scans from one artifact corrected dataset can be used quantitatively to validate the ability of the proposed method to correct artifacts in the Bs-scans of the second dataset.
Fig. 4.
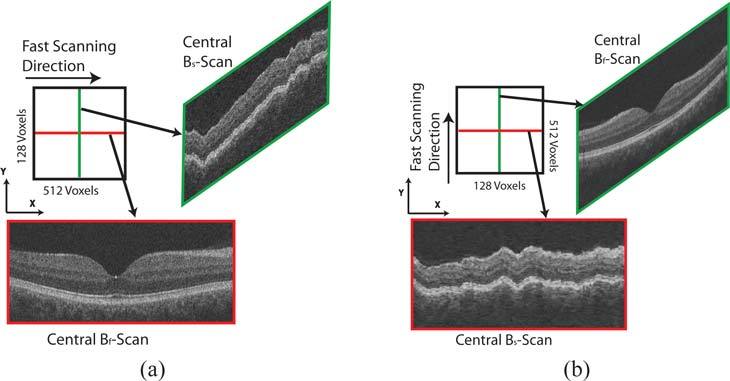
Schematics showing acquisition of OCT datasets with orthogonal fast scanning axes from the same patient. (a) Central Bf-scan and Bs-scan from an OCT image with horizontal fast-scanning axis. (b) Central Bf-scan and Bs-scan from an OCT image acquired from the same eye with vertical fast-scanning axis. Note that the Bf-scan from the first dataset comes from the same location as the Bs-scan from the second dataset.
The quantitative measure of the accuracy of the artifact correction process is expressed using the mean unsigned difference in the location of a particular surface before and after the artifact correction process. The surface between the inner and outer segments of the photoreceptors was segmented and used in the spline-fit, and thus is available for use in the validation as well. An absolute comparison in microns is possible since this surface is flattened to the same depth in the z-axis.
The acquisition process of the OCT datasets creates volumes that are roughly rotated by 90° degrees with respect to each other. Thus, the datasets must first be registered to each other before any comparisons can be made. This was done by manually selecting two correspondence points in the 2-D projection images of the paired datasets. The projection images were created from a small number of slices near the segmented surface (between inner and outer segments of the photoreceptors), as the vessels are much clearer in projection images created in this manner [23]. Vessel crossings and bifurcations can be used as correspondence points. A rigid transformation (as expressed below) can now be used to align the Bf-scans of one dataset with the Bs-scans of the second. It is easily apparent that two points are sufficient to compute the transformation matrix.
| (3) |
In addition to the orthogonality of the scans, the images are also anisotropic in the x and y directions. In order to register the volumes better and make a true comparison between the segmented surface from the orthogonal scans, the projection images and the segmented surface are interpolated (along the smaller dimension) to make them isotropic. The mean unsigned difference between the segmented surface in both datasets can now be computed (within the common registered area) from the original, partially corrected (using a single 3-D spline surface) and the final artifact-corrected image.
3.2. Validation Using 3-D Reconstructions of the Optic Nerve Head
Tang et al. [24] reported a method for the reconstruction of the shape of the ONH from stereo fundus photographs. The 3-D shape estimate is obtained by finding corresponding pixels from two stereo images of the ONH, taken from two slightly different angles. The two image planes are known to be horizontally displaced, but can be assumed to be co-planar. Since the horizontal disparity is known to be inversely proportional to the depth associated with the 3-D pixel, a depth map can be created using pixel correspondences. The depth maps thus created (Fig. 5(b)) show the shape of the retina at the ONH region, and since they are created from fundus photographs they are free of the axial artifacts associated with OCT scans.
Fig. 5.
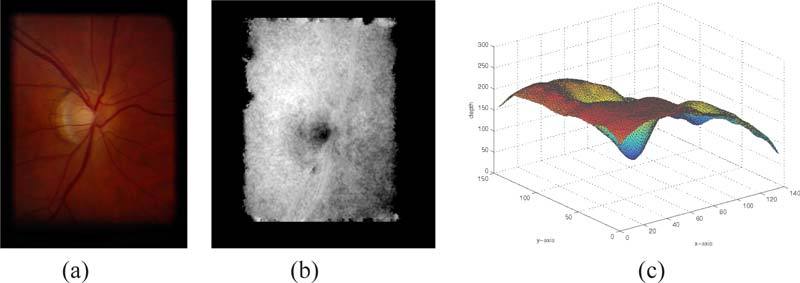
Fundus photograph and its corresponding disparity maps. (a) One of a pair of stero fundus photographs of a glaucomatous eye. (b) The disparity map constructed from the stereo fundus photographs. (c) The smoothed disparity map in 3-D showing the overall shape of the opic nerve head.
The structure obtained from the OCT images that is most comparable to the depth maps is the location of the inner limiting membrane (ILM). Before any comparison can be made between the depth maps and the location of the ILM, we have to compensate for three important characteristics of stereo fundus photographs.
The fundus photographs are not in the same reference frame as the OCT images, thus the depth maps must first be registered to the OCT dataset. Vessel locations were used to guide the rigid registration of the fundus images to the 2-D projection image created from the OCT image, as described in Section 3.1.
The depth from stereo estimations contain noise, which is seen in the depth maps. Thus, the depth maps must first be smoothed to validate the artifact correction process. The smoothing was done so that the noise was suppressed while the shape information from the depth maps was retained. Figure 5 shows the fundus photograph, its corresponding depth map and 3-D rendering of a smoothed depth map.
The depth maps do not provide quantitative depth information, as these are serial stereo photos and stereotactic positions (angle between camera positions) is not available. Thus, the location of the segmented surface from the OCT images must be scaled and expressed in normalized units. For this, we consider the depth of the surface from the top of the OCT dataset and normalize this depth by dividing by 200. We then scale this normalized depth to match the scale of the depth maps. The z-axis depth location of the reference plane for all datasets is maintained at the same value to minimize variations between the datasets.
A pixel by pixel comparison can now be made between the smoothed depth maps and the normalized depth of the ILM in the flattened OCT datasets.
4. Modeling the Shape of the Eye
The pairs of OCT datasets acquired from the same eye can be used to estimate the shape of the eye since the Bf-scans, which contain information about the retinal curvature, are available along two perpendicular axis. Thus, in datasets with small or no tilts induced by the incorrect positioning of the camera, the Bf-scans from one dataset can be used to “correct” the Bs-scans in the second dataset, creating a dataset where the retinal surfaces now reflect a better approximation of the shape of the eye.
A 2-D TPS is fit to the segmented surface from each of the datasets to create a 3-D interpolated isotropic surface. The 3-D spline surface thus created is not only smooth and isotropic, but is also less dependent on the segmentation result. Figures 6(a) and 6(b) show the isotropic surfaces created from the datasets with the horizontal and vertical fast scanning axes, respectively. The Bf-scans from the dataset with the vertical fast scanning axis can now be used to correct the artifacts in the Bs-scans of the dataset with the horizontal fast scanning axis. Since the datasets are acquired from the same area of the retina, the isotropic surfaces can now be used to estimate the z-axis translations required to correct the rapid variations seen along the slow scanning axis. Correcting the artifact in this manner will retain the ocular shape of the retina. The final shape corrected surface is as shown in Fig. 6(c).
Fig. 6.
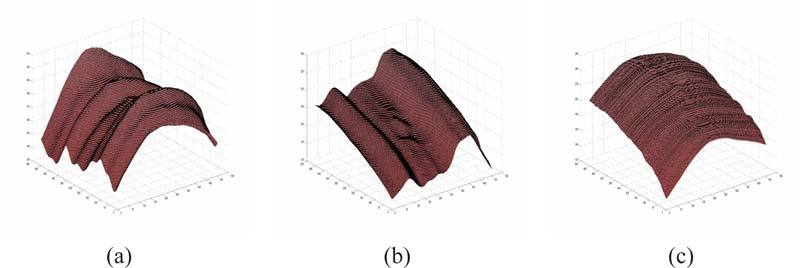
Estimating the shape of the eye from paired OCT datasets with orthogonal fast scanning axes. The isotropic surfaces obtained by fitting a thin-plate spline to a segmented surface from (a) the dataset with the horizontal fast scanning axes, and (b) the dataset with the vertical fast scanning axes. (c) The estimate of the “true” curvature of the retina.
5. Results
The quantitative results are summarized in Table 1. In the first validation technique (using the paired macula-centered scans), a segmented surface from the two datasets was compared before and after the artifact-correction process. The mean unsigned differences seen in the original and partially corrected (single spline-fit) datasets were 98.97 ± 39.45 μm and 23.36 ± 4.04 μm, respectively. The artifact-corrected datasets, on the other hand, only showed a mean unsigned difference of 5.94 ± 1.10 μm, which is significantly smaller (p < 0.001, from two-tailed paired t-test) when compared to the partially corrected datasets. Figure 7 shows an example of the 3-D representation of the original surface used to create the reference plane, the surface after the first spline-fit and the surface in the final artifact-corrected image.
Table 1.
Mean Unsigned Difference Seen in the Original, Partially Corrected and Final Artifact-Corrected Images
| Original Volume | Single Spline Fit | Artifact-Corrected Volume | |
|---|---|---|---|
| Validation Technique 1⋄ | 98.97 ± 39.45 | 23.36 ± 4.04 | 5.94 ± 1.10 |
| Validation Technique 2★ | 0.302 ± 0.134 | 0.142 ± 0.036 | 0.134 ± 0.035 |
Mean unsigned difference was computed between the location of a segmented surface in the paired OCT datasets and expressed in μm.
Mean unsigned difference was computed between the disparity maps and the normalized depth of the ILM. Average value is expressed as mean ± standard deviation in normalized units. Differences were computed in regions where the disparity maps were well defined. The optic disc was avoided.
Fig. 7.
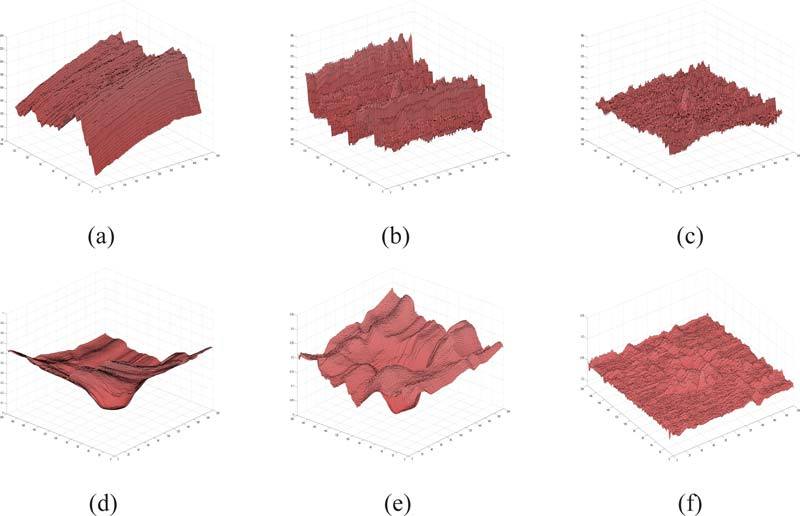
Examples of the surface used to create the reference plane. (a), (b) and (c) show the segmented surfaces from a macula-centered OCT dataset in the original, partially corrected and final artifact-corrected image, respectively. (d), (e) and (f) show the segmented surface from an ONH centered OCT dataset in the original, partially corrected and final artifact-corrected image, respectively.
Figure 7(b) shows the segmented surface in a macula-centered OCT dataset after the first spline fit, and it is easy to see the periodic nature of the artifact along the y-axis. The single 2-D spline curve computed (using a 1-D TPS fit to an averaged 2-D vector) along this axis is more than sufficient to estimate this artifact and eliminate it, as can be seen in Fig. 7(c). Figures 8(a) and 8(b) shows the central Bf-scan and Bs-scan, respectively, from a maculacentered OCT dataset before the artifact correction process. The same slices after the artifact correction process are depicted in Figs. 8(c) and 8(d).
Fig. 8.
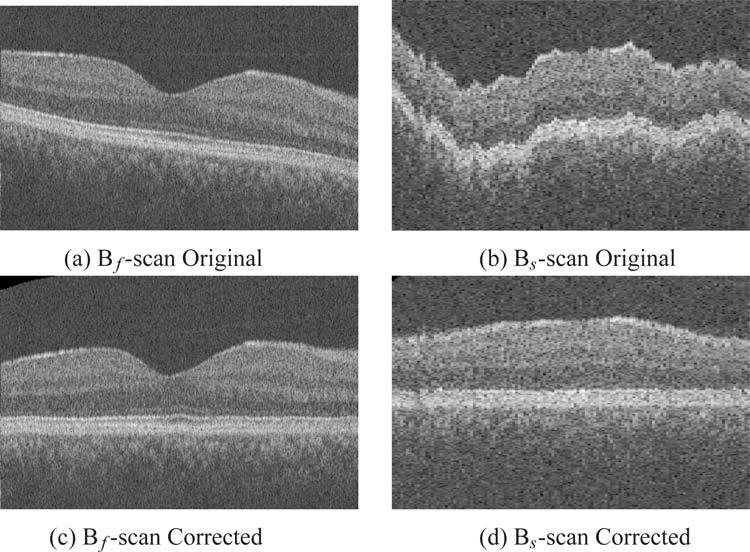
Central Bf-Scan and Bs-scan slices from an OCT dataset before and after flattening. Original (a) Bf-Scan and, (b) Bs-Scan before artifact correction, respectively. Artifact corrected (c) Bf-Scan and (d) Bs-Scan, respectively.
In the second validation method, 3-D depth maps created from stereo fundus images were compared to the ILM. As the depth maps are created from the fundus photographs and can sometimes show only a small region around the optic disc, care was taken to ensure that the difference was only calculated in areas where the disparity map was well defined. The optic disc region was also avoided. The mean unsigned difference (computed in normalized units) seen in the original and partially corrected (single spline fit) datasets was found to be 0.321 ± 0.134 and 0.142 ± 0.036, respectively. The artifact-corrected datasets showed a mean unsigned difference of 0.134 ± 0.035, which is significantly smaller (p < 0.001, from two-tailed paired t-test) when compared to the original datasets.
Figures 7(d), 7(e) and 7(f) show the segmented surface from an ONH centered dataset in the original datatset, the dataset after correction with a single 3-D spline surface, and the dataset after the second 3-D spline surface correction process, respectively. The optic disc disrupts the surfaces (as seen in Figs. 7(d) and 7(e)) necessitating the use of a second 3-D spline surface instead of a 2-D spline curve. Figure 9 shows the ILM and two slices from an ONH-centered dataset in different stages of artifact correction. The vast difference between the original and artifact-corrected images is easily apparent in the slices depicted in Figs. 9(a) and 9(b), respectively.
Fig. 9.
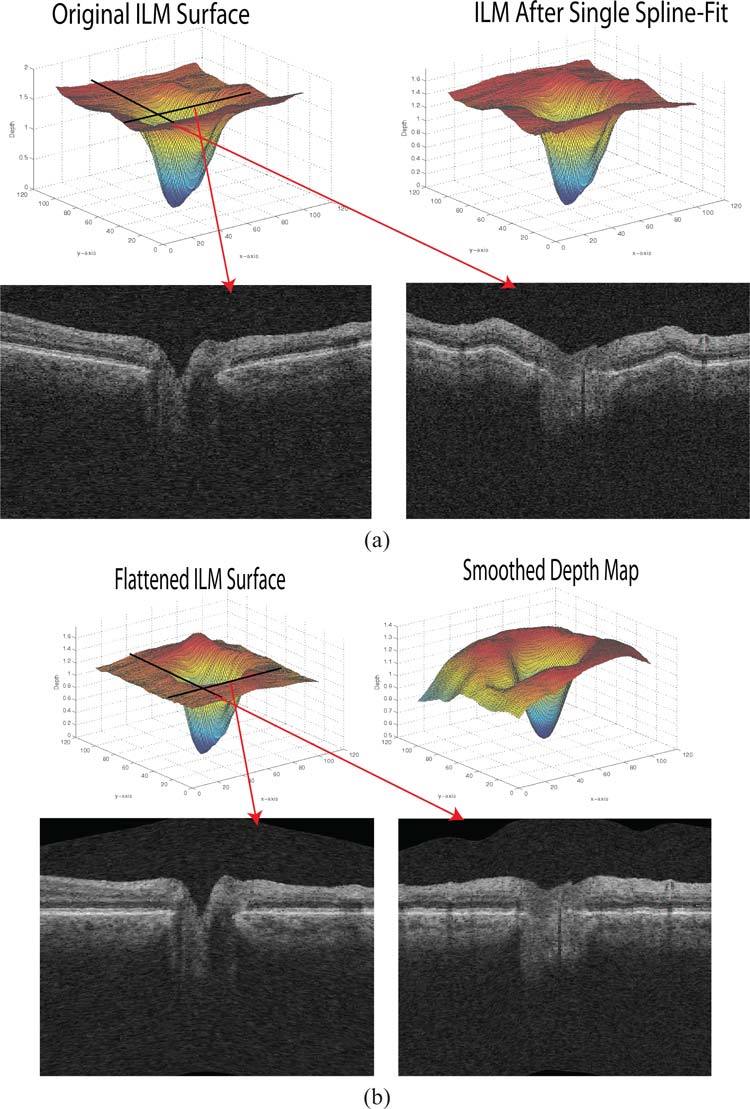
An ONH-centered dataset before and after the axial artifact correction. (a) The ILM in the original dataset and after the first spline fit. Bf-scan and Bs-scan from the original dataset from the locations as indicated by arrows in red. (b) The ILM in the flattened artifact corrected dataset with the same Bf-scan and Bs-scans from the flattened dataset. Smoothed depth image also included.
6. Discussion and Conclusion
Eliminating motion artifacts in OCT images is important as it brings the dataset into a consistent shape and makes visualization and subsequent analysis easier. While the removal of the scleral curvature seen in the Bf-scans is undiserable in some applications, numerous applications such as the automated segmentation of intraretinal layers [3, 4], and the volumetric registration of OCT-to-OCT [5] datasets would benefit from the consistency of an artifact-corrected dataset.
In this work, we have presented a method for the correction of axial artifacts using thin-plates splines that estimate the distortions along the fast and slow scanning axes in OCT retinal scans. Our results show that the TPS approach is effective, as it is able to create a globally smooth surface whose properties are easily controlled by the regularization parameter and the number of control points used. The proposed method aims to eliminate all of the artifacts, and therefore does not retain any information about the shape of the retina; however, given the new availability of orthogonal OCT scans on clinical OCT machines, the shape can be estimated and reconstructed. It is also important to note that the approach does not alter the data in any way other than the z-axis translation (which is a reversible transformation), and thus does not affect any measurements derived from the A-scans. The time complexity of the method largely depends on the number of control points used in the TPS fit, as the surface segmentation takes under a minute. Our implementation (in C++, on a 2.8GHz six-core AMD Opteron processor) took a total time of 7–9 minutes to segment the surface and correct the artifacts in the OCT volumes.
The robustness of the correction procedure is evident from the results obtained on a diseased set of OCT scans, where the surface segmentation is more prone to error. While the dependence on the segmentation result is undesirable, it does provide vital information in scans where the camera has been incorrectly positioned and the retinal surfaces appear skewed. In such situations, the 3-D spline surface flattening procedure would show better results than 2-D rigid registrations methods, as the 2-D registration approaches only aim to correct the motion artifacts, but do not address the tilt artifacts. Furthermore, the 2-D registration could introduce artifacts into the image in the form of unwanted translational or rotational changes, as the they are not guided by 3-D contextual information. The use of SLO images [13] or fundus photography would be necessary to ensure that the such artifacts do not affect the end result. Alternatively, a combination of segmentation and registration-based methods could be used to retain 3-D contextual information during the artifact correction process.
Thus, in summary, with our two-stage flattening approach, we are able to correct multiple types of axial artifacts (some for which the initial 3-D surface segmentation is necessary or useful for artifact-modeling purposes), while still demonstrating a robustness against any small local disruptions or errors in the initial segmentation result. With orthogonal scans, we are then further able to estimate the true shape of the retina.
Acknowledgments
This work was supported in part by the Department of Veterans Affairs; the National Institutes of Health grants NEI EY017066, R01 EY018853 and R01 EY019112; Research to Prevent Blindness, New York, NY; Marlene S. and Leonard A. Hadley Glaucoma Research Fund; Stichting Lijf en Leven, Krimpen aan de Lek; MD Fonds, Utrecht; Rotterdamse Vereniging Blindenbelangen, Rotterdam; Stichting Oogfonds Nederland, Utrecht; Blindenpenning, Amsterdam; Blindenhulp, The Hague; Algemene Nederlandse Vereniging ter Voorkoming van Blindheid (ANVVB), Doorn; Landelijke Stichting voor Blinden en Slechtzienden, Utrecht; Swart van Essen, Rotterdam; Stichting Winckel-Sweep, Utrecht; Henkes Stichting, Rotterdam; Lamris Ootech BV, Nieuwegein; Medical Workshop, de Meern; Topcon Europe BV, Capelle aan de IJssel, all in the Netherlands, and Heidelberg Engineering, Dossenheim, Germany.
References and links
- 1.Huang D., Swanson E. A., Lin C. P., Schuman J. S., Stinson W. G., Chang W., Hee M. R., Flotte T., Gregory K., Puliafito C. A., “Optical coherence tomography,” Science 254, 1178–1181 (1991). 10.1126/science.1957169 [DOI] [PMC free article] [PubMed] [Google Scholar]
- 2.Wojtkowski M., Srinivasan V., Fujimoto J. G., Ko T., Schuman J. S., Kowalczyk A., Duker J. S., “Three dimensional retinal imaging with high-speed ultrahigh-resolution optical coherence tomography,” Ophthalmology 112, 1734–1746 (2005). 10.1016/j.ophtha.2005.05.023 [DOI] [PMC free article] [PubMed] [Google Scholar]
- 3.Garvin M. K., Abràmoff M. D., Wu X., Russell S. R., Burns T. L., Sonka M., “Automated 3-D intraretinal layer segmentation of macular spectral-domain optical coherence tomography images,” IEEE Trans. Med. Imaging 28, 1436–1447 (2009). 10.1109/TMI.2009.2016958 [DOI] [PMC free article] [PubMed] [Google Scholar]
- 4.Kajić V., Považay B., Hermann B., Hofer B., Marshall D., Rosin P., P., Drexler W., “Robust segmentation of intraretinal layers in the normal human fovea using a novel statistical model based on texture and shape analysis,” Opt. Express 20, 4730–14744 (2010). [DOI] [PubMed] [Google Scholar]
- 5.Niemeijer M., Garvin M. K., Lee K., van Ginneken B., Abràmoff M. D., Sonka M., “Registration of 3D spectral OCT volumes using 3D SIFT feature point matching,” Proc. SPIE 7259, 72591I (2009). 10.1117/12.811906 [DOI] [Google Scholar]
- 6.Ishikawa H., Stein D. M., Wollstein G., Beaton S., Fujimoto J. G., Schuman J. S., “Macular segmentation with optical coherence tomography,” Invest. Ophthalmol. Vis. Sci. 46, 2012–2017 (2005). 10.1167/iovs.04-0335 [DOI] [PMC free article] [PubMed] [Google Scholar]
- 7.Thevenaz P., Ruttimann U., Unser M., “A pyramid approach to subpixel registration based on intensity,” IEEE Trans. Image Process. 7, 27–41 (1998). 10.1109/83.650848 [DOI] [PubMed] [Google Scholar]
- 8.Abramoff M. D., Magelhaes P. J., Ram S. J., “Image processing with ImageJ,” Biophoton. Int. 11, 36–42 (2004). [Google Scholar]
- 9.Zawadzki R. J., Fullerb A. R., Choia S. S., Wileyb D. F., Hamannb B., Wernera J. S., “Correction of motion artifacts and scanning beam distortions in 3-D ophthalmic optical coherence tomography imaging,” Proc. SPIE 6426, 642607 (2007). 10.1117/12.701524 [DOI] [Google Scholar]
- 10.Fuller A. R., Zawadzki R. J., Choi S., Wiley D. F., Werner J. S., Hamann B., “Segmentation of three-dimensional retinal image data,” IEEE Trans. Vis. Comput. Graph. 13, 1719–1726 (2007). 10.1109/TVCG.2007.70590 [DOI] [PMC free article] [PubMed] [Google Scholar]
- 11.Zawadzki R., Choi S., Jones S., Oliver S., Werner J., “Adaptive optics-optical coherence tomography: optimizing visualization of microscopic retinal structures in three dimensions,” J. Opt. Soc. Am. 24, 1373–1383 (2009). 10.1364/JOSAA.24.001373 [DOI] [PMC free article] [PubMed] [Google Scholar]
- 12.Khanifar A., Koreishi A., Izatt J., Toth C., “Drusen ultrastructure imaging with spectral domain optical coherence tomography in age-related macular degeneration,” Ophthalmology 115, 1883–1890 (2008). 10.1016/j.ophtha.2008.04.041 [DOI] [PMC free article] [PubMed] [Google Scholar]
- 13.Ricco S., Chen M., Ishikawa H., Wollstein G., Schuman J., “Correcting motion artifacts in retinal spectral domain optical coherence tomography via image registration,” in Proceedings of Medical Image Computing and Computer-Assisted Intervention (MICCAI) LNCS 5761, pp. 100–107 (2009). [DOI] [PMC free article] [PubMed] [Google Scholar]
- 14.Kraus M., Mayer M. A., Bock R., Potsaid B., Manjunath V., Duker J. S., Hornegger J., Fujimot J. G., “Motion artifact correction in OCT volume scans using image registration,” Invest. Ophthalmol. Vis. Sci. 51, ARVO E-Abstract 4405 (2010). [Google Scholar]
- 15.Song X., Estrada R., Chiu S. J., Dhalla A., Toth C.A., Izatt J. A., Farsiu S., “Segmentation-based registration of retinal optical coherence tomography images with pathology,” Invest. Ophthalmol. Vis. Sci. 52, ARVO E-Abstract 1309 (2011).214826453053271 [Google Scholar]
- 16.Duchon J., “Splines minimizing rotation-invariant semi-norms in Sobolev spaces,” in Constructive Theory of Functions of Several Variables (Springer-Verlag, 1977), pp. 85–100 10.1007/BFb0086566 [DOI] [Google Scholar]
- 17.Bookstein F. L., “Principal warps: thin-plate splines and the decomposition of deformations,” IEEE Trans. Pattern Anal. Machine Intell. 11, 567–585 (1989). 10.1109/34.24792 [DOI] [Google Scholar]
- 18.Powell M. J. D., “The uniform convergence of thin plate spline interpolation in two dimensions,” Numerische Math. 68, 107–128 (1994). 10.1007/s002110050051 [DOI] [Google Scholar]
- 19.Hu Z., Abràmoff M. D., Kwon Y. H., Lee K., Garvin M. K., “Automated segmentation of neural canal opening and optic cup in 3D spectral optical coherence tomography volumes of the optic nerve head,” Invest. Ophthalmol. Vis. Sci. 51, 5708–5717 (2010). 10.1167/iovs.09-4838 [DOI] [PMC free article] [PubMed] [Google Scholar]
- 20.Wolfs R. C., Borger P. H., Ramrattan R. S., Klaver C. C., Hulsman C. A., Hofman A., Vingerling J. R., Hitchings R. A., de Jong P. T., “Changing views on open-angle glaucoma: definitions and prevalences-the Rotterdam study,” Invest. Ophthalmol. Vis. Sci. 41, 3309–3321 (2000). [PubMed] [Google Scholar]
- 21.Hofman A., Breteler M. M. B., Van Duijn C. M., Janssen H. L. A, Krestin G. P., Kuipers E. J., Stricker B. C. H., Tiemeier H., Uitterlinden A. G., Vingerling J. R., Witteman J. C. M., “The Rotterdam Study: 2010 objectives and design update,” Eur. J. Epidemiol. 24, 553–572 (2009). 10.1007/s10654-009-9386-z [DOI] [PMC free article] [PubMed] [Google Scholar]
- 22.Czudowska M. A., Ramdas W. D., Wolfs R. C., Hofman A., De Jong P. T., Vingerling J. R., Jansonius N. M., “Incidence of glaucomatous visual field loss: a ten-year follow-up from the Rotterdam study,” Ophthalmology 117, 1705–1712 (2010). 10.1016/j.ophtha.2010.01.034 [DOI] [PubMed] [Google Scholar]
- 23.Niemeijer M., Garvin M. K., van Ginneken B., Sonka M., Abràmoff M. D., “Vessel segmentation in 3-D spectral OCT scans of the retina,” Proc. SPIE 6914, 69141R (2008). 10.1117/12.772680 [DOI] [Google Scholar]
- 24.Tang L., Garvin M. K., Lee K., Alward W. L. M., Kwon Y. H., Abràmoff M. D., “Robust multi-scale stereo matching from funuds images with radiometric differences,” IEEE Trans. Pattern Anal. Machine Intell. in press. [DOI] [PMC free article] [PubMed]


