

Abstract
The effects of aging and IQ on performance were examined in four memory tasks: item recognition, associative recognition, cued recall, and free recall. For item and associative recognition, accuracy and the response time distributions for correct and error responses were explained by Ratcliff’s (1978) diffusion model, at the level of individual participants. The values of the components of processing identified by the model for the recognition tasks, as well as accuracy for cued and free recall, were compared across levels of IQ ranging from 85 to 140 and age (college-age, 60-74 year olds, and 75-90 year olds). IQ had large effects on the quality of the evidence from memory on which decisions were based in the recognition tasks and accuracy in the recall tasks, except for the oldest participants for whom some of the measures were near floor values. Drift rates in the recognition tasks, accuracy in the recall tasks, and IQ all correlated strongly with each other. However, there was a small decline in drift rates for item recognition and a large decline for associative recognition and accuracy in cued recall (about 70 percent). In contrast, there were large age effects on boundary separation and nondecision time (which correlated across tasks), but little effect of IQ. The implications of these results for single- and dual- process models of item recognition are discussed and it is concluded that models that deal with both RTs and accuracy are subject to many more constraints than models that deal with only one of these measures. Overall, the results of the study show a complicated but interpretable pattern of interactions that present important targets for response time and memory models.
Keywords: Reaction time, diffusion model, memory, item and associative recognition, IQ and age
In memory research, there is general agreement on a distinction between item and associative information. In tasks that tap item information, participants are asked to decide whether a test item was presented earlier in an experiment. In tasks that tap associative information, participants are asked to decide whether two items of a pair were presented earlier in the same pair or in a different pair. This distinction has a long history in experimental psychology. Murdock (1974), for instance, made the distinction a centerpiece of his approach to memory and he reviewed much of the earlier work separating these two forms of memory. More recently, a number of studies have provided compelling evidence for the distinction (Clark & Shiffrin, 1992; Hockley, 1991, 1994; Hockley & Cristi, 1996; Humphreys, 1976, 1978; Malmberg & Xu, 2007; Murdock, 1974, 1992).
In this article, we set global memory models as the context for our research on item and associative information (Dennis & Humphreys, 2001; Gillund & Shiffrin, 1984; Humphreys, Bain, & Pike, 1989; McClelland & Chappell, 1998; Murdock, 1982; Shiffrin & Steyvers, 1997). The item-associative distinction has been a fundamental component of these models since their beginnings. In all of these models, item and associative information are stored together in a single memory store. Whether items are stored as vectors (Murdock, 1982) or cue-target associations (Gillund & Shiffrin, 1984), there are not two separate stores. Instead, item and associative recognition correspond to different ways of retrieving information from a single memory store. In contrast to global memory models, there are dual-process models (e.g., Kelley & Wixted, 2001; Yonelinas, 1997). For these models, item recognition and associative information can depend on separate sources of information. Item recognition is said to depend mostly on “familiarity,” whereas associative recognition is said to depend mostly on “recollection.” At the end of this article, we discuss dual-process theories in detail.
The experiment presented in this article provides new results that address the item- associative distinction. In the experiment, item recognition was tested with participants studying lists of single words, each followed by a test list of single words to which they responded “old” or “new.” Associative recognition was tested with participants studying lists of pairs of words, each followed by a test list made up of pairs of words. Participants responded according to whether the words of a pair had appeared in the same pair in the study list (“intact”) or different pairs in the study list (“rearranged”).
The first innovation reported here is that we apply the well-established diffusion model for response times (RTs) and accuracy to the data from associative recognition. Most previous studies of associative recognition have measured only accuracy. For this study, we measured both accuracy and RTs. It is important to stress that these two measures can behave differently as a function of age. For item recognition, previous research has found that older adults can be nearly as accurate as young adults, but they are much slower. For associative recognition, we might find a similar result for speed-- older adults much slower-- but we might also find that they are less accurate. The fact that the two variables can behave differently means that a full explanation of item and associative recognition must accommodate both accuracy and RT measures.
In previous articles, we have shown that the diffusion model can account for changes in RTs and accuracy across conditions in a range of experimental tasks, including animacy categorization, brightness discrimination, color discrimination, item recognition, letter discrimination, lexical decision, numerosity discrimination, recognition memory, and visual search (Ratcliff, 1978, 1981, 2002; Ratcliff & Rouder, 2000; Ratcliff, Van Zandt, & McKoon, 1999; Voss, Rothermund, & Voss, 2004). In research in domains such as aging, child development, sleep deprivation, depression, anxiety, aphasia, hypoglycemia, and vigilance, diffusion model analyses have led to new and different interpretations of performance, in particular, by taking into account differences in speed-accuracy tradeoff settings across participants and experimental conditions (Geddes et al., 2010; Ratcliff, Perea, Coleangelo, & Buchanan, 2004; Ratcliff, Schmiedek, & McKoon, 2008; Ratcliff, Thapar, & McKoon, 2001; 2003, 2004, 2006a, 2006b, 2007, 2010; Ratcliff, Love, Thompson, & Opfer, in press; Ratcliff & Van Dongen, 2009; Schmiedek, et al., 2007; Spaniol, Madden, & Voss, 2006; Wagenmakers et al., 2007; White, Ratcliff, Vasey, & McKoon, 2009; 2010a; 2010b).
The experiment in this article used an individual differences approach to ask questions about item and associative memory. The diffusion model was used to describe and compare the components of processing that underly performance at the level of individual participants. The model explains differences in performance among individuals in terms of their speed-accuracy trade off settings and the quality of the information upon which their decisions are based, as well as processes such as encoding and response execution.
The second innovation for the research reported here is that we examined the effects of both IQ and age on item and associative recognition. We used differential effects of IQ and age to separate the retrieval of item information from the retrieval of associative information. To anticipate the findings, we show that item and associative recognition decline differentially with IQ and age.
Our approach here can be distinguished from previous studies of IQ. Much of the work using IQ has focused on an “abilities” approach in which measures from a range of different tasks are combined to represent a single construct. We know of little research on the relationship between IQ and item or associative recognition (Kaufman, DeYoung, Gray, Brown, & Mackintosh, 2009). Furthermore, what research has been done for IQ and long-term memory has been framed in terms of, for example, how working memory and speed-of-processing measures can be used to account for individual differences in long-term memory (e.g., Unsworth, 2010).
For the effects of aging, the situation is different, with considerable research on the effects of aging on item and associative memory. Data suggest that associative memory declines with age more than item memory (e.g., Buchler & Reder, 2007; Craik, 1983, 1986; Craik & McDowd, 1987; Healy, Light, & Chung, 2005; Kausler, 1994; Naveh-Benjamin, 2000; Schonfield & Robertson, 1966; Wahlin, Backman, & Winblad, 1995). For item recognition, the decrements with age have been relatively small (Balota, Dolan, & Duchek, 2000; Bowles & Poon, 1982; Craik, 1994; Craik & Jennings, 1992; Erber, 1974; Gordon & Clark, 1974; Kausler, 1994; Neath, 1998, Chap. 16; Rabinowitz, 1984; Schonfield & Robertson, 1966). For associative recognition, Old and Naveh- Benjamin (2008) conducted a meta-analysis of data from 90 studies and found larger age-related deficits for associative recognition than item recognition, under a wide variety of experimental manipulations.
To summarize, there were three specific goals for the experiment described below. The first was to use Ratcliff’s diffusion model (1978; Ratcliff & McKoon, 2008) to extract out, from RT and accuracy data, measures of the components of processing involved in item and associative recognition. The aim was that differences among individuals in their speed-accuracy criterion settings could be separated out of their data so as to allow pure comparisons of memory ability across the two tasks.
The second goal was to examine the effects of age and IQ on item and associative recognition. We expected that item and associative recognition would decline in memory at different rates as a function of age, but perhaps interacting with IQ.
The third goal was to examine individual differences within age groups. In the experiment, there were three groups of participants: college-age, 60-74 year olds, and 75-90 year olds. IQ’s ranged from 85 to 140. We expected performance to be worse for lower IQ participants, but perhaps how much worse would depend on age. For example, high IQ participants might perform better than low IQ participants for college-age participants, but less so for 75-90 year-olds.
Our experiment was focused on item and associative recognition. However, to (modestly) connect with research on recall, we included tests of cued and free recall, both of which require associative information. For cued recall, participants studied pairs of words and then they were given the first word of each studied pair and asked to recall the second. For free recall, they studied lists of single words and then were asked to recall as many of them as possible.
The Diffusion Model, Aging, and IQ
The diffusion model applies to two-choice tasks for which RTs are short, typically less than 1.5 sec. In the model, evidence about a stimulus is accumulated over time from a starting point (z) to one or the other of two criterial amounts, or boundaries, one for each choice. The better the information from a stimulus, the faster evidence is accumulated. The rate of accumulation of evidence is called drift rate, v. A response is executed when the amount of accumulated evidence reaches a criterion, either 0 for a negative response or a for a positive response. The processes outside the decision process (e.g., encoding, memory access, and response execution) are combined into a single parameter of the model with mean duration Ter). Within-trial variability (noise) in the accumulation of information from the starting point to the criteria results in processes with the same mean drift rate terminating at different times (producing RT distributions) and sometimes terminating at the wrong boundary (producing errors).
The values of drift rate, the criteria, and the non-decision component vary from trial to trial. This assumption is required if participants cannot accurately set these parameters to have the same values from trial to trial (e.g., Laming, 1968; Ratcliff, 1978). Across-trial variability in drift rate is assumed to be normally distributed with SD η and across-trial variability in the nondecision component is assumed to be uniformly distributed with range st. Across-trial variability in the distance between the two criteria is equivalent to across-trial variability in the starting point (if such variability is not too large), which is assumed to be uniformly distributed with range sz. Across- trial variability in drift rate and starting point are necessary for the model to account for the relative speeds of correct versus error RTs (Ratcliff et al., 1999). The model fits both correct and error RT distributions (an example is given later).
In addition to across-trial variability, performance also includes “contaminant” responses- - responses that are spurious in that they do not come from the decision process of interest (e.g., distraction, lack of attention). To accommodate these responses, on some proportion of trials (po), a random delay is added to the decision RT. The across-trial variability in po is uniform between the maximum and minimum RTs for each experimental condition (the assumption of a uniform distribution is not critical; recovery of diffusion model parameters is robust to the form of the distribution; Ratcliff, 2008).
The model is designed to explain all aspects of the data: accuracy, mean correct and error RTs, RT distributions, and the relative speeds of correct and error responses. With only a single 45-minute experimental session, the model can successfully fit data for individual participants, with standard deviations in the parameter estimates for boundary separation, nondecision time, and drift rate typically 3 to 5 times smaller than the standard deviations across participants.
The diffusion model is tightly constrained. The most powerful constraint comes from the requirement that the model fit the right-skewed shape of RT distributions (Ratcliff, 1978, 2002; Ratcliff & McKoon, 2008; Ratcliff et al., 1999). In addition, across experimental conditions that vary in difficulty (and are randomly intermixed at test), changes in accuracy, quantile RTs, and the relative speeds of correct and error responses are all captured by changes in only one parameter of the model, drift rate. The response criteria cannot be adjusted as a function of difficulty because it would be necessary for the system to know which level of difficulty was being tested before the accumulation of evidence began. It is also usually assumed that the processes that make up the nondecision component of the model do not vary with difficulty.
The diffusion model has been applied to a range of experimental tasks with younger and older adults as participants (Ratcliff, Thapar, & McKoon, 2001, 2003, 2004, 2006a, 2006b, 2007; 2010; Ratcliff, Thapar, Gomez, & McKoon, 2004; Spaniol, Madden, & Voss, 2006; and Thapar, Ratcliff & McKoon, 2003, the Ratcliff et al. papers are henceforth referenced as RTM). In particular, item recognition data show large increases in RTs with age coupled with small changes in accuracy or no changes in accuracy at all (Ratcliff, et al. 2004, 2006a, 2007; 2010). The RT data suggest large decrements in information in memory with age whereas the accuracy data suggest only small decrements. The diffusion model reconciles these seemingly inconsistent results by mapping the two dependent variables onto the same underlying decision process. We have found that large increases in RTs with age are due mainly to increases in criteria settings and the duration of the nondecision processes. Small or nonexistent deficits in accuracy are due to small or nonexistent decreases in drift rates. From these findings we conclude that, for item recognition, drift rates change little with age.
With IQ, item recognition data show a different pattern. Ratcliff et al. (2010) found that accuracy increases with IQ but that IQ has only small effects on RT. The model handles this with drift rates. Drift rates increase with IQ, as would be expected, but the changes in the criteria and the nondecision component are small.
Experiment
We used the four tasks described above: item recognition, associative recognition, cued recall, and free recall. For the two recognition tasks, we collected sufficient data to allow estimation of the components of processing identified by the diffusion model at the level of individual participants. Also, for all four tasks, we collected sufficient data to allow calculations of meaningful correlations. We calculated correlations among all the performance measures and, for the two recognition tasks, all the components of the diffusion model.
The experiment was designed to answer several questions. One was whether the diffusion model could be extended to associative recognition. The second was whether there would be significant correlations across participants between item recognition and the associative recognition and recall tasks; if so, the data would suggest that the tasks depend on a common representation in memory.
Two further questions were, first, whether there were significant effects of age and IQ on item recognition, associative recognition, cued recall, and free recall; and second, whether the effects of age were modulated by IQ. For example, it might be that performance declined with age for low IQ participants more than for high IQ participants, and perhaps this might be true for associative but not item recognition.
In the experiment, each participant participated in three sessions, one to test item recognition, one to test associative recognition, and one to test cued and free recall. Some of the demographic measures described below were tested at the end of the first session, some at the end of the second, and some at the end of the third. All four tasks consisted of a series of study-test blocks. For the item recognition task, each block was made up of 12 single words to study plus one buffer word at the end of the study list, followed by 26 test words, with the first two test words being either the buffer word or a negative filler. For each test word, participants were asked to respond “yes” or “no” according to whether the word had appeared in the immediately preceding study list. For the associative recognition task, each block contained eight pairs of words to study, each presented twice in random order, with one buffer pair at the beginning of each block and a different buffer pair at the end, followed by eight test pairs, with the first pair testing either an intact buffer pair or a rearranged pair constructed from the two buffer pairs. For each test pair, participants were asked to respond “intact” if the two words had been studied in the same pair or “rearranged” if they had been studied in different pairs. For the cued recall task, each block contained 16 pairs of words to study, each presented twice, followed by the first words of each pair presented as cues for recall. For the free recall task, each block contained eight single words to study, each presented twice, followed by instructions to recall the eight words.
For the associative recognition task, the words of all the test pairs were presented for study, which means that only associative information could be used to make a decision. Also, participants were strongly encouraged to respond quickly. The aim was that only associative information that was available immediately at test could be used to make a decision, so that it would be unlikely that participants would engage in strategic processes such as several different recall attempts.
Method
Participants
46 college-age participants, 45 60-74 year olds, and 43 75-90 year olds participated in the experiment. The college-age participants were recruited at Bryn Mawr College and Ohio State University and in surrounding areas. The older adults were community-dwelling volunteers from the Bryn Mawr, PA, and Columbus, OH, areas. All participants were paid for their participation, $15.00 per session for the older adults, $12.00 for college-age students who did not drive to the lab, and $15.00 for those who did. All had a score of 26 or above on the Mini-Mental State Examination (Folstein, et al., 1975) and no evidence of disturbances in consciousness, medical or neurological disease causing cognitive impairment, history of head injury with loss of consciousness, or current psychiatric disorder. They also completed the Center for Epidemiological Studies--Depression scale (Radloff, 1977), for which there were no significant differences among the three age groups. To measure IQ, participants completed the Vocabulary and Matrix Reasoning subtests of the Wechsler Adult Intelligence Scale--3rd Edition (WAIS-III; Wechsler, 1997). Means and SDs in these participant characteristics are shown in Table 1. With the exception of the raw IQ scores, there were no significant differences on any of the measures shown in Table 1.
Table 1.
Subject Characteristics
| Measure | Young College age | 60-74 year olds | 75-90 year olds | |||
|---|---|---|---|---|---|---|
| M | SD | M | SD | M | SD | |
| Mean age | 20.4 | 2.2 | 68.3 | 4.4 | 82.0 | 4.1 |
| Years Education | 12.8 | 1.1 | 15.0 | 2.7 | 14.5 | 2.8 |
| MMSE | 28.7 | 1.4 | 28.3 | 1.5 | 28.0 | 1.1 |
| WAIS-III Vocabulary (scaled) | 12.6 | 2.9 | 12.9 | 3.0 | 13.1 | 2.9 |
| WAIS-III Vocabulary (raw) | 46.3 | 10.1 | 51.2 | 10.7 | 49.3 | 10.9 |
| WAIS-III Matrix Reasoning (scaled) | 12.0 | 2.8 | 12.3 | 3.2 | 12.4 | 3.6 |
| WAIS-III Matrix Reasoning (raw) | 19.3 | 4.0 | 15.0 | 5.8 | 11.8 | 5.3 |
| WAIS-III IQ | 113.0 | 14.6 | 114.7 | 16.2 | 115.6 | 14.5 |
| CES-D | 10.8 | 7.7 | 10.0 | 8.9 | 10.5 | 6.4 |
Note. MMSE = Mini-Mental State Examination; WAIS-III = Wechsler Adult Intelligence Scale-3rd edition; CES-D = Center for Epidemiological Studies-Depression Scale.
It is important to note that even though our 75-90 year old participants matched the younger ones on all the measures just described, it is likely that, relatively speaking, they are higher functioning. This is because they self select into the experiment, which means that they represent only older adults who are healthy and mobile. Because of this self selection, our data may actually underestimate declines in performance with age relative to the population from which our younger participants are drawn.
Stimuli
There were three pools of words: 800 high-frequency words with frequencies from 78 to 10,600 per million (mean=325, SD=645, Kucera & Francis, 1967), 800 low-frequency words with frequencies of 4 and 5 per million (mean = 4.41, SD = 0.19), and 681 very-low-frequency words with frequencies of 1 per million or no occurrence in the Kucera and Francis’ corpus (mean = 0.365; SD = 0.48). All words occurred in the Merriam-Webster Ninth Collegiate Dictionary (1990). The words were screened by three Northwestern undergraduate students and any words that they did not know were eliminated. For all four tasks, stimuli were chosen randomly without replacement from these pools.
Procedure
For all four tasks, stimuli were presented on the screen of a PC. For item recognition and associative recognition, responses were collected on the PC’s keyboard. For cued and free recall, participants’ responses were given verbally with an experimenter recording them.
Item recognition
There were 50 study-test blocks. For each block, the study list consisted of 6 high- and 6 low-frequency words (in random order), each displayed for 1300 ms and followed by a 200 ms blank screen, and then the next word. An additional filler word, a very low frequency word, was placed at the end of the study list as a buffer item. The manipulation of word frequency was included for both this and the associative recognition task in order to provide more conditions and therefore greater constraints on fitting the diffusion model to the data.
The test list immediately followed the study list. The first two test words were fillers, either two new, very low frequency words or one new, very low frequency word and the last, buffer, word of the study list (the first words of a test list are typically slower than the others, so these two test words were eliminated from data analyses). The remaining 24 test words, presented in random order, were the 12 studied words plus 12 new words, 6 high- and 6 low-frequency. Participants were asked to press the “/” key on the keyboard if the test word had been presented in the immediately preceding study list and the “z” key if not. Participants were encouraged to respond as quickly as possible while still maintaining high accuracy. If the RT for a word was greater than 800 ms for college participants or greater than 900 ms for 60-90 year-old participants, a message saying “too slow” was displayed for 300 ms. If the RT was shorter than 280 ms, a message saying “too fast” was displayed for 1500 ms. In all cases, there was a 500 ms blank screen immediately prior to the next test word. Participants were given no feedback on accuracy.
Associative recognition
There were 40 study-test blocks. For each block, the study list consisted of 4 high- and 4 low-frequency word pairs, each presented twice. The pairs were presented in random order except that there was at least one other pair between repetitions of a pair. Each pair was displayed for 1800 ms followed by a blank screen for 200 ms before the next pair was displayed. Two additional pairs of words from the very low frequency pool served as buffer pairs, one placed at the beginning and one placed at the end of the study list.
The test list immediately followed the study list. All of the words in the test pairs had appeared in a study pair. The first test pair was either the first or last buffer pair (intact) or one word from each of the two pairs (rearranged). The remainder of the test list consisted of two intact high- frequency pairs, two intact low-frequency pairs, two rearranged high-frequency pairs, and two rearranged low-frequency pairs, presented in random order. Participants were asked to press the “/ ” key if the two words of a test pair had occurred in the same pair and the “z” key if the words had occurred in different pairs. The words in the test pairs always occupied the same place as in the study list: If a word was the first of a pair in the study list, it was the first of a test pair, whether the pair was intact or rearranged. Participants were given the same instructions as for the item recognition task, to respond as quickly as possible while maintaining high accuracy.
For each test pair, the first word was displayed for 300 ms and then the second word was presented immediately below the first. The first word was displayed first in order to reduce the variability in RTs that could result from reading times that included both words. Both words remained on the screen until a response was made. If a response was slower than 1000 ms for college-age participants or 1100 ms for 60-90 year-old participants, “too slow” was displayed for 300 ms. If the response was faster than 280 ms, “too fast” was displayed for 1500 ms. There was a blank screen of 500 ms immediately before the next test word. No feedback on accuracy was given.
The “too slow” RT feedback was set relatively quickly, at 800-900 ms for the item recognition task and 1000-1100 ms for the associative recognition task, in order to encourage participants to go with their first impression, i.e., the first information that was available to them. For each task, the values are above the median RT. With enough time, participants could engage in recall processes that produced information about, for example, where an item appeared in a study list, what other items were before or after it, and so on. The “too slow” messages in our experiments were intended to discourage such slow deliberative processes.
Cued recall
The number of blocks varied from participant to participant as determined by the time available in a 30-minute session. The mean numbers of blocks were 10.6, 9.8, and 10.1, for the college age, 60-74 year old, and 75-90 year old participants, respectively. 90% of the college age participants completed from 8-12 blocks, 90% of the 60-74 year olds completed 7-12 blocks, and 90% of the 75-90 year olds completed 8-12 blocks.
Each study list was composed of 16 pairs of words, half high-frequency pairs and half low- frequency pairs. The pairs were presented twice, in the same order. At test, the first word of each pair was displayed on the PC screen and participants were asked to respond with the second word. They made their responses verbally, recorded by an experimenter, with the participant deciding when to go on to the next test cue. The test cues were presented in the same order as the study pairs to equate lag effects (though it is difficult to see how randomizing the order would change any of main trends in the results).
Free recall
Participants were tested on between 16 and 26 lists, as determined by the time available in a 30-minute session. The number of lists per participant averaged 23.7, 21.4, and 22.5, for the college age, 60-74 year old, and 75-90 year old participants, respectively. 90% of the college age participants completed 19-26 lists, 90% of the 60-74 year old participants, 15-26 lists, and 90% of the 75-90 year old participants, 14-26 lists.
Each study list consisted of four high- and four low-frequency words presented twice in random order (with the restriction that two other words intervene between the two presentations of a word) plus one very low frequency word presented as the last word in the study list. Each study word was displayed for 1300 followed by a 200 ms clear screen before the next study word. Participants recalled a list verbally with an experimenter recording their responses and with the participant deciding when to go on to the next list.
The study lists were short, only nine words, because we found in piloting the experiment that the oldest participants were near floor, some recalling none of the words. So we opted to provide an easy free recall task in order to keep morale up. With only nine words to study, this task is probably not comparable to the other tasks because recall could come from short-term as well as long-term memory. In the other tasks, there was enough separation between study and test that only long-term memory was being tested. Therefore, although the free recall data can be used in correlational analyses, to see if good performance on free recall is associated with good performance on the other tasks, declines in free recall with age cannot be compared directly to declines in the other tasks.
Empirical Data: Accuracy and RTs as a Function of Age, IQ, and Task
Summary
For accuracy in item recognition, our finding is consistent with previous research (e.g., RTM): there was little decline with age.
For accuracy in associative recognition, our finding is also consistent with previous research (e.g., Naveh-Benjamin, 2000). Accuracy declined considerably with age for all three associative tasks: associative recognition, cued recall, and free recall.
The results for IQ were different for the college-age and 60-74 year old participants than the 75- 90 year old participants. For college age and 60-74 year olds, accuracy on both of the recognition tests increased significantly with IQ. But for the 75-90 year old participants, it did not; performance for most of the 75-90 year olds was close to floor. For all three groups, there were modest increases with IQ for cued and free recall.
For accuracy in associative recognition, the interaction of age and IQ was striking. For the highest IQ participants, the drop in performance with age was precipitous-- from about 75% correct to about 65% to close to 50% (floor), for college age, 60-74 year old, and 75-90 year old participants, respectively. For the lowest IQ participants, performance was near floor for all three age groups.
RTs increased with age for the two recognition tasks. RTs decreased as IQ increased for the recognition tasks except for the college-age participants (cf., Ratcliff et al., 2010).
In the next sections, we provide details and ANOVA’s for these results. Then we use the diffusion model to explain the data in terms of components of processing that underlie performance, and then examine individual differences.
Accuracy, Median RTs, and Age for Item and Associative Recognition
For college-age participants, for both item recognition and associative recognition, responses below 300 ms and above 1500 ms were excluded. This was 0.8% of the data for item recognition and 1.8% for associative recognition. For 60-90 year olds, responses for both tasks were excluded if they were below 300 ms or above 3500 ms. For the 60-74 year olds, this was 0.3% of the data for both tasks. For the 75-90 year olds, 0.5% of the data were excluded for item recognition and 0.6% of the data for associative recognition. For both tasks, if there was a “too slow” message, the data were included in analyses unless they fell outside of the cutoff values just listed.
The left panel of Figure 1 shows accuracy and median RTs for “old” and “new” responses as a function of age for high- and low-frequency and old and new words. The right panel shows accuracy and median RTs for “intact” and “rearranged” responses as a function of age for pairs made up of two high-frequency words or two low-frequency words.
Figure 1.
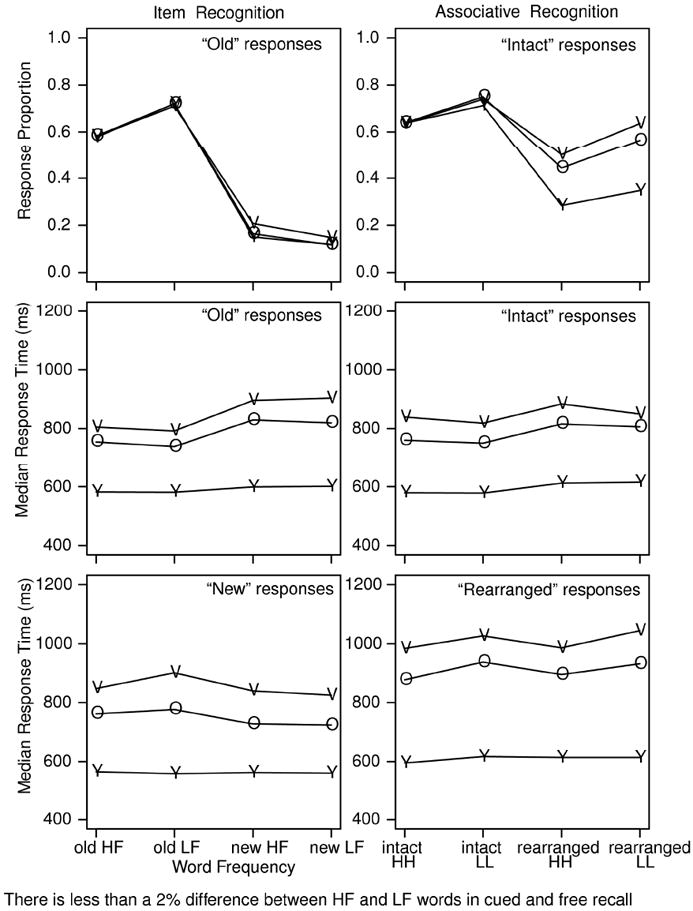
Accuracy and median RTs for “old” and “new” responses for item recognition and “intact” and “rearranged” responses for associative recognition. Note that RTs are not much longer for associative recognition than item recognition because the first word of a test pair in associative recognition was presented for 250 ms prior to the second word and RT was measured from presentation of the second word. Y refers to college-age participants, O refers to 60-74 year old participants, and V refers to 75-90 year old participants. H refers to high frequency words and L refers to low frequency words.
Comparing associative to item recognition, accuracy decreased with age for associative recognition but not for item recognition (F(2,125)=24.7 and F(2,125)=1.1, respectively). RTs increased with age for both tasks (F(2,125)=49.8 and F(2,125)=48.0, respectively). In the next paragraphs, we give further details. While these details heavily constrain the diffusion model in fitting the data, they are not central to the general conclusions about aging and individual differences that we wish to draw.
For item recognition, for all three groups of participants, there was a mirror effect in accuracy with hit rates for low-frequency words higher than for high-frequency words and false alarm rates lower for low-frequency words than for high-frequency words. The d’ values for college age, 60-74 year olds, and 75-90 year olds for high-frequency words for item recognition were 1.23, 1.19, and 1.03, respectively. For low-frequency words, the d’s were 1.77, 1.77, and 1.60, respectively. For comparison, the same d’s for associative recognition were 0.96, 0.51,and 0.29 for low-frequency pairs and 0.93, 0.50, and 0.35 for high-frequency pairs for the three age groups, respectively. Thus, for item recognition, we see a mirror effect (Figure 1) with d’ for low-frequency words higher than for high-frequency words, but there was no effect of word frequency on associative recognition.
The RT difference between high- and low-frequency words changed relatively little with age, probably because of speed stress in the instructions and because of the RT feedback. For the two older age groups, errors were slower than correct responses (“old” responses to not-studied items were slower than “new” responses to not-studied items, and “new” responses to studied items were slower than “old” responses to studied items). The college-age participants showed little difference for these comparisons.
For associative recognition, the decrease in accuracy with age was the result of a decrease in accuracy for rearranged, not intact, test pairs (cf, Chalfonte & Johnson, 1996; Light, Patterson, Chung, & Healy, 2004; Mitchell et al., 2000). There was an overall bias such that “intact” responses were more likely for low- than high-frequency pairs, both for correct responses and errors.
“Rearranged” responses slowed more with age than “intact” responses. For intact pairs, RTs for correct responses were shorter than for error responses, but for rearranged pairs, the opposite was true. This reflects a general bias such that “intact” responses were faster than “rearranged” responses.
Accuracy, Median RTs, and IQ for Item and Associative Recognition
Figure 2 plots accuracy and median RTs for correct responses as a function of IQ and age, averaged over high- and low-frequency words, old/new items for item recognition, and intact/ rearranged pairs for associative recognition. The numbers of participants in the low IQ groups were 15, 15, and 14 for college age, 60-74 year olds, and 75-90 year olds, 15, 15, and 15 for the middle IQ groups, and 16, 15, and 14 for the high IQ groups, for the three age groups respectively.
Figure 2.
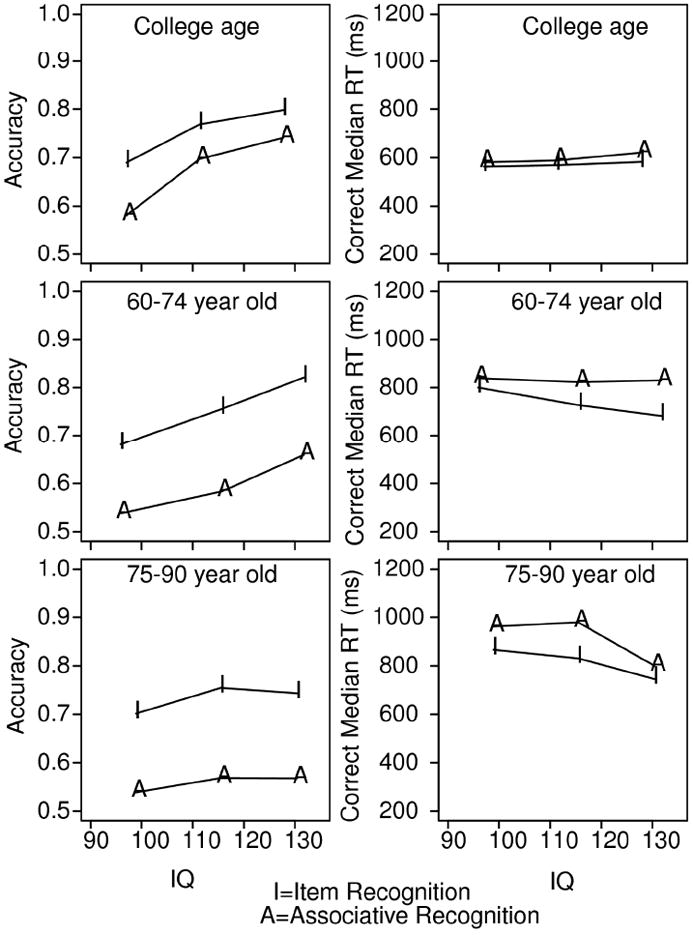
Accuracy and median correct RTs averaged over word frequency and response type for item (I) and associative recognition (A) as a function of IQ. Y refers to college-age participants, O refers to 60-74 year old participants, and V refers to 75-90 year old participants.
For item recognition, accuracy was above chance for the lowest IQ participants for all three age groups. The increase in accuracy with IQ was significant, F(2,125)=18.8. The decrease in RTs with IQ was also significant, F(2,125)=3.2, although this effect occurred only for the 60-74 year old and 75-90 year old groups.
For associative recognition, the interaction between age and IQ is one of the central findings of this experiment. Accuracy was near chance for the lowest IQ participants for all three age groups. For the college-age and 60-74 year old participants, accuracy increased as IQ increased, F(2,125)=21.1. This was not true for the 75-90 year old participants, whose performance was close to chance for all levels of IQ; the interaction between age and IQ was significant (F(4,125)=3.38, p<.05). Median RTs, on the other hand, varied little with IQ (F(2,125)=0.8).
Accuracy, Age, and IQ for Cued and Free Recall
Accuracy for high- and low-frequency words for the two recall tasks averaged over levels of IQ is plotted in the top panel of Figure 3. Accuracy decreased with age (F(2,125)=26.8 and F(2,125)=16.3, for cued and free recall, respectively), more for cued than free recall, probably due to the short lists for recall, only nine words, compared to the 16 pairs of words for cued recall. For neither task were there significant effects of word frequency. Significant effects of word frequency on recall performance are often found in the literature, but non-significant effects are sometimes obtained when high- and low-frequency words are mixed within a list (e.g., Gillund & Shiffrin, 1984), as they were in this experiment.
Figure 3.
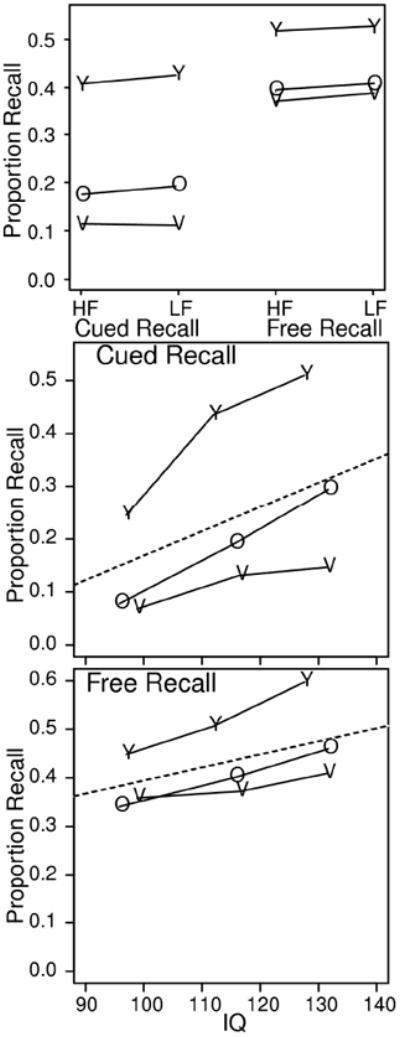
Top panel: Accuracy in cued and free recall as a function of word frequency and age. HF refers to high frequency words and LF refers to low frequency words. For cued recall, both words are HF or LF in the study pair. Bottom two panels: overall accuracy as a function of IQ for the three participant groups. Y refers to college-age participants, O refers to 60-74 year old participants, and V refers to 75-90 year old participants.
Accuracy increased with IQ for both cued and free recall for all three participant groups, F(2,125)=66.9 and F(2,125)=27.6 for cued and free recall, respectively. Accuracy as a function of IQ is plotted in the bottom two panels of Figure 3. In cued recall, for the 75-90 year old participants, the advantage of higher IQ was less than for the 60-74 year olds and college-age participants (with an interaction, F(4,125)=3.6). But for free recall, the effect was not significant (F(4,125)=2.0, p>.05). For cued recall, just as with associative recognition, accuracy for the higher IQ participants dropped considerably from college age to 75-90 year olds, from about 50% accuracy for the college-age participants to a little less than 15% for the 75-90 year olds.
One possible reason the effects were smaller for free recall than cued recall is that in free recall, some items might have been retrieved from short-term memory. To test this hypothesis, we examined the data with the first two items that were recalled eliminated from the analyses. If short- term memory was a factor, then with those items eliminated, the change in accuracy should be larger as a function of age and IQ. However, with the first two recalled items excluded, the size and pattern of the results did not change (and the interaction was still not significant). This suggests that short-term memory was the not a major factor responsible for the smaller decline in performance for free recall relative to cued recall.
Diffusion Model Analyses
The diffusion model was fit to the data for each task for each participant by minimizing a chi-square value with a general SIMPLEX minimization routine (Nelder & Mead, 1965). The values of all the parameters, including the variability parameters, are estimated simultaneously, fitting the model to all the data from all the conditions of an experiment. The minimization routine adjusts the parameters of the model until it finds the parameter estimates that give the minimum chi-square value (see Ratcliff & Tuerlinckx, 2002, for a full description of the method). The data entered into the minimization routine for each experimental condition are the .1, .3, .5, .7, .9 quantile RTs for correct responses and error responses and the corresponding accuracy values. The diffusion model is used to generate the predicted cumulative probability of a response by each quantile RT. Subtracting the cumulative probabilities for each successive quantile from the next higher quantile gives the proportion of responses between adjacent quantiles. For the chi-square computation, these are the expected values, to be compared to the observed proportions of responses between the quantiles (i.e., the proportions between 0, .1, .3, .5, .7, .9, and 1.0, which are .1, .2, .2, .2, .2, and .1) multiplied by the number of observations. Summing over (Observed- Expected)2/Expected for all conditions gives a single chi-square value to be minimized.
The model can successfully fit data from single participants if there are around 300-1000 total observations per participant, which can be collected in 45 minutes or less for tasks like those considered in this article. Although such numbers of observations lead to variability in parameter estimates from their true values, the variability is much less than the differences among individual participants. In consequence, correlations of parameter values can be meaningfully used to examine individual differences.
In the analyses that follow, we use the model’s parameters in two ways. One is to examine correlations among model parameters across participants in order to examine individual differences on the four tasks. The other is to average over participants to examine the overall effects of age and IQ on the components of processing measured by the model parameters.
Goodness of fit
Before moving to the explanations of the item and associative recognition data offered by the model, and comparisons with the cued recall and free recall data, it is important to demonstrate that the model’s predictions match the data. In other words, when the best-fitting parameter values are determined (by the fitting method described above), the predictions from the model using those parameter values should closely match the data. As we detail in the next paragraphs, the match between predictions and data was good.
The first result to note is that the model fit the associative recognition data well. This is the first time the model has been applied to associative recognition and so this extends the domain of application of the diffusion model.
Goodness of fit is illustrated in Figure 4 with one condition for the item recognition task (studied, high-frequency words) and one for the associative recognition task (intact, high- frequency pairs). These conditions had a relatively broad range of accuracy values across participants and showed the largest individual differences. (The total number of figures would be too large to show all conditions). The figure plots predictions from the model against the data for each participant. The accuracy values show deviations between predictions and data of no more than about 8%. For the RT quantiles for correct responses, there are only a few misses of more than 100 ms, except for the .7 and .9 quantiles, for which variability was larger (see Ratcliff & Tuerlinckx, 2002). For error responses, there are more misses because there were fewer numbers of observations and variability was large.
Figure 4.
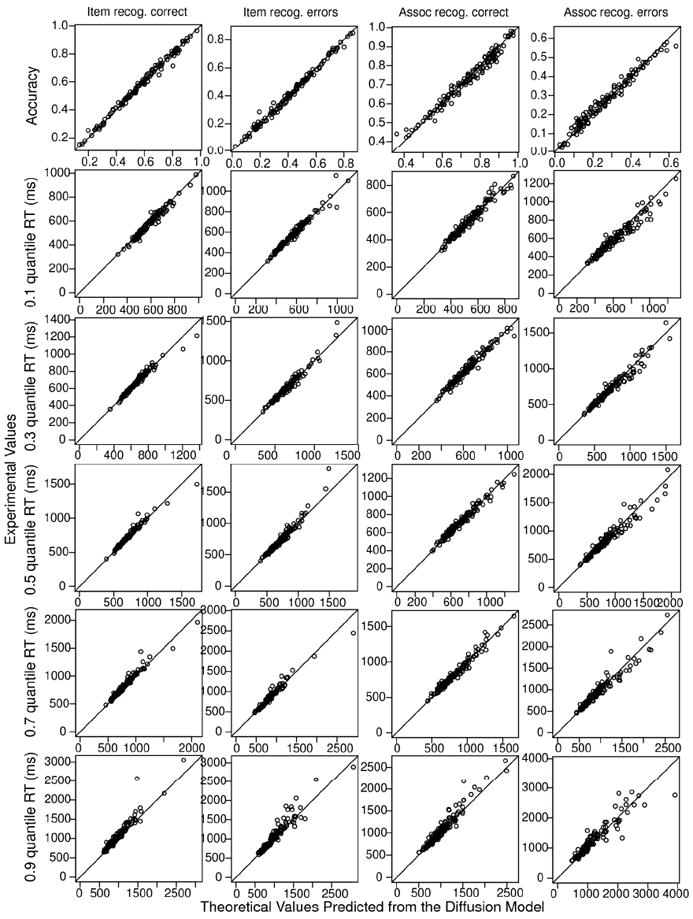
Plots of accuracy and the .1, .3, .5 (median), .7, and .9 RT quantiles for data (y- axis) and predicted values from fits of the diffusion model (x-axis) for correct and error responses for a single condition for item recognition and a single condition for associative recognition for all participants in the three age groups. For item recognition, the data are for high frequency words presented twice, and for associative recognition, the data are for high frequency, intact pairs.
For each of the model’s parameters, Table 2 shows the mean (the average over participants) of the best-fitting value and its standard deviation. Table 2 also shows chi-square goodness of fit values averaged over participants. The critical value for 33 degrees of freedom is 50.7. The mean values are only a little higher than this, showing, along with the predictions in Figure 4, that the model fits the data well (see Ratcliff, Thapar, Gomez & McKoon, 2004, for discussion of the quality of fits of the diffusion model to data).
Table 2.
Means in Parameter Values for Subject Groups and Item and Associative Recognition
| Task and parameter | Participants | a | z | Ter | η | sz | po | st | v1 | v2 | v3 | v4 | χ2 |
|---|---|---|---|---|---|---|---|---|---|---|---|---|---|
| college | 0.083 | 0.047 | 0.476 | 0.136 | 0.039 | 0.004 | 0.176 | 0.119 | 0.249 | -0.262 | -0.314 | 78.3 | |
| item | 60-74 | 0.116 | 0.061 | 0.575 | 0.180 | 0.041 | 0.001 | 0.187 | 0.108 | 0.217 | -0.264 | -0.325 | 65.9 |
| mean | 75-90 | 0.130 | 0.058 | 0.623 | 0.202 | 0.044 | 0.001 | 0.222 | 0.052 | 0.164 | -0.242 | -0.292 | 71.5 |
|
| |||||||||||||
| college | 0.093 | 0.043 | 0.461 | 0.150 | 0.029 | 0.000 | 0.231 | 0.087 | 0.156 | -0.161 | -0.124 | 45.5 | |
| assoc | 60-74 | 0.130 | 0.049 | 0.569 | 0.134 | 0.019 | 0.000 | 0.292 | 0.035 | 0.107 | -0.075 | 0.005 | 53.4 |
| mean | 75-90 | 0.138 | 0.051 | 0.600 | 0.116 | 0.023 | 0.000 | 0.310 | 0.014 | 0.080 | -0.050 | 0.022 | 53.5 |
|
| |||||||||||||
| college | 0.014 | 0.011 | 0.048 | 0.092 | 0.023 | 0.009 | 0.062 | 0.093 | 0.117 | 0.132 | 0.163 | 25.8 | |
| item | 60-74 | 0.028 | 0.019 | 0.067 | 0.101 | 0.032 | 0.005 | 0.065 | 0.137 | 0.142 | 0.155 | 0.179 | 19.9 |
| SD | 75-90 | 0.037 | 0.020 | 0.062 | 0.100 | 0.042 | 0.003 | 0.075 | 0.141 | 0.133 | 0.132 | 0.142 | 29.0 |
|
| |||||||||||||
| college | 0.017 | 0.010 | 0.069 | 0.141 | 0.029 | 0.001 | 0.069 | 0.125 | 0.133 | 0.137 | 0.153 | 12.7 | |
| assoc | 60-74 | 0.036 | 0.013 | 0.089 | 0.108 | 0.023 | 0.001 | 0.066 | 0.097 | 0.108 | 0.093 | 0.098 | 20.7 |
| SC | 75-90 | 0.044 | 0.019 | 0.087 | 0.083 | 0.028 | 0.000 | 0.061 | 0.068 | 0.071 | 0.071 | 0.059 | 16.5 |
Note: a=boundary separation, z=starting point, Ter=nondecision component of response time, η =standard deviation in drift across trials, sz=range of the distribution of starting point (z), po = proportion of contaminants, st = range of the distribution of nondecision times, and χ2 is the chi-square goodness of fit measure (with 33 degrees of freedom, the critical value is 50.7). For item recognition, v1 is for old high frequency words, v2 is for old low frequency words, v3 is for new high frequency words, and v4 is for new low frequency words. For associative recognition, v1 is for intact high frequency pairs, v2 is for intact low frequency pairs, v3 is for rearranged high frequency pairs, and v4 is for rearranged low frequency pairs.
Diffusion Model Parameters, Age, and IQ
As we pointed out above, comparisons of performance for younger and older adults have frequently rested on accuracy data alone, setting aside RT data. Interpretations of age and IQ effects from accuracy alone (or from RTs alone) might be appropriate if RTs and accuracy were highly correlated across individuals. Young participants would be both faster and more accurate than older participants. High IQ participants would be both faster and more accurate than lower IQ participants. But the effects of age and IQ on RTs and accuracy are not always the same. In the data described above for item recognition, the older participants differed from the younger participants in RTs but not accuracy. The differences in performance for lower compared to higher IQ participants were larger in accuracy than in RTs. For associative recognition, the older participants differed from the younger participants in both RTs and accuracy.
To preview the aging results, drift rates decreased with age by only a small amount for item recognition but by a much larger amount for associative recognition. Boundary separation and the duration of the nondecision component both increased with age, for both item and associative recognition.
To preview the IQ results, drift rates increased with IQ except for associative information for the 75-90 year old participants. Boundary separation and the duration of the nondecision component were not significantly affected by IQ.
Drift rates
The top panels of Figure 5 show drift rates for item and associative recognition as a function of age and IQ and, for comparison, Figure 3 shows accuracy for cued and free recall. The drift rates shown in this and subsequent figures are the averages over experimental conditions. For item recognition and associative recognition, drift rates for “new” or “rearranged” conditions were negative. These were changed to positive values and averaged with the “old” or “intact” drift rates.
Figure 5.
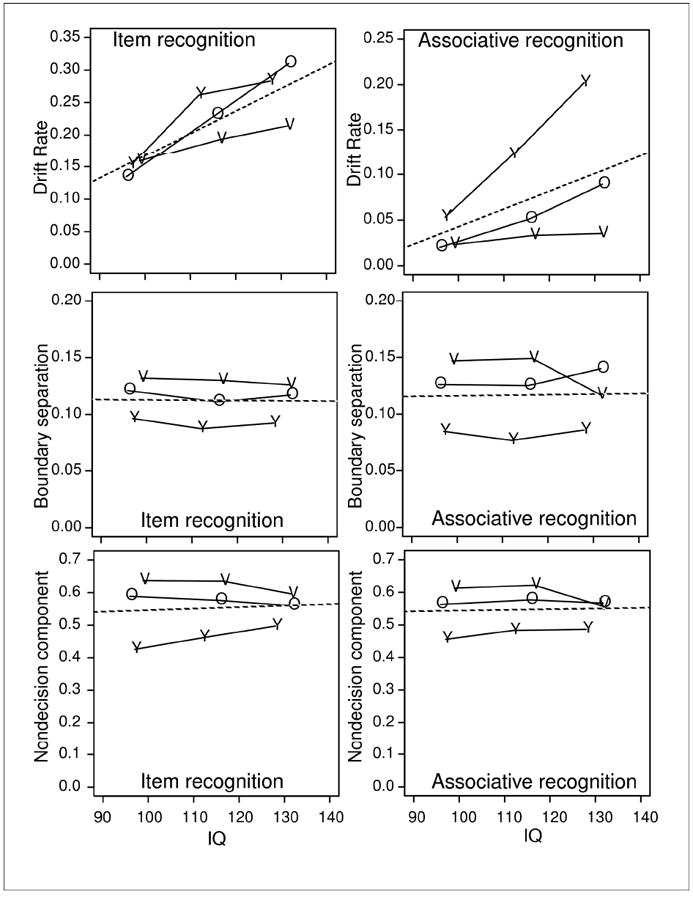
Values of drift rate, boundary separation, and the nondecision component as a function of IQ and age. Y refers to college-age participants, O refers to 60-74 year old participants, and V refers to 75-90 year old participants. The dotted lines are the averages over the three groups of participants.
Drift rates for item recognition decreased only minimally with age (although the effect was significant, F(2,125)=3.2, p<.05). For associative recognition, the decrease in drift rates with age was much larger (F(2,125)=29.1, p<.05).
Drift rates increased significantly as IQ increased (F(2,125)=19.0 and F(2,125)=17.9, for the item and associative recognition tasks, respectively). These effects were qualified by interactions: For associative recognition, the increase in drift rate with IQ was significantly smaller for the 60-74 year olds than the college-age participants (F(4,125)=5.1), and the 75-90 year old participants were near floor for all levels of IQ. For item recognition, the increase in drift rate with IQ was larger for the college-age participants and the 60-74 year olds than the 75-90 year olds (a marginally significant interaction, F(4,125=2.3, p=.06).
It should be emphasized how bad performance was for the 75-90 year old participants, worse than might be expected. Their drift rates for associative recognition and their accuracy in cued recall were substantially lower than for the 60-74 year old participants, and their drift rates for item recognition were also somewhat lower, suggesting an overall memory deficit.
Moreover, their drift rates and cued recall accuracy increased only minimally with IQ. For associative recognition, there was no significant increase at all with IQ (near-zero drift rates for all levels of IQ). The only instance for which 75-90 year olds’ performance was not significantly worse than the 60-74 year olds’ was free recall, but that is likely a function of the way the free recall task was structured (with only nine items, see discussion above).
Criteria settings and the nondecision component
Figure 5 shows the effects of age and IQ on boundary separation and the nondecision component. As a function of age, the results replicate those of earlier studies (RTM). Older participants were slower than younger participants because they set wider criteria and their nondecision component was longer. In associative recognition, for the older participant groups, “intact” responses were faster than “rearranged” responses, and in the diffusion model fits, this was explained by a bias in the starting point z toward the “intact” decision boundary.
The effects of age on boundary separation and the nondecision component were significant; for associative and item recognition respectively, for boundary separation, F(2,125)=22.7 and F(2,125)=32.4, and for the non-decision component, F(2,125)=37.1 and F(2,125)=72.4.
In contrast, the effect of IQ was not significant for either parameter (F’s < 1.3). The lack of effect on boundary separation suggests that the speed/accuracy tradeoff settings individuals adopt are independent of IQ.
Diffusion model variability parameters
In this and other research on aging using diffusion model analyses, the parameters representing variability are usually not significantly different across conditions. This is partly because the differences are small, but also because they have larger variability than the other parameters (Ratcliff & Tuerlinckx, 2002). However, in order to explain the relative speeds of correct and error responses, the variability parameters are required (Ratcliff & McKoon, 2008).
In terms of statistical tests, variability in the nondecision component (its range, st) increased as a function of age for item recognition and associative recognition (F(2,125)=17.6 and F(2,125)=5.9) and it increased as function of IQ for item recognition (F(2,125)=4.5). The SD in drift across trials (normally distributed with SD η) increased with both age and IQ for item recognition (F(2,125)=5.7 and F(2,125)=6.0, respectively) but not associative recognition. The only other significant effect was a decrease in the range of the starting point (sz) for associative recognition as a function of IQ (F(2,125)=3.9). None of these effects are particularly large, so we did not attempt to interpret them further.
Individual Differences
As discussed above, the values of the diffusion model parameters were averaged across participants, and the means and SD’s in the means are shown in Table 2. To calculate the standard deviation in a parameter value for a single participant, we relied on the Monte Carlo simulations done by Ratcliff and Tuerlinckx (2002). They generated sets of simulated data from the diffusion model for several conditions of an experiment, where the conditions differed in drift rate. For each set, they fit the model back to the simulated data. Because of variability in the simulated data from one set to another, the parameter estimates obtained from fitting the model vary across the data sets. This variability (SD) represents the variability in parameter estimates for a single participant. The SD values for each parameter of the model are shown in Table 4 in Ratcliff and Tuerlinckx’ article for 250 observations per condition. For example, in row E, when the true value of a was 0.16, Ratcliff and Tuerlinckx found a SD of 0.012 across repeatedly fitting different simulated random samples of data generated with the same parameter values.
Table 4.
Correlations Between Raw IQ Matrix Reasoning and Vocabulary Scores and Drift Rates for Item and Associative Recognition and Cued and Free Recall
| Participants | Measure | IQ vocab | Item drift | Assoc. drift | Cued recall | Free recall |
|---|---|---|---|---|---|---|
| College age | IQ matrix | 0.602 | 0.362 | 0.524 | 0.420 | 0.459 |
| IQ vocab | 0.604 | 0.675 | 0.683 | 0.648 | ||
| Item drift | 0.628 | 0.595 | 0.405 | |||
| Assoc. drift | 0.724 | 0.574 | ||||
| Cued recall | 0.614 | |||||
|
| ||||||
| 60-74 year olds | IQ matrix | 0.690 | 0.666 | 0.497 | 0.572 | 0.613 |
| IQ vocab | 0.581 | 0.473 | 0.678 | 0.488 | ||
| Item drift | 0.718 | 0.745 | 0.719 | |||
| Assoc. drift | 0.729 | 0.519 | ||||
| Cued recall | 0.652 | |||||
|
| ||||||
| 75-90 year olds | IQ matrix | 0.200 | 0.267 | 0.176 | 0.225 | 0.247 |
| IQ vocab | 0.343 | 0.282 | 0.390 | 0.308 | ||
| Item drift | 0.483 | 0.208 | 0.580 | |||
| Assoc. drift | 0.279 | 0.376 | ||||
| Cued recall | 0.450 | |||||
As the number of data points per condition increases (or decreases), the SD of single participants’ parameter values decreases (or increases) as a function of the square root of the number of data points. Ratcliff and Tuerlinckx used 250 observations per condition. So to translate their estimates to our experiment, we multiplied their SD estimates by √(250/N), where N was the number of observations in the conditions of our experiment. In other words, we scaled Ratcliff and Tuerlinckx’ estimates of the SD’s in parameter values against the numbers of observations per condition in our experiment.
In the associative recognition experiment, there were about 80 observations per condition and in the item recognition experiment, there were about 190 observations per condition. Thus, using Ratcliff and Tuerlinckx’s Table 4, we found SD’s in individuals’ parameter values, with the following results: the SD in a (for a single participant) was roughly 2.5-4 times smaller than the SD across participants (the SD’s that are shown in Table 2); the SD in Ter was roughly 3-5 times smaller than the SD across individuals, and the SD in v was roughly 3 times smaller than the SD across individuals (except for the older participants in associative recognition, for whom drift rates approached a floor of zero).
These results mean that we can examine individual differences. For each parameter of the model, the SD in its value for a single participant is much smaller than the SD in the parameter’s value when that value is obtained by averaging over the means of all the participants in an experiment.
The relatively small SD’s for individual participants are especially noteworthy because there was only a single, 45-min. session of data collection. The data from a single session produced parameter estimates that have small enough variability relative to differences among individuals (i.e., enough power) to allow meaningful individual difference analyses to be carried out on the main components of the model: boundary separation, nondecision time, and drift rates.
Correlations Among Model Parameters and Data
We conducted correlational analyses among accuracy, RTs, IQ, and the main parameters of the diffusion model-- drift rate, criterion setting, and the nondecision component. To obtain accuracy and median RT values for item and associative recognition, the accuracy values and median RTs for correct responses were averaged over conditions to give a single value of accuracy and a single value of median RT for each participant. The correlations are shown in Tables 3 through 6. A correlation above 0.29 is significant at the .05 level for a group of 45 participants (the numbers of participants in the three groups were 46, 45, and 43, for college age, 60-75 year old, and 75-90 year old, respectively). Generally, correlations for the 75-90 year old group were lower than for the other groups.
Table 3.
Correlations Between Cued and Free Recall, IQ, and Accuracy and Median RT for Item and Associative Recognition
| Group | Measure | accuracy item Rn. | accuracy assoc. Rn. | median RT item Rn. | median RT assoc. Rn. |
|---|---|---|---|---|---|
| College age | IQ | 0.656 | 0.533 | 0.245 | 0.313 |
| cued recall | 0.775 | 0.616 | 0.080 | 0.129 | |
| free recall | 0.592 | 0.454 | 0.290 | 0.185 | |
| accuracy item Rn | 0.687 | 0.340 | 0.293 | ||
| accuracy assoc. Rn | 0.300 | 0.430 | |||
| median RT item Rn | 0.596 | ||||
|
| |||||
| 60-74 year olds | IQ | 0.540 | 0.657 | -0.092 | -0.471 |
| cued recall | 0.767 | 0.747 | -0.003 | -0.413 | |
| free recall | 0.620 | 0.721 | -0.073 | -0.532 | |
| accuracy item Rn | 0.745 | 0.023 | -0.442 | ||
| accuracy assoc. Rn | 0.136 | -0.379 | |||
| median RT item Rn | 0.718 | ||||
|
| |||||
| 75-90 year olds | IQ | 0.333 | 0.331 | -0.281 | -0.387 |
| cued recall | 0.388 | 0.325 | -0.152 | -0.074 | |
| free recall | 0.400 | 0.575 | -0.180 | -0.275 | |
| accuracy item Rn | 0.597 | 0.231 | -0.210 | ||
| accuracy assoc. Rn | 0.038 | -0.307 | |||
| median RT item Rn | 0.639 | ||||
Table 6.
Correlations of a, Ter, Cued and Free Recall
| Participants | Ter item | a assoc | Ter assoc | cued recall | free recall | |
|---|---|---|---|---|---|---|
| College age | a item | -0.028 | 0.541 | 0.088 | 0.101 | 0.292 |
| Ter item | 0.182 | 0.554 | 0.238 | 0.186 | ||
| a assoc | 0.160 | 0.168 | 0.408 | |||
| Ter assoc | 0.202 | 0.306 | ||||
|
| ||||||
| 60-74 year olds | a item | 0.407 | 0.789 | 0.008 | -0.117 | -0.178 |
| Ter item | 0.381 | 0.539 | -0.240 | -0.294 | ||
| a assoc | -0.015 | 0.137 | -0.040 | |||
| Ter assoc | 0.048 | 0.128 | ||||
|
| ||||||
| 75-90 year olds | a item | 0.332 | 0.590 | 0.176 | -0.142 | -0.162 |
| Ter item | 0.441 | 0.456 | -0.062 | -0.260 | ||
| a assoc | 0.291 | -0.213 | -0.265 | |||
| Ter assoc | -0.032 | -0.025 | ||||
Note: a=boundary separation, Ter=nondecision component of RT
The results are easy to summarize. They fell into two sets of intercorrelations, with few exceptions. First, accuracy values for the four tasks, drift rates for the item and associative recognition tasks, and IQ were all significantly correlated with each other. Second, for the item and associative recognition tasks, RTs, criteria settings, and the non-decision component were all significantly correlated between the two tasks. And third, there were no significant correlations between the measures of these two groups. In the next paragraphs, we discuss these results in more detail.
Table 3 shows correlations between IQ, accuracy of cued recall, and accuracy of free recall, on the one hand, and accuracy and median RT in item and associative recognition, on the other hand. For the college age and 60-74 year old groups, the mean correlations between IQ and accuracy values for the four tasks were all positive and high. The correlations between the median RTs for the two recognition tasks were greater than .59. The correlations between median RTs and IQ and median RTs and accuracy were different for the different participant groups. There were positive correlations between the accuracy measures and the RT measures for the college-age participants. But this flipped to largely negative values for the older groups. This suggests that the better performing and higher-ability young participants took longer to make decisions (adopting more conservative decision criteria). But for the older participants, who adopted more conservative decision criteria (Starns & Ratcliff, 2010), better accuracy and ability produced shorter RTs.
Table 4 shows correlations of IQ, drift rates for item and associative recognition, and accuracy values for cued and free recall for the three participant groups. Scatter plots, histograms of the values, and the correlations are also shown in Figure 6 for the 60-75 year-old participant group. The plots are presented to illustrate the correlations. The main result is that for the college age and the 60-74 year olds, all these measures correlated significantly with each other, with correlations greater than .36.
Figure 6.
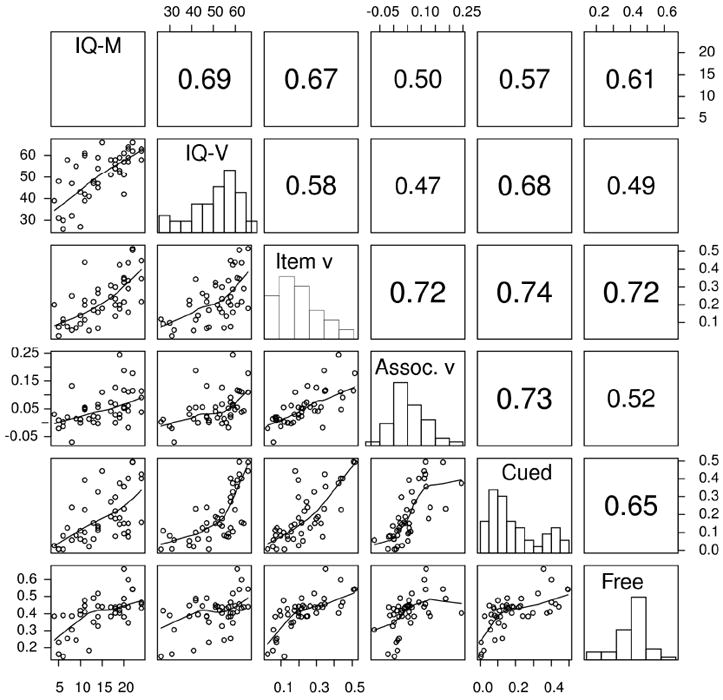
Scatter plots, histograms, and correlations for WAIS matrix reasoning (IQ-M), WAIS vocabulary (IQ-V), item and associative recognition drift rates (Item v and Assoc. v respectively) and cued and free recall accuracy (Cued and Free respectively).
For the 75-90 year-old participants, the correlations were lower, but this was because of floor effects in associative recognition and cued recall. The correlations between the two IQ measures for the 75-90 year olds were also lower, partly because the range of the Matrix Reasoning scores was much smaller than for the other two groups (see Table 1) and so the range was compressed relative to the SD.
We might not have expected to see declines in the correlations for the 75-90 year olds relative to the other groups between item recognition drift rate, IQ vocabulary score, and free recall because these quantities did not decline with age. The correlations between the IQ vocabulary score, and both the item recognition drift rate and free recall are smaller than for the younger groups. But the correlation between item recognition drift rate and free recall is high. This suggests that the reduction in the size of the correlations in Table 4 for the 75-90 year old group relative to the other groups is due to two things: floor effects in both associative recognition and cued recall and a reduction in the reliability of the IQ vocabulary score. The correlation between item recognition drift rate and free recall is higher than that for college-age participants which means that there is no general decline in the correlations across every pair of tasks.
For item recognition (Table 5), there were significant correlations between accuracy and drift rate, and between median RT and both boundary separation and the duration of the nondecision component. The correlations between IQ and boundary separation and between IQ and the nondecision component were not consistent across participant groups (though some were just significant). For associative recognition, the same pattern was obtained, but the correlations were usually smaller.
Table 5.
Correlations within Tasks
| Task and group | Measure | a | Ter | v | accuracy | median RT |
|---|---|---|---|---|---|---|
| IQ | 0.135 | 0.370 | 0.522 | 0.656 | 0.245 | |
| Item | a | -0.028 | 0.277 | 0.215 | 0.348 | |
| Recognition | Ter | 0.543 | 0.404 | 0.498 | ||
| College age | v | 0.696 | 0.255 | |||
| accuracy | 0.340 | |||||
|
| ||||||
| IQ | -0.167 | -0.288 | 0.638 | 0.540 | -0.092 | |
| Item | a | 0.407 | 0.058 | -0.215 | 0.640 | |
| Recognition | Ter | -0.180 | -0.197 | 0.745 | ||
| 60-74 year olds | v | 0.738 | 0.059 | |||
| accuracy | 0.023 | |||||
|
| ||||||
| IQ | -0.135 | -0.291 | 0.352 | 0.333 | -0.281 | |
| Item | a | 0.332 | -0.075 | -0.034 | 0.580 | |
| Recognition | Ter | -0.138 | -0.110 | 0.547 | ||
| 75-90 year olds | v | 0.458 | -0.080 | |||
| accuracy | 0.313 | |||||
|
| ||||||
| IQ | -0.007 | -0.209 | 0.169 | 0.533 | 0.256 | |
| Associative | a | 0.332 | -0.075 | -0.075 | -0.256 | |
| Recognition | Ter | -0.138 | -0.013 | -0.124 | ||
| College age | v | -0.285 | 0.143 | |||
| accuracy | 0.399 | |||||
|
| ||||||
| IQ | 0.131 | -0.079 | 0.517 | 0.657 | -0.471 | |
| Associative | a | -0.015 | -0.105 | 0.173 | 0.470 | |
| Recognition | Ter | 0.168 | 0.231 | 0.303 | ||
| 60-74 year olds | v | 0.707 | -0.490 | |||
| accuracy | -0.345 | |||||
|
| ||||||
| IQ | -0.320 | -0.171 | 0.240 | 0.331 | -0.387 | |
| Associative | a | 0.291 | 0.143 | 0.102 | 0.579 | |
| Recognition | Ter | 0.275 | -0.051 | 0.446 | ||
| 75-90 year olds | v | 0.543 | -0.244 | |||
| accuracy | -0.305 | |||||
Note: a=boundary separation, Ter=nondecision component of RT, and v=drift rate
Table 6 shows correlations of boundary separation and the nondecision component of processing between item and associative recognition and with cued and free recall accuracy. Boundary separation and the nondecision component correlated between item and associative recognition. There were weaker correlations between boundary separation in one recognition task and the nondecision component in the other task. Few of the other correlations were significant.
Overall, the pattern of correlations suggests first, that IQ, accuracy in the two recall tasks, and drift rates in the two recognition memory tasks may all represent a common memory ability that drives individual differences. Second, the finding that nondecision duration and boundary separation are not strongly related to the memory measures or to IQ (Table 5) suggests that they are governed by different factors from the memory measures. Third, the high correlations between the two recognition tasks for boundary separation and the nondecision component suggest that these reflect some common decision mechanism, a mechanism separate from the drift rates that drive the decision process.
Discussion
Overall, our goal was to examine item recognition and associative recognition, and to constrain explanations of performance on these two tasks by jointly varying age and IQ. At the same time, we wanted to better understand the interactions of age and IQ.
First, before addressing these issues, we needed to show that the diffusion model explained the data well for the two recognition tasks-- which it did for both item and associative recognition. The quality of the fit of the model to the data is shown by chi-square tests and by data like those in Figure 4, where predicted and experimental values of accuracy and quantile RTs are plotted against each other.
Associative recognition provided an important test of the diffusion model in that the model had not previously been applied to associative recognition tasks. The fact that the model was successful expands greatly the theoretical and empirical tasks and issues that the model can address.
It is important that the model successfully predicts both accuracy and RT data. In many previous studies, item recognition has been compared to associative recognition only in terms of accuracy, ignoring RTs. However, understanding the data from the experiment presented here, and likely most other experiments, would not be possible without taking both measures into account. In the experiment presented here, we found that accuracy and RTs did not correlate significantly.
If one were to consider accuracy measures alone, then the conclusions would be: no deficit in item recognition with age, a deficit in associative recognition with age for higher IQ participants, and a general deficit for lower IQ participants. In contrast, if one were to consider RT measures alone, then the conclusion would be a general speed-of-processing deficit for both item and associative recognition. The diffusion model allows these two patterns to be reconciled and explained within a single framework.
For the discussion in the next few paragraphs, we describe the data in terms of the components of processing the model abstracts from accuracy and RT data: the quality of the evidence on which a decision is based (drift rate), the amount of evidence that is required before a decision is made (boundary settings), and the nondecision component (which includes such processes as encoding the stimulus and response execution).
One striking result concerns the behavior of drift rates as a function of age and IQ. Drift rates for associative recognition for high IQ participants decreased dramatically with age-- to the point that their drift rates were nearly equivalent to those of low IQ participants, for whom drift rates were only a little above zero at all age levels. This result is even more striking because it differed from the pattern for item recognition; for item recognition, the advantage of high IQ participants over low remained approximately constant with age.
In more detail, this result is demonstrated in the interactions of age and IQ (Figure 4). For item recognition, drift rates increased with IQ for all three age groups: doubling for the college-age and 60-74 year olds (from about .15 to about .30) and increasing somewhat less for the 75-90 year olds, from about .15 to about .20.
In contrast, for associative recognition, drift rates increased with IQ differentially for the three age groups. For college-age participants, the increase with IQ was about four-fold (about .05 to about .20). For the 60-74 year olds, the increase was about .05 to about .10, only a two-fold increase, and for the 75-90 year olds, IQ had no significant effect at all, with drift rates about .03 for all levels of IQ. We discuss this contrast between item and associative recognition below.
Figure 7 collapses over IQ to summarize the impact of age on drift rates for item and associative recognition and accuracy for cued and free recall. Each line represents performance of the 60-74 year olds or the 75-90 year olds relative to performance of the college-age participants (normalized to 1). To a good approximation, as expected, age affected associative memory but not item memory. The figure shows a drop in drift rates and accuracy from the college-age participants to the 75-90 year-olds in all four tasks. The decline for item recognition is much smaller than the decline for associative recognition and cued recall and there is little decline from college-age to 60- 74 year olds in item drift. (As noted earlier, the small decline for free recall was likely the result of the task being easy, with only eight words to recall, each studied twice.)
Figure 7.
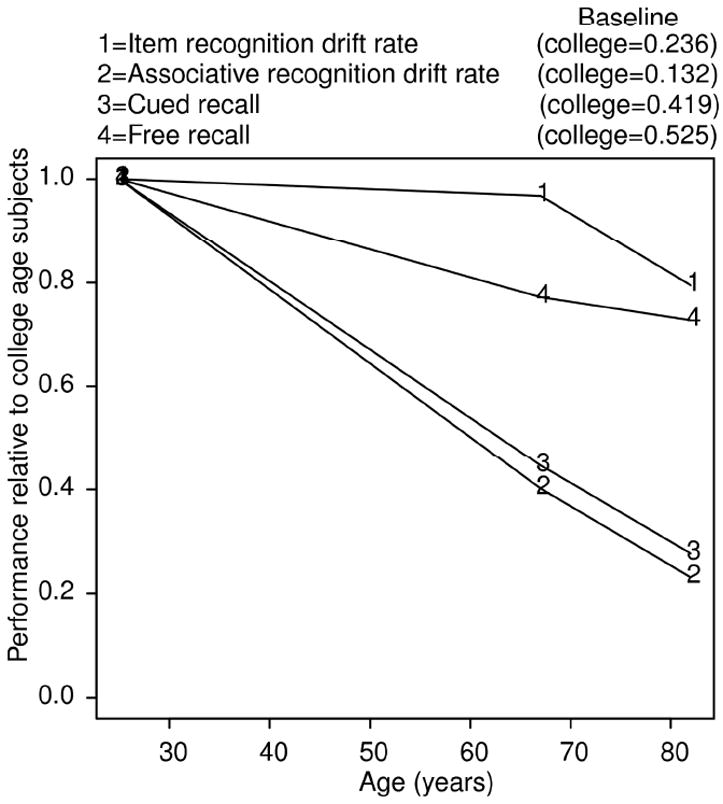
Relative values of drift rates for item and associative recognition, and accuracy values for cued and free recall as a function of age.
One question that might arise is: Could younger adults be more accurate than older adults if they adopted more conservative decision criteria (for speed-accuracy manipulations, see Ratcliff, Thapar & McKoon, 2001, 2003, 2004). Figure 1 showed that accuracy is quite similar for the college-age participants and the 60-74 year olds, but the latter adopt wider decision criteria. If the college-age participants adopted more conservative decision criteria, their RTs would slow and their accuracy would increase. It is instructive to see how large the effects might be. We took the parameter values from the college-age participants (first line in Table 2) and generated predictions for accuracy values and mean RTs. For the four conditions, accuracy values were 0.73, 0.86, 0.79, and 0.84, and mean RTs were 602, 586, 606, and 597 ms. Then we repeated generating the predictions but substituting the boundary separation and starting point values for the 60-74 year olds (second line, Table 2). With the boundaries increased, accuracy values were 0.74, 0.89, 0.88, and .92 with mean RTs 720, 673, 684, and 664 ms. (There is a small amount of bias in the college- age participants’ value of z which makes the accuracy differences between the first two and second two conditions not quite symmetric). The summary of this exercise is that moving boundaries out increases accuracy by only about 4% but changes mean RT by about 89 ms. Thus changes in speed- accuracy settings have a relatively large effect on mean RT, but a relatively small effect on accuracy. In Figure 1, the increase in accuracy is hardly noticeable expect for perhaps the condition for new high-frequency words (the third condition).
We note in passing that our results cannot be described by the phrase “use it or lose it” which is commonly used as a description of an approach to preventing cognitive decline (Hultsch, Hertzog, Small, & Dixon, 1999). “Use it or lose it” would predict that higher IQ participants’ drift rates would decline less with age than lower IQ participants’, for both item and associative memory. This is because high-IQ participants likely engage in more intellectual activity on a daily basis (such as reading books, solving crossword puzzles, and so forth) than low-IQ participants. However, this was not the case: drift rates suffered more for the higher than the lower IQ participants in associative recognition although less so for item recognition. The lack of significantly differential decline for item information is consistent with work by Lindenberger and Baltes (1997), Rabbitt, Chetwynd, and McInnes (2003), and Singer et al. (2003) who found little differential decline as a function of ability (but see Deary, MacLeannan, & Starr, 1998, who did find evidence for differential age-related declines as a function of ability).
Turning to the other components of processing, boundary separation and the nondecision component, the effects of age were similar to other published results (RTM). For both item and associative recognition, the distance between the boundaries was larger for the older participants than the college-age participants and the duration of their nondecision component was longer. However, neither boundary separation nor the nondecision component was affected by IQ (see also Ratcliff et al., 2010).
Starns and Ratcliff (2010) provided an explanation for the difference in the decision criteria adopted by younger and older adults. They found that younger adults are more likely to focus on getting the maximum number of responses correct per unit time and to do this, they are willing to sacrifice some degree of accuracy. In contrast, older adults are unwilling to make errors that they could avoid, that is, responses for which they might realize a few moments later that they were incorrect.
In addition to the results already described, we calculated correlations among all the performance measures and all the components of the model. The first result was that the model separated components of processing and measures of performance into two groups: Drift rates correlated with accuracy and IQ but not RTs, and boundary separation and the nondecision component correlated with RTs but not accuracy or IQ. This provides a clear dissociation between components of processing in the model and age and individual differences.
The second result was that item and associative recognition appear to share those mechanisms of decision making that are outside of drift rate: for both boundary separation and the nondecision component, there were strong correlations between the two tasks.
The third, most interesting, result was the high correlations between item and associative drift rates, around .5 to .6. This suggests that the two tasks rely on shared information in memory. But this result conflicts with the finding described above, that drift rates in item recognition change little with age whereas drift rates for associative recognition decline substantially. We discuss this conflict in the next section.
The failure to find significant correlations between IQ and RTs might be surprising. It might be expected that RTs would slow as IQ decreased (e.g., Detterman, 1987), but this was not the case in this study. The diffusion model explains this finding: Different participants adopt different speed-accuracy criterion settings (i.e., different distances between the two boundaries, Ratcliff et al., 2010), and these settings are not a function of IQ. If participants could be encouraged to adopt similar speed-accuracy settings, then the correlation between IQ and RT would be greater.
Memory Models
In speaking to hypotheses about memory systems, the data from the item and associative recognition tasks provide a challenging pattern for models to accommodate. A model must provide correlated levels of drift rates between the two tasks, but it also must dissociate drift rates in item recognition from drift rates in associative recognition (and cued recall) as a function of age.
Models that base item and associative recognition on exactly the same information in memory have problems because they cannot accommodate the differential changes with age. At the same time, models that base item and associative recognition on completely different information in memory have problems because they cannot accommodate the high correlations between drift rates for the two tasks. The main conclusion is that memory models must allow for differential memory strength for item and associative information as well as large correlations between item and associative information.
As examples of memory models, we consider Murdock’s 1982 model and Shiffrin and Steyvers’ 1997 model. In Murdock’s model, items are represented as vectors of features. When a memory is formed, item vectors are added into a memory vector. The probability that a particular feature will be added into memory is a parameter of the model (e.g., the probability is larger with longer study times per item). An association is represented as a convolution between two item vectors, which itself is a vector. The probability with which features from the convolution are encoded is different than the probability for item information. Thus, in the model, associative information is weighted separately from item information. This would allow the model to accommodate the sparing of item information along with the large drop in associative information with age by assuming that associative information is not stored as well, and the difference becomes greater with age. However, there is no a priori explanation for why this would happen. The model would also have to add a relationship across individuals between the probability of storing a feature of an item and storing a feature from an association in order to account for the high correlations between item and associative information in each age group.
In Shiffrin and Steyvers’ (1997) REM model, items are encoded as vectors of features. To form pairs, two items are concatenated. Associative recognition is modeled by matching a test pair against memory, and item recognition is modeled by matching a single item against memory. In this model, it is difficult to see how item and associative information could decline differentially as a function of age. However, hypotheses about associative information have not yet been fully developed and investigated.
The main problem with using memory models to address issues of age and individual differences is that, to our knowledge, there have been no attempts to do so. In fact, in the cognitive modeling literature in general, there have been few attempts to examine and understand individual differences, especially across different participant populations and how they might be similar or different across tasks.
Dual-Process Models
The research reported here is relevant to a recent view of memory that is quite different from the global memory models, a view that has been labeled “dual process.” Unlike the global memory models for which item and associative recognition depend on the same representation of information in memory, in dual-process models item recognition is based on two different representations that are stored separately. In setting the context of our research in terms of the global models, we argue against the dual-process approach. In the dual-process approach, a contrast is drawn between “familiarity” and “recollection.” Subjectively, recollection is a process by which details of a study episode are available to support recognition performance. Familiarity is simply a feeling of “knowing” that an item was presented in an earlier study episode.
In support of the dual-process view, Jacoby (1991; Jacoby & Kelley, 1992) developed a method for separating familiarity and recollection, the “include/exclude” method. The paradigm is an item recognition experiment in which participants study two lists of words, followed by a test list. In the “include” test condition, they respond “old” if a word appeared on either list and in the “exclude” test condition, they respond “old” only if the word appeared in one of the lists but not the other. Correct “old” responses in the include condition are taken to rely on both familiarity and recollection, and incorrect “old” responses in the exclude condition are taken to be failures of recollection. The probability that responses depend on recollection information is then estimated as P(R)= P(I)-P(E), where P(I) is the probability of an “old” response in the inclusion condition and P(E) is the probability of an incorrect “old” response in the exclusion condition. The probability that items are recognized on the basis of familiarity is P(F)=P(E)/(1-P(R)). Although we disagree that this paradigm allows the separation of two distinct processes, it is likely the case that exclude decisions do require the use of recollection. It is the conclusions drawn about item recognition with which we disagree.
One problem with this process dissociation method, pointed out by Ratcliff, Van Zandt and McKoon (1995), is that it cannot fail to produce separate, independent estimates of familiarity and recollection. There are two parameters in the model and two data points. The method will always produce a split of data between familiarity and recollection whether that is appropriate or not, and so the method is not falsifiable.
Ratcliff et al. (1995) used simulated data to demonstrate this problem. They showed that the method cannot be used to determine whether two sorts of information or only one underlie performance, nor, if there are two, can it guarantee accurate recovery of their relative contributions. Ratcliff, et al. performed simulations for which performance was determined by only one process (using the SAM model, Gillund & Shiffrin, 1984). Applying the process dissociation method still yielded separate estimates of familiarity and recollection. One conclusion that has been taken from this demonstration is that a single-process model can always explain results from experiments used to support dual-process models. However, that is not exactly the claim that was made by Ratcliff et al. Rather what was claimed was that the process dissociation method cannot be used to determine whether both familiarity and recollection are responsible for performance or only one of them.
A major point of contention has been the use of ROC functions and their z-transforms to argue for and against dual-process and single-process models of item recognition. Yonelinas (1994) extended the dual-process model to confidence judgments and receiver operating characteristics (ROCs). In his model, the familiarity process is represented by an equal-variance signal detection model (if equal variances are not assumed, the model is not identifiable). Recollection is represented by an all-or-none (high threshold) process. If recollection remains constant at all levels of the criterion setting and if familiarity and recollection are independent, then P(“yes”∣”old”)=P(R)+P(F>crit)-P(R)P(F>crit). By moving the criterion, an ROC function can be swept out. The result is z-transformed ROC functions that are often approximately linear with slopes less than one. However, Ratcliff et al. (1995) showed that the key assumption that recollection is constant across levels of criterion settings is not supported by data.
Since this initial work, a large amount of research has been conducted that either supports the dual-process view, provides a different version of it, or assumes that only a single dimension (not separate familiarity and recollection) underlies performance. Some models use a single source of familiarity based on an unequal-variance signal detection model to explain z-ROC functions (see the debate in Cohen, Rotello, & McMillan, 2008; DeCarlo, 2002; Dunn, 2004; 2008; Rotello, MacMillan, & Reeder, 2004; Starns & Ratcliff, 2008; Wixted, 2007; Wixted & Stretch, 2004; Yonelinas, 1997). For some researchers, there are two kinds of information that are independent of each other, for others, there is a continuous dimension between them, and for others, there is only one kind of information.
There have been two recent studies that challenge the dual-process view. Ratcliff and Starns (2009) designed a model for recognition memory that can explain the RTs of confidence judgments for recognition memory, as well as the probabilities with which responses in the different confidence categories are made. In their model, the decision process is composed of racing diffusion processes, one for each confidence category. z-ROC slopes less than 1 can be explained in terms of differences in decision criterion settings, even if the memory familiarity distributions for old and new items have equal SDs.
Starns, Ratcliff, and McKoon (submitted) conducted an item recognition experiment that manipulated speed/accuracy instructions, the proportions of old and new test items (5 different proportions), word frequency, and number of repetitions. Each of four participants were tested for 20 sessions each. When instructions stressed speed, most responses were made under 570 ms and the z-ROC slope was less than 1. To produce a less-than-1 slope, Yonelinas’ (1994) dual-process model requires that familiarity and recollection both contribute to performance. However, responses were too fast for recollection to contribute. It follows that the unity or non-unity of z- ROC slopes does not provide a diagnostic for single- versus dual-process theories.
Both the Ratcliff and Starns (2009) and Starns et al. (submitted) studies push this domain of research to jointly account for RT distributions and ROC functions. Attempting to explain both will produce a new set of modeling issues that will supersede both accuracy-based signal-detection models and dual-process models and this will require complete reworking of those models or even completely new models.
There are several other empirical results that challenge familiarity/recollection dual- process hypotheses. Experiments by Gronlund and Ratcliff (1989; also Ratcliff & McKoon, 1982) mapped out the time course of availability of information using a response signal procedure. Participants studied lists of pairs of words, with a test list of pairs following each study list. In one condition, the test pairs were made up of either two old words, one old word and one new word, or two new words, and participants responded “old” if the two words had appeared on the study list and “new” if they had not, irrespective of whether they had occurred in the same pair at study. For associative recognition, they responded “intact” if the two words had been studied in the same pair, “rearranged” otherwise. To examine the time course of processing, a response signal was given after each test pair was presented, with the signals varying from 50 ms after the pair to 2500 ms after. Participants were instructed to respond immediately at the signal.
Gronlund and Ratcliff’s data raise two issues for dual-process hypotheses. First, if associative recollection information was used in the item recognition task, then accuracy for item recognition should have been better for intact than rearranged pairs. Although Gronlund and Ratcliff did find such a difference, it was small (d’=0.34), and it was much smaller than the difference in accuracy between intact and rearranged pairs when the task was associative recognition (for which the d’ difference varied between 1.24 and 1.96 in different experiments). Clark and Shiffrin (1992) found a similar result: a larger difference in accuracy between intact and rearranged pairs when the task was associative recognition than when it was item recognition. Taking the data from Gronlund and Ratcliff’s study at face value, there are between 1.24 and 1.96 d’ units of associative information available yet only 0.34 units are used in item recognition. If subjects were using an explicit recall strategy, then one recall attempt would be needed for intact pairs, while two successful attempts would be needed for rearranged pairs (to make sure each word in the pair had an associate). The probability of two successful recall attempts would be lower than one attempt, and the difference would depend on the cued recall probability. The findings of both of the studies suggest, contra simple dual-process hypotheses, that participants had more associative information available to them than was used in item recognition.
The second issue raised by Gronlund and Ratcliff’s study was that item and associative information became available at different points in time. Accuracy for decisions requiring only item information was above chance by 330 ms. Accuracy for decisions requiring associative information did not begin to rise above chance until after 570 ms (see also Ratcliff & McKoon, 1989; McElree, Dolan, & Jacoby, 1999).
Like Gronlund and Ratcliff (1989), Clark and Shiffrin (1992), and Starns et al. (submitted), Gillund and Shiffrin (1984) found data inconsistent with associative recollection information being used in item recognition decisions. They investigated the effects of three variables that would be thought to affect recollection (or “search processes” as they termed the recollective process): the number of times an item was repeated in a study list, the depth of encoding of the studied items, and the type of distractor that was used in the test list. They also manipulated participants’ decision times. According to the dual-process view, larger effects of the three variables should have been observed when decision time was long, but instead there were no interactions of the three variables with short versus long decision times.
The results of all of these studies strongly suggest that when associative information might be used to help an item recognition decision, it is not. The failure to use associative information might occur because it requires more active effortful retrieval processes, processes that would be used only if a task required this sort of information (as in intact/rearranged decisions).
Buchler, Light, and Reder (2008) conducted a study that found that participants can access different sources of information in associative recognition, for example, they can access information about each word of a pair separately and they can access information about the association. The results were interpreted in terms of a dual-process model (SAC, Reder et al., 2000), but unlike the dual-process models based on process dissociation, SAC has structure and makes predictions across a range of experimental variables. However, like the global memory models, it is mute on the relationship between accuracy and RT.
The dual-process models based on process dissociation contrast with global memory models in terms of their goals. The global models attempt to explain the effects of many experimental variables on performance in many experimental tasks. In contrast, dual-process models focus on explaining performance in terms of two processes that rest on the two different sorts of information, familiarity and recollection. These dual-process models, as currently instantiated, do not specify processes or representations in detail, as the global memory models do, and so they typically do not produce predictions about how performance will change as a function of independent variables or how performance on one task relates to another.
Furthermore, the dual-process models provide no account of the interdependence between the two dependent variables, RT and accuracy, in either item recognition or associative recognition tasks. In contrast, the diffusion model (Ratcliff, 1978) explains the two variables simultaneously. Decisions are based on a single, continuously available source of information.
There are also a variety of EEG and fMRI data that address the issue of single-process versus dual-process views of item recognition. In EEG studies, event-related potential (ERP) components have been identified by subtracting the ERP signals of one brain region from the ERP signals of another as a function of experimental variables such as studied/not studied, correct/ incorrect, and encoding strength (e.g., deep versus shallow encoding; Rugg & Curran, 2007; Rugg, 1995). Two ERP components have been reliably estimated in several studies: a frontal component, identified with familiarity, that occurs in the range of 300 to 500 ms after onset of a test item, and a parietal component, identified with recollection, that occurs in the range of 400 and 500 ms after onset (Eichenbaum et al., 2007; but see MacKenzie & Donaldson, 2007; Yovel & Paller, 2004). Many of these studies show that different brain areas become active during item recognition and that these areas seem to correspond to different kinds of information. However, activity in a particular region of the brain does not mean that information corresponding to that activity is used in making a decision.
In another line of research, a “mnemonic accumulator” hypothesis has been proposed, based mainly on fMRI evidence. The hypothesis is that there is a link between activity in the posterior parietal cortex and memory retrieval (Cabeza et al., 2008; Konishi et al., 2000; Wagner et al., 2005). One possibility is that activity in the parietal regions represents the integration of memory-strength signals from separate processes and/or brain areas for familiarity and recollection. However, because of the temporal uncertainty in the fMRI signal, it is not clear when and what are the sources of information actually entering the decision process.
Most recently, in an fMRI study, Johnson, McDuff, Rugg, and Norman (2009) provided a multivoxel pattern-classification analysis of an item recognition task. In this task, participants were required to use a scale that was made up of a remember judgment and four confidence judgments to be used if a remember judgment was not made. They trained pattern classifiers on the fMRI signals for three encoding tasks for words that denote objects (describe how an artist would draw the object and rate the difficulty, report how many functions the object has, and report how difficult it would be to read the word backwards). At test, they found reinstatement of the encoding patterns both when the participant indicated that they remembered the item and when they had only a feeling of familiarity. They argued that both sources of information are present and combined in making a recognition judgment and that even recollective information is better viewed as continuously available information as opposed to threshold information. However, they offered the caveats mentioned in the previous paragraph: that fMRI cannot be used to determine the time course of reinstatement and that fMRI signals may reflect processing that occurs after a response is made.
In sum, we see four major problems with the dual-process approach. One is that, as Ratcliff et al. (1995) showed, there is no way to falsify the claim that item recognition is composed of two processes. Even if data are generated from a single process, the process-dissociation method produces estimates of two processes (an exception is the SAC model, Reder et al., 2000, that predicts patterns of results across many more than two conditions; see also Norman & O’Reilly, 2003). The second problem is that experiments designed to find effects of associative information on item recognition have failed to show more than a very modest contribution (Clark & Shiffrin, 1992; Gillund & Shiffrin, 1984; Gronlund & Ratcliff, 1989). The third problem is that, by focusing on separating familiarity and recollection in item recognition tasks (either behaviorally or in terms of brain activity), dual-process theory has taken a step backward. There has been little attempt to understand the actual processes underlying familiarity and recollection. Dual-process approaches contrast with the global memory models’ attempts to understand how retrieval processes operate and how information is represented in memory. Fourth, the available EEG and fMRI data do not show conclusively that there are two components of processing associated with different brain regions that both contribute to item recognition decisions.
In contrast to dual-process views that propose that recollection and familiarity both contribute to item recognition decisions, we argue that item recognition depends on only a single source of information in memory (as long as a participant is performing relatively passively, as is usually the case in the tasks relevant here). There is absolutely no doubt that, for many test items, participants could recover information about them (as in recollection) and base a decision on the recovered information. It is also not clear that a binary distinction between sources of information is the correct one. Item information and associative information are associated, as in the correlations across individuals presented above, but they dissociate with age. Source memory seems to be different from item information and in the models that link item information to context (e.g., Dennis & Humphreys, 2001), the representation of source (context) and associative information are quite different. Accessing source or associative information is a slow effortful process and we see little evidence for this being used routinely in simple item recognition tasks.
Associative Deficits
Naveh-Benjamin (2000; see also Burke & Light, 1981; Chalfonte & Johnson, 1996; Spencer & Raz, 1995) has proposed that problems in binding are responsible for associative deficits with age; this has been called the associative deficit hypothesis (ADH). Binding is said to involve the creation and retrieval of links between units of information, such as the link between two items of a pair or the link between an item and its context. Examples of the sorts of links that have been studied empirically are words in a particular color, words in positions on display screens, words presented in a male or female voice, the temporal order of two items, and item pairings for verbal and nonverbal material. The ADH focuses on the distinction between memory for single units and memory for associations between units and provides an account for why item information remains relatively intact with age whereas associative information is reduced. But the ADH does not propose specific mechanisms that might be responsible for deficits for some kinds of information but not others.
Li, Naveh-Benjamin, and Lindenberger (2005) proposed a specific, three-layer connectionist model that allows the difference between item and associative information as a function of age to be explained in a single architecture. Items of a pair are encoded into separate vectors in the input layer and three separate sets of hidden units map from the input vectors to two output vectors. Two sets of hidden units map the input item vectors to the output item vectors and the third set of hidden units maps from both input vectors to both output vectors. Item recognition is represented by how well an input vector for an item is produced at output (the dot product between the input vector and the output vector) and associative recognition is represented by how well an input vector for a pair is produced at output (the dot product between the vector pair at input and output). The deficit in aging was modeled by a change in a single gain parameter that modulated the mapping from input to output (via a sigmoidal function). The model was able to account for the data from Naveh-Benjamin’s (2000) Experiment 2. In that experiment, participants were instructed to study pairs as single items or as pairs, and item and associative recognition were tested.
This kind of model is a candidate to explain the differences that have been found between item and associative recognition, but it needs to be developed further and evaluated in ways that are standard in the memory models literature; for example, it needs to address catastrophic interference (McCloskey & Cohen, 1989; Ratcliff, 1990), mirror effects (Glanzer & Adams, 1990), the list strength effect (Ratcliff, Clark, & Shiffrin, 1990), and so on. For an example of a model that addresses these issues, see Shiffrin and Steyvers (1997).
Cognitive Ability Studies
In research on IQ and cognitive abilities, intelligence has been divided into fluid intelligence and crystallized intelligence (e.g., Carroll, 1993). To relate our results to this approach, and because we included WAIS measures of fluid intelligence (matrix reasoning) and crystallized intelligence (vocabulary), we might assign associative recognition to the fluid intelligence class of tasks (cf, Li et al., 2004) because associative recognition declines with age. Also, because item recognition declines relatively little with age, it might be assigned to the crystallized class of tasks. This classification would then predict higher correlations across individuals between WAIS matrix reasoning and associative recognition and between WAIS vocabulary and item recognition than the other two comparisons (see Table 4). In fact, apart from the lower correlation between matrix reasoning and item recognition drift rate for college-age participants, the correlations between item and associative recognition drift rates and the two IQ measures appear to be similar across the three age groups.
Schmiedek et al. (2007) analyzed data from eight choice-RT tasks (including verbal, numerical, and spatial tasks) from Oberauer, Suβ, Wilhelm, and Wittmann (2003) using an exGaussian analysis (Hohle, 1965; Ratcliff & Murdock, 1976) and an EZ diffusion model analysis (Wagenmakers, van der Maas, & Grassman, 2007). They found that drift rates in the diffusion model mapped onto working memory, speed of processing, and reasoning ability measures (each of these was measured by aggregated performance on several tasks). These results are similar to the relationship between IQ measures and drift rates found in this article and in Ratcliff et al. (2010). However, they also found significant correlations between drift rates, boundary separation, and nondecision time. Our study (like Ratcliff et al., 2010, and almost all of the RTM studies) found only weak correlations between boundary separation and nondecision time, and no significant correlations between drift rates and either boundary separation or nondecision time. There are some important differences between the Oberauer study and the study reported here. First, we used a much larger range of IQs (Oberauer et al. used university students); second, we used several age ranges; and third, we had smaller numbers of participants per group (the latter would not be responsible for the lower correlations) but many more observations for item and associative recognition. It is possible that the low number of observations and use of the EZ method in the Oberauer et al. study have produced spurious correlations in the model fits (see Ratcliff, 2008), but simulation studies would have to be conducted to evaluate this.
One of the main features of our study is that it allows decomposition of speed of processing and accuracy into model components within a unified single-model structure. This allows factors responsible for individual differences in RT and accuracy to be identified. In traditional abilities approaches, only one of these dependent variables is used in analyses. Because the different measures behave in different ways, analyses based on only one of them produce an incomplete picture of individual differences.
In individual differences applications to aging, a psychometrics approach is useful in a practical sense to identify the general categories of deficits that appear with age. However, from a theoretical perspective, it is limited because it averages over tasks and measures and so cannot provide an account of the processes involved in the individual tasks. Also, because performance is averaged over tasks, it is not a priority to understand processing differences within tasks within an “ability”. This, in a sense, is the converse problem to memory models’ current lack of attempt to deal with individual differences.
In other research, the effects of task and condition difficulty have been shown to interact with age and ability (e.g., Baltes & Kliegl, 1992; Salthouse, 1992). There are undoubtedly some abilities that decline with age in a way that older adult performance cannot improve to the level of younger adults (e.g., Baltes & Kliegl, 1992). However, other studies have demonstrated abilities that show little decline with age (Ratcliff et al., 2007). It may be that performance declines with the increased complexity of a task (e.g., Salthouse, 1992) because resources needed to perform the task (e.g., working memory) decline with age. Our results complement this research by showing that one component of memory (item recognition) shows little decline with age, even at all performance levels, but large differences with IQ, while associative recognition shows large declines with IQ and age.
Our results show decreased correlations of IQ with advanced age. Results of this kind have been argued to show a depletion of resources for cognitive tasks so that as performance declines, differences based on ability (e.g., IQ) are reduced and differences based on genetic factors become a larger proportion of individual differences (e.g., Lindenberger et al., 2008; Nagel et al., 2008). It might seem that the results presented here are consistent with this hypothesis because correlations are smaller for the 75-90 year old group. But there are only three correlations that do not have measures in which performance is approaching floor (if performance is near floor, correlations are automatically reduced). These are correlation between IQ vocabulary, item recognition drift rate, and free recall proportion. Of these, the correlation of item recognition drift rate and free recall does not show a decline.
An important demonstration by our study is that behavioral data can be much richer than what is typically used in genetic studies. For example, Papassotiropoulos et al. (2006) showed that the polymorphism rs17070145 in the KIBRA gene was associated with episodic memory performance. A follow-up study by Schaper et al. (2008) replicated Papassotiropoulos et al.’s study but one by Need et al. (2008) failed to replicate. In these studies, the behavioral data were limited, for example, Papassotiropoulos et al. used a single list of items for recall. Schaper et al. had participants learn a single list of 15 nouns and these were recalled 5 times, then recalled 30 min. later, and then recognition was tested. In the Need et al. study, one test involved list learning and recall and another test involved story recall. In the Schaper et al. study, the effect size corresponded to a recall difference of about 13% and in the Need et al. study, the effect size able to be detected was about 3% with power 90%, so the null result was not because of lack of power.
The assumption made in these genetic studies is that any memory task (even with extremely limited data per participant) taps into a single ability, namely episodic memory (see Thapar, Petrill, & Thompson, 1994). Our experiment shows that data in item recognition, associative recognition, and recall are multifaceted. It shows individual differences and values that change across age that are much larger than the differences reported as a function of genetic differences. Our study also shows that some aspects of performance decline at different rates as a function of age and some are related to IQ and some are not. Interestingly, the correlations of memory measures with IQ support the notion that single tests can index general memory ability within a single age group of participants. Thapar et al. investigated the heritability of memory ability in the Western Reserve Twin Project (Thompson, Detterman, & Plomin, 1991). This study is unique in that its test battery includes measures of memory ability that tap memory span, verbal memory, and visual memory. Results showed low inter-correlations across the memory measures and the estimates of genetic and environmental influences on memory ability varied across memory measures. It seems that genetic studies of memory are in their infancy and the reliability of the effects needs to be more systematically investigated. Moreover, the amount and quality of the behavioral measures are impoverished relative to what are usually seen in cognitive research.
Our study also provides practical points that should be considered in conducting new research. First, researchers investigating individual differences in aging will need to carefully consider the ages of participants because the data clearly show different trends for younger older adults relative to very old adults (Lindenberger & Baltes, 1997). Mixing the two might mean averaging over different patterns of results. Second, the performance of young adults is also highly variable and impacted by ability. Although this is not necessarily surprising, it does mean that it is critical for researchers to classify young adults into ability groups when examining how ability is affected by aging. Third, the associative deficit hypothesis proposed by Naveh-Benjamin (2000) will need to address the performance of low-IQ young adults. To our knowledge, there has been no discussion of how low-ability young adults might struggle with associative recognition tasks.
Conclusion
The results of this study begin to provide a theoretical framework to show how speed of processing is related to memory performance across age groups and individuals. The experiment also provides archival results for the relationship between ability measures, memory, and speed of processing in memory tasks.
This study reports the first account by a sequential sampling model of associative recognition accuracy and RT. The results show dramatic declines in memory as a function of age in associative recognition, but small declines in item recognition (as is well known in the aging literature, e.g., Naveh-Benjamin, 2000). The results also show dramatic differences in performance on both item and associative recognition as a function of IQ.
The results show strong regularities in individual differences in memory tasks. Drift rate, accuracy in recall tasks, and IQ measures are all highly intercorrelated. In contrast, boundary separation is correlated across the two tasks as is the duration of the nondecision component, but neither is correlated with IQ or drift rates. Boundary separation and nondecision duration are affected by age but not IQ. For item recognition, the effect of age on drift rate is small but the effect of IQ is large. The effects of age and IQ on drift rate for associative recognition are both large. In sum, the differences in item and associative recognition as a function of IQ and age present important targets for memory models.
Acknowledgments
Author Note
Preparation of this article was supported by NIA grant R01-AG17083. We thank Bill Hockley and John Wixted for useful comments on the article.
Footnotes
Publisher's Disclaimer: The following manuscript is the final accepted manuscript. It has not been subjected to the final copyediting, fact-checking, and proofreading required for formal publication. It is not the definitive, publisher-authenticated version. The American Psychological Association and its Council of Editors disclaim any responsibility or liabilities for errors or omissions of this manuscript version, any version derived from this manuscript by NIH, or other third parties. The published version is available at www.apa.org/pubs/journals/xge
References
- Balota DA, Dolan PO, Duchek JM. Memory changes in healthy young and older adults. In: Tulving E, Craik FIM, editors. Handbook of Memory. Oxford University Press; 2000. pp. 395–410. [Google Scholar]
- Baltes PB, Kliegl R. Further testing of limits of cognitive plasticity: negative age differences in a mnemonic skill are robust. Developmental Psychology. 1992;28:121–125. [Google Scholar]
- Bowles NL, Poon LW. An analysis of the effect of aging on recognition memory. Journal of Gerontology. 1982;37:212–219. doi: 10.1093/geronj/37.2.212. [DOI] [PubMed] [Google Scholar]
- Buchler NG, Light LL, Reder LM. Memory for items and associations: Distinct representations and processes in associative recognition. Journal of Memory and Language. 2008;59:183–199. doi: 10.1016/j.jml.2008.04.001. [DOI] [PMC free article] [PubMed] [Google Scholar]
- Buchler NEG, Reder LM. Modeling age-related memory deficits: A two-parameter solution. Psychology and Aging. 2007;22:104–121. doi: 10.1037/0882-7974.22.1.104. [DOI] [PubMed] [Google Scholar]
- Burke DM, Light LL. Memory and aging: the role of retrieval processes. Psychological Bulletin. 1981;90:513–514. [PubMed] [Google Scholar]
- Cabeza R, Ciaramelli E, Olson IR, Moscovitch M. The parietal cortex and episodic memory: An attentional account. Nature Reviews Neuroscience. 2008;9:613–625. doi: 10.1038/nrn2459. [DOI] [PMC free article] [PubMed] [Google Scholar]
- Carroll JB. Human cognitive abilities: A survey of factor-analytical studies. New York: Cambridge University Press; 1993. [Google Scholar]
- Chalfonte BL, Johnson MK. Feature memory and binding in young and older adults. Memory and Cognition. 1996;24:403–416. doi: 10.3758/bf03200930. [DOI] [PubMed] [Google Scholar]
- Clark SE, Shiffrin RM. Cuing effects and associative information in recognition memory. Memory and Cognition. 1992;20:580–598. doi: 10.3758/bf03199590. [DOI] [PubMed] [Google Scholar]
- Cohen AL, Rotello CM, Macmillan NA. Evaluating models of remember-Know judgments: Complexity, mimicry, and discriminability. Psychonomic Bulletin & Review. 2008;15:906–926. doi: 10.3758/PBR.15.5.906. [DOI] [PubMed] [Google Scholar]
- Craik FIM. On the transfer of information from temporary to permanent memory. Philosophical Transactions of the Royal Society of London B. 1983;302:341–359. [Google Scholar]
- Craik FIM. A functional account of age differences in memory. In: Klix F, Hagendorf H, editors. Human memory and cognitive capabilities, mechanisms, and performances. Amsterdam: Elsevier; 1986. [Google Scholar]
- Craik FIM. Memory changes in normal aging. Current Directions in Psychological Science. 1994;3:155–158. [Google Scholar]
- Craik FIM, Jennings J. Human memory. In: Craik FIM, Salthouse TA, editors. The handbook of aging and cognition. Hillsdale, N.J.: Lawrence Erlbaum Associates; 1992. pp. 51–110. [Google Scholar]
- Craik FIM, McDowd JM. Recall, recognition, and aging. Journal of Experimental Psychology: Learning, Memory, and Cognition. 1987;13:474–479. [Google Scholar]
- Deary IJ, MacLeannan WJ, Starr JM. Is age kinder to the initially more able?: Differential ageing of a verbal ability in the Healthy Old People in Edinburgh Study. Intelligence. 1998;26:357–375. [Google Scholar]
- DeCarlo LT. Signal detection theory with finite mixture distributions: Theoretical developments with applications to recognition memory. Psychological Review. 2002;109:710–721. doi: 10.1037/0033-295x.109.4.710. [DOI] [PubMed] [Google Scholar]
- Dennis S, Humphreys MS. A context noise model of episodic word recognition. Psychological Review. 2001;108:452–477. doi: 10.1037/0033-295x.108.2.452. [DOI] [PubMed] [Google Scholar]
- Detterman DK. What does reaction time tell us about intelligence? In: Vernon PA, editor. Speed of information processing and intelligence. Norwood, NJ: Ablex; 1987. pp. 177–199. [Google Scholar]
- Dunn JC. Remember-Know: A Matter of Confidence. Psychological Review. 2004;111:524–542. doi: 10.1037/0033-295X.111.2.524. [DOI] [PubMed] [Google Scholar]
- Dunn JC. The dimensionality of the Remember-Know task: A state-trace analysis. Psychological Review. 2008;115:426–446. doi: 10.1037/0033-295X.115.2.426. [DOI] [PubMed] [Google Scholar]
- Eichenbaum H, Yonelinas AP, Ranganath C. The medial temporal lobe and recognition memory. Annual Review of Neuroscience. 2007;30:123–152. doi: 10.1146/annurev.neuro.30.051606.094328. [DOI] [PMC free article] [PubMed] [Google Scholar]
- Erber JT. Age differences in recognition memory. Journal of Gerontology. 1974;29:177–181. doi: 10.1093/geronj/29.2.177. [DOI] [PubMed] [Google Scholar]
- Folstein MF, Folstein SE, McHugh PR. Mini-mental state: A practical method for grading the cognitive state of patients for the clinician. Journal of Psychiatric Research. 1975;12:189–198. doi: 10.1016/0022-3956(75)90026-6. [DOI] [PubMed] [Google Scholar]
- Geddes J, Ratcliff R, Allerhand M, Childers R, Wright RJ, Frier BM, Deary IJ. Modeling the effects of hypoglycemia on a two-choice task in adult humans. Neuropsychology. 2010;24:652–660. doi: 10.1037/a0020074. [DOI] [PubMed] [Google Scholar]
- Gillund G, Shiffrin RM. A retrieval model for both recognition and recall. Psychological Review. 1984;91:1–67. [PubMed] [Google Scholar]
- Glanzer M, Adams JK. The mirror effect in recognition memory: Data and theory. Journal of Experimental Psychology: Learning, Memory, and Cognition. 1990;16:5–16. doi: 10.1037//0278-7393.16.1.5. [DOI] [PubMed] [Google Scholar]
- Gordon SK, Clark WC. Adult age differences in word and nonsense syllable recognition memory and response criterion. Journal of Gerontology. 1974;29:659–665. doi: 10.1093/geronj/29.6.659. [DOI] [PubMed] [Google Scholar]
- Gronlund SD, Ratcliff R. The time-course of item and associative information: Implications for global memory models. Journal of Experimental Psychology: Learning, Memory and Cognition. 1989;15:846–858. doi: 10.1037//0278-7393.15.5.846. [DOI] [PubMed] [Google Scholar]
- Healy MR, Light LL, Chung C. Dual-Process Models of Associative Recognition in Young and Older Adults: Evidence From Receiver Operating Characteristics. Journal of Experimental Psychology: Learning, Memory, and Cognition. 2005;31:768–788. doi: 10.1037/0278-7393.31.4.768. [DOI] [PubMed] [Google Scholar]
- Hockley WE. Recognition memory for item and associative information: A comparison of forgetting rates. In: Lewandowsky S, Hockley WE, editors. Relating theory and data: Essays in human memory in honor of Bennet B Murdock. Hillsdale, NJ: Lawrence Erlbaum Associates, Inc.; 1991. pp. 227–248. [Google Scholar]
- Hockley WE. Reflections of the mirror effect for item and associative recognition. Memory and Cognition. 1994;22:713–722. doi: 10.3758/bf03209256. [DOI] [PubMed] [Google Scholar]
- Hockley WE, Cristi C. Tests of encoding tradeoffs between item and associative information. Memory and Cognition. 1996;24:202–216. doi: 10.3758/bf03200881. [DOI] [PubMed] [Google Scholar]
- Hohle RH. Inferred components of reaction times as a function of foreperiod duration. Journal of Experimental Psychology. 1965;69:382–386. doi: 10.1037/h0021740. [DOI] [PubMed] [Google Scholar]
- Hultsch DF, Hertzog C, Small BJ, Dixon RA. Use it or lose it? Engaged life style as a buffer of cognitive decline in aging. Psychology and Aging. 1999;14:245–263. doi: 10.1037//0882-7974.14.2.245. [DOI] [PubMed] [Google Scholar]
- Humphreys MS. Relational information and the context effect in recognition memory. Memory and Cognition. 1976;4:221–232. doi: 10.3758/BF03213167. [DOI] [PubMed] [Google Scholar]
- Humphreys MS. Item and relational information: A case for context independent retrieval. Journal of Verbal Learning and Verbal Behavior. 1978;17:175–187. [Google Scholar]
- Humphreys MS, Bain JD, Pike R. Different ways to cue a coherent memory system: A theory for episodic, semantic, and procedural tasks. Psychological Review. 1989;96:208–233. [Google Scholar]
- Jacoby LL. A process dissociation framework: Separating automatic from intentional uses of memory. Journal of Memory and Language. 1991;30:513–541. [Google Scholar]
- Jacoby LL, Kelley CM. A process-dissociation framework for investigating unconscious influences: Freudian slips, projective tests, subliminal perception, and signal detection theory. Current Directions in Psychological Science. 1992;1:174–179. [Google Scholar]
- Johnson JD, McDuff SGR, Rugg MD, Norman KA. Recollection, familiarity, and cortical reinstatement: A multivoxel pattern analysis. Neuron. 2009;63:697–708. doi: 10.1016/j.neuron.2009.08.011. [DOI] [PMC free article] [PubMed] [Google Scholar]
- Kaufman SB, DeYoung CG, Gray JR, Brown J, Mackintosh N. Associative learning predicts intelligence above and beyond working memory and processing speed. Intelligence. 2009;37:374–382. [Google Scholar]
- Kausler DH. Learning and memory in normal aging. San Diego, CA: Academic Press; 1994. [Google Scholar]
- Kelley R, Wixted JT. On the nature of associative information in recognition memory. Journal of Experimental Psychology: Learning, Memory, and Cognition. 2001;27:701–722. [PubMed] [Google Scholar]
- Konishi S, Wheeler ME, Donaldson DI, Buckner RL. Neural correlates of episodic retrieval success. Neuroimage. 2000;12:276–286. doi: 10.1006/nimg.2000.0614. [DOI] [PubMed] [Google Scholar]
- Kucera H, Francis W. Computational analysis of present-day American English. Providence, RI: Brown University Press; 1967. [Google Scholar]
- Laming DRJ. Information theory of choice reaction time. New York: Wiley; 1968. [Google Scholar]
- Li S-C, Lindenberger U, Hommel B, Aschersleben G, Prinz W, Baltes PB. Transformations in the couplings among intellectual abilities and constituent cognitive processes across the life span. Psychological Science. 2004;15:155–163. doi: 10.1111/j.0956-7976.2004.01503003.x. [DOI] [PubMed] [Google Scholar]
- Li S-C, Naveh-Benjamin M, Lindenberger U. Aging neuromodulation impairs associative binding. Psychological Science. 2005;16:445–450. doi: 10.1111/j.0956-7976.2005.01555.x. [DOI] [PubMed] [Google Scholar]
- Light LL, Patterson MM, Chung C, Healy MR. Effects of repetition and response deadline on associative recognition in young and older adults. Memory & Cognition. 2004;32:1182–1193. doi: 10.3758/bf03196891. [DOI] [PubMed] [Google Scholar]
- Lindenberger U, Baltes PB. Intellectual functioning in old and very old age: Cross- sectional results from the Berlin Aging Study. Psychology & Aging. 1997;12:410–432. doi: 10.1037//0882-7974.12.3.410. [DOI] [PubMed] [Google Scholar]
- Lindenberger U, Nagel IE, Chicherio C, Li S-C, Heekeren HR, Bäckman L. Age-related decline in brain resources modulates genetic effects on cognitive functioning. Frontiers in Neuroscience. 2008;2:234–244. doi: 10.3389/neuro.01.039.2008. [DOI] [PMC free article] [PubMed] [Google Scholar]
- MacKenzie G, Donaldson DI. Dissociating recollection from familiarity: Electrophysiological evidence that familiarity for faces is associated with a posterior old/new effect. NeuroImage. 2007;36:454–463. doi: 10.1016/j.neuroimage.2006.12.005. [DOI] [PubMed] [Google Scholar]
- Malmberg KJ, Xu J. On the flexibility and on the fallibility of associative memory. Memory & Cognition. 2007;35:545–556. doi: 10.3758/bf03193293. [DOI] [PubMed] [Google Scholar]
- McClelland JL, Chappell M. Familiarity breeds differentiation: A Bayesian approach to the effects of experience in recognition memory. Psychological Review. 1998;105:724–760. doi: 10.1037/0033-295x.105.4.734-760. [DOI] [PubMed] [Google Scholar]
- McCloskey M, Cohen NJ. Catastrophic interference in connectionist networks: The sequential learning problem. In: Bower GH, editor. The psychology of learning and motivation: Advances in research and theory. Vol. 24. New York: Academic Press; 1989. pp. 109–165. [Google Scholar]
- McElree B, Dolan PO, Jacoby LL. Isolating the contributions of familiarity and source information in item recognition: A time-course analysis. Journal of Experimental Psychology: Learning, Memory & Cognition. 1999;25:563–582. doi: 10.1037//0278-7393.25.3.563. [DOI] [PMC free article] [PubMed] [Google Scholar]
- Merriam-Webster. Merriam-Webster’s ninth new collegiate dictionary. 9. Springfield, MA: Author; 1990. [Google Scholar]
- Mitchell KJ, Johnson MK, Raye CL, Mather M, D’Esposito M. Aging and reflective processes of working memory: Binding and test load deficits. Psychology and Aging. 2000;15:527–541. doi: 10.1037//0882-7974.15.3.527. [DOI] [PubMed] [Google Scholar]
- Murdock BB. Human memory: theory and data. Potomac, Md.: Erlbaum; 1974. [Google Scholar]
- Murdock BB. A theory for the storage and retrieval of item and associative information. Psychological Review. 1982;89:609–626. doi: 10.1037/0033-295x.100.2.183. [DOI] [PubMed] [Google Scholar]
- Murdock BB. Item and associative information in a distributed memory model. Journal of Mathematical Psychology. 1992;36:68–99. doi: 10.1006/jmps.2000.1339. [DOI] [PubMed] [Google Scholar]
- Nagel IE, Chicherio C, Li S-C, von Oertzen T, Sander T, Villringer A, Heekeren HR, Bäckman L, Lindenberger U. Human aging magnifies genetic effects on executive functioning and working memory. Frontiers in Human Neuroscience. 2008;2 doi: 10.3389/neuro.09.001.2008. Article 1. [DOI] [PMC free article] [PubMed] [Google Scholar]
- Naveh-Benjamin M. Adult age differences in memory performance: Tests of an associative deficit hypothesis. Journal of Experimental Psychology: Learning, Memory, and Cognition. 2000;26:1170–1187. doi: 10.1037//0278-7393.26.5.1170. [DOI] [PubMed] [Google Scholar]
- Neath I. Human Memory: An introduction to research, data, and theory. Pacific Grove, CA: Brooks/Cole; 1998. [Google Scholar]
- Need AC, Attix DK, McEvoy JM, et al. Failure to replicate effect of kibra on human memory in two large cohorts of European origin. American Journal of Medical Genetics, Part B: Neuropsychiatric Genetics. 2008;147b:667–668. doi: 10.1002/ajmg.b.30658. [DOI] [PubMed] [Google Scholar]
- Nelder JA, Mead R. A simplex method for function minimization. Computer Journal. 1965;7:308–313. [Google Scholar]
- Norman KA, O’Reilly RC. Modeling hippocampal and neocortical contributions to recognition memory: A complementary-learning- systems approach. Psychological Review. 2003;104:611–646. doi: 10.1037/0033-295X.110.4.611. [DOI] [PubMed] [Google Scholar]
- Oberauer K, Suβ H-M, Wilhelm O, Wittmann WW. The multiple faces of working memory: Storage, processing, supervision, and coordination. Intelligence. 2003;31:167–193. [Google Scholar]
- Old SR, Naveh-Benjamin M. Differential effects of aging on item and associative measures of memory: A meta-analysis. Psychology and Aging. 2008;23:104–118. doi: 10.1037/0882-7974.23.1.104. [DOI] [PubMed] [Google Scholar]
- Papassotiropoulous A, et al. Common Kibra Alleles Are Associated with Human Memory Performance. Science. 2006;314:475–478. doi: 10.1126/science.1129837. [DOI] [PubMed] [Google Scholar]
- Rabbitt P, Chetwynd A, McInnes L. Do clever brains age more slowly? Further exploration of a nun result. British Journal of Psychology. 2003;94:63–71. doi: 10.1348/000712603762842101. [DOI] [PubMed] [Google Scholar]
- Rabinowitz JC. Aging and recognition failure. Journal of Gerontology. 1984;39:65–71. doi: 10.1093/geronj/39.1.65. [DOI] [PubMed] [Google Scholar]
- Radloff LS. The CES-D Scale: A self-report depression scale for research in the general population. Applied Psychological Measurement. 1977;1:385–401. [Google Scholar]
- Ratcliff R. A theory of memory retrieval. Psychological Review. 1978;85:59–108. [Google Scholar]
- Ratcliff R. A theory of order relations in perceptual matching. Psychological Review. 1981;88:552–572. [Google Scholar]
- Ratcliff R. Connectionist Models of Recognition Memory: Constraints Imposed by Learning and Forgetting Functions. Psychological Review. 1990;97:285–308. doi: 10.1037/0033-295x.97.2.285. [DOI] [PubMed] [Google Scholar]
- Ratcliff R. A diffusion model account of reaction time and accuracy in a two choice brightness discrimination task: Fitting real data and failing to fit fake but plausible data. Psychonomic Bulletin and Review. 2002;9:278–291. doi: 10.3758/bf03196283. [DOI] [PubMed] [Google Scholar]
- Ratcliff R. Modeling aging effects on two-choice tasks: response signal and response time data. Psychology and Aging. 2008;23:900–916. doi: 10.1037/a0013930. [DOI] [PMC free article] [PubMed] [Google Scholar]
- Ratcliff R. The EZ diffusion method: Too EZ? Psychonomic Bulletin and Review. 2008b;15:1218–1228. doi: 10.3758/PBR.15.6.1218. [DOI] [PMC free article] [PubMed] [Google Scholar]
- Ratcliff R, Clark SE, Shiffrin RM. The list-strength effect: I. Data and discussion. Journal of Experimental Psychology: Learning, Memory, and Cognition. 1990;16:163–178. [PubMed] [Google Scholar]
- Ratcliff R, Love J, Thompson CA, Opfer J. Children are not like older adults: A diffusion model analysis of developmental changes in speeded responses. Child Development. doi: 10.1111/j.1467-8624.2011.01683.x. in press. [DOI] [PMC free article] [PubMed] [Google Scholar]
- Ratcliff R, McKoon G. Speed and accuracy in the processing of false statements about semantic information. Journal of Experimental Psychology: Learning, Memory, & Cognition. 1982;8:16–36. [Google Scholar]
- Ratcliff R, McKoon G. Similarity information versus relational information: Differences in the time course of retrieval. Cognitive Psychology. 1989;21:139–155. doi: 10.1016/0010-0285(89)90005-4. [DOI] [PubMed] [Google Scholar]
- Ratcliff R, McKoon G. The diffusion decision model: Theory and data for two-choice decision tasks. Neural Computation. 2008;20:873–922. doi: 10.1162/neco.2008.12-06-420. [DOI] [PMC free article] [PubMed] [Google Scholar]
- Ratcliff R, Murdock BB., Jr Retrieval processes in recognition memory. Psychological Review. 1976;83:190–214. [Google Scholar]
- Ratcliff R, Perea M, Coleangelo A, Buchanan L. A diffusion model account of normal and impaired readers. Brain & Cognition. 2004;55:374–382. doi: 10.1016/j.bandc.2004.02.051. [DOI] [PubMed] [Google Scholar]
- Ratcliff R, Rouder JN. A diffusion model account of masking in letter identification. Journal of Experimental Psychology: Human Perception and Performance. 2000;26:127–140. doi: 10.1037//0096-1523.26.1.127. [DOI] [PubMed] [Google Scholar]
- Ratcliff R, Schmiedek F, McKoon G. A diffusion model explanation of the worst performance rule for reaction time and IQ. Intelligence. 2008;36:10–17. doi: 10.1016/j.intell.2006.12.002. [DOI] [PMC free article] [PubMed] [Google Scholar]
- Ratcliff R, Starns JJ. Modeling confidence and response time in recognition memory. Psychological Review. 2009;116:59–83. doi: 10.1037/a0014086. [DOI] [PMC free article] [PubMed] [Google Scholar]
- Ratcliff R, Thapar A, Gomez P, McKoon G. A diffusion model analysis of the effects of aging in the lexical-decision task. Psychology and Aging. 2004;19:278–289. doi: 10.1037/0882-7974.19.2.278. [DOI] [PMC free article] [PubMed] [Google Scholar]
- Ratcliff R, Thapar A, McKoon G. The effects of aging on reaction time in a signal detection task. Psychology and Aging. 2001;16:323–341. [PubMed] [Google Scholar]
- Ratcliff R, Thapar A, McKoon G. A diffusion model analysis of the effects of aging on brightness discrimination. Perception and Psychophysics. 2003;65:523–535. doi: 10.3758/bf03194580. [DOI] [PMC free article] [PubMed] [Google Scholar]
- Ratcliff R, Thapar A, McKoon G. A diffusion model analysis of the effects of aging on recognition memory. Journal of Memory and Language. 2004;50:408–424. [Google Scholar]
- Ratcliff R, Thapar A, McKoon G. Aging and individual differences in rapid two- choice decisions. Psychonomic Bulletin and Review. 2006a;13:626–635. doi: 10.3758/bf03193973. [DOI] [PMC free article] [PubMed] [Google Scholar]
- Ratcliff R, Thapar A, McKoon G. Aging, practice, and perceptual tasks: A diffusion model analysis. Psychology and Aging. 2006b;21:353–371. doi: 10.1037/0882-7974.21.2.353. [DOI] [PMC free article] [PubMed] [Google Scholar]
- Ratcliff R, Thapar A, McKoon G. Application of the diffusion model to two-choice tasks for adults 75-90 years old. Psychology and Aging. 2007;22:56–66. doi: 10.1037/0882-7974.22.1.56. [DOI] [PMC free article] [PubMed] [Google Scholar]
- Ratcliff R, Thapar A, McKoon G. Individual differences, aging, and IQ in two-choice tasks. Cognitive Psychology. 2010;60:127–157. doi: 10.1016/j.cogpsych.2009.09.001. [DOI] [PMC free article] [PubMed] [Google Scholar]
- Ratcliff R, Tuerlinckx F. Estimating the parameters of the diffusion model: Approaches to dealing with contaminant reaction times and parameter variability. Psychonomic Bulletin and Review. 2002;9:438–481. doi: 10.3758/bf03196302. [DOI] [PMC free article] [PubMed] [Google Scholar]
- Ratcliff R, Van Dongen HPA. Sleep deprivation affects multiple distinct cognitive processes. Psychonomic Bulletin and Review. 2009;16:742–751. doi: 10.3758/PBR.16.4.742. [DOI] [PMC free article] [PubMed] [Google Scholar]
- Ratcliff R, Van Zandt T, McKoon G. Process dissociation, single process theories, and recognition memory. Journal of Experimental Psychology: General. 1995;124:352–374. doi: 10.1037//0096-3445.124.4.352. [DOI] [PubMed] [Google Scholar]
- Ratcliff R, Van Zandt T, McKoon G. Connectionist and diffusion models of reaction time. Psychological Review. 1999;106:261–300. doi: 10.1037/0033-295x.106.2.261. [DOI] [PubMed] [Google Scholar]
- Reder LM, Nhouyvanisvong A, Schunn CD, Ayers MS, Angstadt P, Hiraki K. A mechanistic account of the mirror effect for word frequency: A computational model of remember-know judgments in a continuous recognition paradigm. Journal of Experimental Psychology: Learning, Memory, and Cognition. 2000;26:294–320. doi: 10.1037//0278-7393.26.2.294. [DOI] [PubMed] [Google Scholar]
- Rotello CM, Macmillan NA, Reeder JA. Sum-Difference Theory of Remembering and Knowing: A Two-Dimensional Signal-Detection Model. Psychological Review. 2004;111:588–616. doi: 10.1037/0033-295X.111.3.588. [DOI] [PubMed] [Google Scholar]
- Rugg MD. Memory and consciousness: a selective review of issues and data. Neuropsychologia. 1995;33:1131–41. doi: 10.1016/0028-3932(95)00053-6. [DOI] [PubMed] [Google Scholar]
- Rugg MD, Curran T. Event-related potentials and recognition memory. Trends in Cognitive Sciences. 2007;11:251–257. doi: 10.1016/j.tics.2007.04.004. [DOI] [PubMed] [Google Scholar]
- Salthouse TA. Why do adult age differences increase with task complexity? Developmental Psychology. 1992;28:905–918. [Google Scholar]
- Schaper K, Kolsch H, Popp J, Wagner M, Jessen F. KIBRA gene variants are associated with episodic memory in healthy elderly. Neurobiology of Aging. 2008;29:1123–1125. doi: 10.1016/j.neurobiolaging.2007.02.001. [DOI] [PubMed] [Google Scholar]
- Schmiedek F, Oberauer K, Wilhelm O, Suβ H-M, Wittmann W. Individual differences in components of reaction time distributions and their relations to working memory and intelligence. Journal of Experimental Psychology: General. 2007;136:414–429. doi: 10.1037/0096-3445.136.3.414. [DOI] [PubMed] [Google Scholar]
- Schonfield AED, Robertson BA. Memory storage and aging. Canadian Journal of Psychology. 1966;20:228–236. doi: 10.1037/h0082941. [DOI] [PubMed] [Google Scholar]
- Shiffrin RM, Steyvers M. A model for recognition memory: REM: Retrieving effectively from memory. Psychonomic Bulletin and Review. 1997;4:145–166. doi: 10.3758/BF03209391. [DOI] [PubMed] [Google Scholar]
- Singer T, Verhaeghen P, Ghisletta P, Lindenberger U, Baltes PB. The fate of cognition in very old age: Six-year longitudinal findings in the Berlin Aging Study (BASE) Psychology and Aging. 2003;18:318–331. doi: 10.1037/0882-7974.18.2.318. [DOI] [PubMed] [Google Scholar]
- Spaniol J, Madden DJ, Voss A. A diffusion model analysis of adult age differences in episodic and semantic long-term memory retrieval. Journal of Experimental Psychology: Learning, Memory, and Cognition. 2006;32:101–117. doi: 10.1037/0278-7393.32.1.101. [DOI] [PMC free article] [PubMed] [Google Scholar]
- Spencer WD, Raz N. Effects of aging on memory for content and context: A meta- analysis. Psychology and Aging. 1995;10:527–539. doi: 10.1037//0882-7974.10.4.527. [DOI] [PubMed] [Google Scholar]
- Starns JJ, Ratcliff R. Two dimensions are not better than one: STREAK and the univariate signal detection model of remember/know performance. Journal of Memory and Language. 2008;59:169–182. doi: 10.1016/j.jml.2008.04.003. [DOI] [PMC free article] [PubMed] [Google Scholar]
- Starns JJ, Ratcliff R. The effects of aging on the speed-accuracy compromise: Boundary optimality in the diffusion model. Psychology and Aging. 2010;5:377–390. doi: 10.1037/a0018022. [DOI] [PMC free article] [PubMed] [Google Scholar]
- Starns JJ, Ratcliff R, McKoon G. Adding response times to models of recognition memory receiver operating characteristics (ROCs): RTCON and the diffusion model. submitted. [Google Scholar]
- Thapar A, Petrill SA, Thompson LA. The heritability of memory in the Western Reserve Twin Project. Behavior Genetics. 1994;24:155–160. doi: 10.1007/BF01067819. [DOI] [PubMed] [Google Scholar]
- Thapar A, Ratcliff R, McKoon G. A diffusion model analysis of the effects of aging on letter discrimination. Psychology and Aging. 2003;18:415–429. doi: 10.1037/0882-7974.18.3.415. [DOI] [PMC free article] [PubMed] [Google Scholar]
- Thompson LA, Detterman DK, Plomin R. Associations between cognitive abilities and scholastic achievement: Genetic overlap but environmental differences. Psychological Science. 1991;2:158–165. [Google Scholar]
- Unsworth N. On the division of working memory and long-term memory and their relation to intelligence: A latent variable approach. Acta Psychologica. 2010;134:16–28. doi: 10.1016/j.actpsy.2009.11.010. [DOI] [PubMed] [Google Scholar]
- Unsworth N. On the division of working memory and long-term memory and their relation to intelligence: A latent variable approach. Acta Psychologica. 2010;134:16–28. doi: 10.1016/j.actpsy.2009.11.010. [DOI] [PubMed] [Google Scholar]
- Voss A, Rothermund K, Voss J. Interpreting the parameters of the diffusion model: An empirical validation. Memory and Cognition. 2004;32:1206–1220. doi: 10.3758/bf03196893. [DOI] [PubMed] [Google Scholar]
- Wagenmakers E-J, Van Der Maas HLJ, Grassman RPPP. An EZ-diffusion model for response time and accuracy. Psychonomic Bulletin and Review. 2007;14:3–22. doi: 10.3758/bf03194023. [DOI] [PubMed] [Google Scholar]
- Wagner AD, Shannon BJ, Kahn I, Buckner RL. Parietal lobe contributions to episodic memory retrieval. Trends in Cognitive Science. 2005;9:445–453. doi: 10.1016/j.tics.2005.07.001. [DOI] [PubMed] [Google Scholar]
- Wahlin A, Backman L, Winblad B. Free recall and recognition of slowly and rapidly presented words in very old age: A community-based study. Experimental Aging Research. 1995;21:251–271. doi: 10.1080/03610739508253984. [DOI] [PubMed] [Google Scholar]
- Wechsler D. The Wechsler Adult Intelligence Scale III. San Antonio, CA: Psychological Corporation, Harcourt Brace; 1997. [Google Scholar]
- White C, Ratcliff R, Vasey M, McKoon G. Dysphoria and memory for emotional material: A diffusion model analysis. Cognition and Emotion. 2009;23:181–205. doi: 10.1080/02699930801976770. [DOI] [PMC free article] [PubMed] [Google Scholar]
- White CN, Ratcliff R, Vasey MW, McKoon G. Using diffusion models to understand clinical disorders. Journal of Mathematical Psychology. 2010a;54:39–52. doi: 10.1016/j.jmp.2010.01.004. [DOI] [PMC free article] [PubMed] [Google Scholar]
- White CN, Ratcliff R, Vasey MW, McKoon G. Anxiety enhances threat processing without competition among multiple inputs: A diffusion model analysis. Emotion. 2010b;10:662–677. doi: 10.1037/a0019474. [DOI] [PubMed] [Google Scholar]
- Wixted JT. Dual-process theory and signal-detection theory of recognition memory. Psychological Review. 2007;114:152–176. doi: 10.1037/0033-295X.114.1.152. [DOI] [PubMed] [Google Scholar]
- Wixted JT, Stretch V. In defense of the signal-detection interpretation of remember/ know judgments. Psychonomic Bulletin & Review. 2004;11:616–641. doi: 10.3758/bf03196616. [DOI] [PubMed] [Google Scholar]
- Yonelinas AP. Receiver-operating characteristics in recognition memory: Evidence for a dual-process model. Journal of Experimental Psychology: Learning, Memory, and Cognition. 1994;20:1341–1354. doi: 10.1037//0278-7393.20.6.1341. [DOI] [PubMed] [Google Scholar]
- Yonelinas AP. Recognition memory ROCs for item and associative information: The contribution of recollection and familiarity. Memory & Cognition. 1997;25:747–763. doi: 10.3758/bf03211318. [DOI] [PubMed] [Google Scholar]
- Yovel G, Paller KA. The neural basis of the butcher on the bus phenomenon: When a face seems familiar but is not remembered. NeuroImage. 2004;21:789–800. doi: 10.1016/j.neuroimage.2003.09.034. [DOI] [PubMed] [Google Scholar]