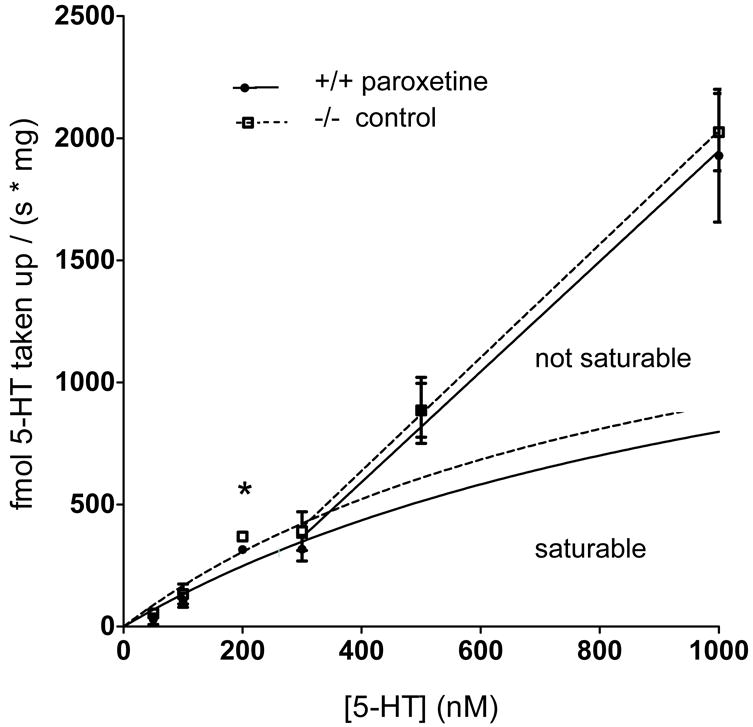
Fig. 3.

Non-SERT uptake velocities in paroxetine-treated wildtype synaptosomes (closed circle, solid lines) and SERT knockout synaptosomes (open square, dotted lines). This data is also presented in Figure 1 (A-F), but shown here as a [substrate] vs. velocity plot. Uptake was increased in SERT knockout synaptosomes at added 5-HT concentrations of 300 nM and lower, with a significantly enhanced uptake velocity when 200 nM was added (n=5, p=0.0470) as determined by t-test comparison. Error bars fall within the dimensions of the symbols at 200 nM. The Michaelis–Menten equation cannot be fitted to the entire data set. Michaelis–Menten curves were fitted from 0 – 300 nM 5-HT, the region of the data that reflects saturable processes. The following kinetic constants were calculated for paroxetine-treated wildtype synaptosomes for non-SERT uptake: Km = 1029 ± 1663 nM 5-HT; Vmax = 1530 ± 2007 fmol / (s × mg). The kinetic constants for clearance in SERT knockout synaptosomes were: Km = 1087 ± 1843 nM 5-HT; Vmax = 1962 ± 2741 fmol / (s × mg). A line was fitted for the data from 300 nM – 1 μM, the region of the data that reflects non-saturable clearance. There was no significant difference in Km or Vmax between genotypes. There was also no difference in the linear slopes between genotypes. Data are expressed as mean ± SEM, *p < 0.05. The significance level was set at p < 0.05.
