

Abstract
Chemical Exchange Saturation Transfer (CEST) is an MRI approach that can indirectly detect exchange broadened protons that are invisible in traditional NMR spectra. We modified the CEST pulse sequence for use on high-resolution spectrometers and developed a quantitative approach for measuring exchange rates based upon CEST spectra. This new methodology was applied to the rapidly exchanging Hδ1 and Hε2 protons of His57 in the catalytic triad of bovine chymotrypsinogen-A (bCT-A). CEST enabled observation of Hε2 at neutral pH values, and also allowed measurement of solvent exchange rates for His57-Hδ1 and His57-Hε2 across a wide pH range (3–10). Hδ1 exchange was only dependent upon the charge state of the His57 (kex,Im+ = 470 s−1, kex,Im = 50 s−1), while Hε2 exchange was found to be catalyzed by hydroxide ion and phosphate base (kOH− = 1.7 × 10¹⁰ M−1s−1, ), reflecting its greater exposure to solute catalysts. Concomitant with the disappearance of the Hε2 signal as the pH was increased above its pKa, was the appearance of a novel signal (δ = 12 ppm), which we assigned to Hγ of the nearby Ser195 nucleophile, that is hydrogen bonded to Nε2 of neutral His57. The chemical shift of Hγ is about 7 ppm downfield from a typical hydroxyl proton, suggesting a highly polarized O-Hγ bond. The significant alkoxide character of Oγ indicates that Ser195 is preactivated for nucleophilic attack before substrate binding. CEST should be generally useful for mechanistic investigations of many enzymes with labile protons involved in active site chemistry.
Keywords: catalytic triad, CEST, chemical exchange, saturation transfer, chymotrypsinogen, fast exchange, serine protease
Introduction
Fast exchanging protons are associated with many functional groups found in biological systems and are often found in the most chemically active and interesting regions of enzymes. One important example is a group of exchanging protons in the catalytic triad of the S1 family of serine proteases (MEROPS nomenclature(Rawlings and Barrett 2010)) (Figure 1a). The S1 family of serine proteases includes some of the most well-known serine proteases, such as chymotrypsin, trypsin, thrombin, neuropsin, and alpha-lytic endopeptidase. These proteases are characterized by the use of a common catalytic triad consisting of an aspartic acid, a histidine and a serine (Asp102, His57, and Ser195 as found in chymotrypsinogen), that function cooperatively to help accelerate peptide bond cleavage by 1010-fold over the non-enzymatic rate (see recent and historical reviews)(Kraut 1977; Hedstrom 2002; Polgar 2005). Although the roles of S1 serine proteases are diverse, including digestion, signaling pathways(Dery et al. 1998), immune response(Heutinck et al. 2010), and neuronal health(Yoshida and Shiosaka 1999), their common catalytic triad is exemplified by the widely characterized enzyme chymotrypsin, and its zymogen precursor, chymotrpysinogen.
Fig. 1.

The catalytic triad of chymotrypsin/ogen and its role in peptide bond hydrolysis. (a) The catalytic triad interactions in free chymotrypsinogen at pH values below (left) and above (right) the pKa of His57-Hε2. The triad consists of a hydrogen bond network that connects the nucleophilic serine, His57 and Asp102. Im+ and Im refer to the imidazolium and imidazole protonation states of His57, respectively. Established hydrogen bonds in the free and acidic and neutral enzyme are indicated by dashed lines. (b) Proposed catalytic mechanism for S1 family peptidyl hydrolases. In this diagram, the scissile peptide bond connects the nth amino acid (AAn), to the n+1’th amino acid (AAn+1)
Both the His57-Hε2 and Ser195-Hγ protons of chymotrypsin play central roles at multiple steps in peptide bond cleavage (Figure 1b) (for a mechanistic review see Hedstrom (Hedstrom 2002)), but their detection and characterization in solution has been difficult or impossible due to their rapid exchange rates with water protons. In the resting enzyme, previous NMR studies using an acyl-enzyme analogue (Robillard and Shulman 1974a) or 15N labeled His57 (Bachovchin 1986) have concluded that Hγ participates in a hydrogen bond with Nε2 of neutral His57. Upon binding of the peptide substrate, Hγ is transferred to Nε2 resulting in an imidazolium ion that is stabilized by a charged hydrogen bond between His57-Hδ1 and Asp102. The shared Hδ1 proton is notable because of its extremely deshielded NMR shift (~18 ppm) (Robillard and Shulman 1974a, b, 1972; Liang and Abeles 1987). The charged state of the triad can be observed in the free state of the enzyme (or in chymotrypsinogen) by lowering the pH, which results in the same highly deshielded proton resonance attributed to Hδ1 (Robillard and Shulman 1972; Liang and Abeles 1987; Markley and Westler 1996). Ser195-Hγ proton transfer also produces the essential nucleophilic alkoxide on Ser195-Oγ that attacks the carbonyl center of the peptide linkage to form the first tetrahedral intermediate. Nucleophilic attack by a catalytic serine is the mechanistic feature that characterizes all serine proteases.
During the subsequent steps of catalysis, His57-Hε2 is directly involved in three acid-base steps: (i) an acid catalysis step involving transfer of Hε2 to the amine leaving group nitrogen of the peptide, forming the acyl-enzyme intermediate, (ii) a base catalysis step involving removal of a proton from the attacking water molecule by Nε2, forming the second tetrahedral intermediate, and finally (iii) transfer of Hε2 to Ser195-Oγ to regenerate the resting enzyme. The highly dynamic nature of the Hε2 and Hγ protons, and their rapid exchange with solvent, create an important challenge for their observation in solution by NMR methods. However, their central roles in multiple steps of catalysis make such efforts highly desirable.
NMR is an important method that has contributed to our understanding of the catalytic triad. However, proton NMR studies have largely been limited to the study of the His57-Hδ1 proton because of its shielding from solvent and/or its involvement in a shared hydrogen bond with Asp102. (For a summary of NMR studies of the triad, the reader is referred to a review by Bachovchin (Bachovchin 2001).) Chemical exchange saturation transfer (CEST) is a relatively new MRI methodology that detects exchange line broadened protons indirectly through the water resonance with enhanced sensitivity(van Zijl and Yadav 2011; Aime et al. 2009; Goffeney et al. 2001; Sherry and Woods 2008; Ward et al. 2000). Accordingly, CEST provides a potentially useful method for the observation of rapidly exchanging amide and hydroxyl proton (Goffeney et al. 2001; McMahon et al. 2006; McMahon et al. 2008) such as His57-Hε2 and Ser195-Hγ, and for the characterization of their physical properties that relate to efficient catalysis. Here we show how CEST enables NMR detection of His57-Hε2 in pH regions where previous methods have failed due to rapid solvent exchange, and also how CEST can be used to measure the pH dependence of the exchange rates for both His57-Hε2 and His57-Hδ1. Using CEST, we also observed for the first time the Hγ proton of Ser195 at neutral and basic pH values. This proton is highly deshielded in the resting enzyme at this pH range due to its hydrogen bond with His57-Nε2, indicating that the Ser195-Oγ is alkoxide-like and preactivated for nucleophilic attack in the free enzyme. CEST should prove to be a generally useful NMR method for elucidating the properties of rapidly exchanging protons in protein and nucleic acid macromolecules.
Theory and models
General CEST Theory
The premise of CEST is based on the principle of magnetization saturation transfer. That is, if a proton located at chemical site A is exchanging with water, then saturation of its magnetization will lead to a decrease in the water signal intensity if site A transfers its saturation to bulk water through a chemical exchange process (Forsén and Hoffman 1963). In this case, site A can be detected indirectly through the water signal. What makes CEST truly unique is this observation of water protons rather than the exchanging proton. Observing water protons provides two key advantages. The first advantage is that detecting water obviates the exchange line broadening problem because water protons are in large excess (55.5 M) compared to biomolecular protons (~ 1 mM) and this excess prevents line broadening of the water signal even when the biomolecular proton is exchange line broadened beyond detection. The second advantage is that a single exchanging site can donate many saturated protons to the water pool during the saturation pulse (~ 1 – 12 s). Since such a site will contribute saturated protons to water according to its exchange rate, CEST becomes a powerful signal amplifier. Signal enhancements between 200–900 fold per chemical site are not uncommon for NH backbone protons (Goffeney et al. 2001; McMahon et al. 2006; McMahon et al. 2008).
The CEST experiment is performed by sweeping the frequency domain with a narrow-band (selective) saturation pulse and recording the resulting water signal intensity at each saturation frequency. The water signal intensity, symbolized by S, is then plotted as a function of saturation frequency, (ν), producing what is typically called a “Z-spectrum” (Grad and Bryant 1990; Bryant 1996). Signal intensity in the Z-spectrum is usually normalized by the full water signal value, So, which is determined from measuring the water signal intensity from a far off-resonance saturation pulse or an experiment collected without a saturation pulse. An elegant refinement of the CEST method (Frequency-Labeled EXchange spectroscopy or FLEX) does not require sweeping of the frequency domain but the work presented here was collected before this more recent development (Friedman et al. 2010).
Cases where the Z-spectral signal, S, is less than unity may indicate the presence of protons that exchange sufficiently fast or are in high enough concentration to affect the water proton signal. In order to convert the signal reduction to a more intuitive positive signal display, the magnetization transfer ratio (MTR), defined as,
| 1 |
is often used. Positive signals in the MTR spectrum may result from (i) direct saturation of water, which occurs when the frequency of the saturation pulse matches the water frequency at any point within the water lineshape, (ii) the presence of an exchanging proton (both directly or indirectly through proton relay pathways) resonating at the corresponding saturation frequency, (iii) or NOE effects that are exchange-relayed to the solvent through nearby OH, NH2, NH or other exchanging groups(Ling et al. 2008; van Zijl and Yadav 2011).
Because the Z-spectrum signal intensity is a function of both the exchange rate and the duration of the exchange experiment (saturation time), CEST can also be used to measure the exchange rates of exchanging protons. Numerical and analytic solutions to the Bloch equations describing a CEST experiment have been solved (Zhou et al. 2004). In a technique called QUEST (QUantifying Exchange rates using Saturation Times), the water signal intensity at a specific saturation frequency is collected as a function of saturation time. For very rapidly exchanging protons, the analytical solutions do not apply and the signal intensities need to be fit with numerical solutions to the Bloch equations to allow extraction of the exchange rate (McMahon et al. 2006).
CEST Spectral Profile Analysis (CSPA) as Applied to the Catalytic Triad of Bovine Chymotrypsinogen-A (bCT-A)
We developed a new analytical method for measuring exchange rates, CEST spectrum profile analysis (CSPA), which employs fitting an entire CEST spectrum at one saturation time to the numerical solution of the Bloch equations for the chemical system under study. This contrasts significantly with the QUEST approach, which fits only the signal at one spectral frequency across multiple saturation times. A clear advantage of CSPA is that multiple signals in a spectrum may contain information on the same exchange rate. For instance, the exchange rate of His57-Hε2 with water affects both the His57-Hδ1 and the His57-Hε2 signals (discussed further below), providing robust constraints for global analysis of the system.
One limitation of any type of multi-rate fitting is that the quality of the fit and the robustness of the measured parameters depend on the number of exchange processes assumed to participate, and the sensitivity of the data to the exchange model parameters. A Z-spectrum will be modeled most simply (least number of fitted exchange rate constants) by assuming a single direct exchange pathway to water for each observed signal and no inter-proton exchange terms. Known additional exchange processes that occur before reaching water (e.g. exchange-relay pathways) may intentionally be removed from the CSPA model if their effect on the Z-spectrum is too minor to robustly fit the additional exchange parameters. For example, simulations as well as experimental observations (Ser 195-Hγ section below) reveal that a relay involving a slow transfer step to another site that is in rapid exchange with solvent is indistinguishable in a Z-spectrum from the direct exchange pathway. Applying Ocaam’s razor to this case, only direct exchange terms would be included in the model and the effect of the exchange relay pathways would be hidden in the single exchange rate assumed. In this case, exchange rate should be seen as an apparent direct rate.
In the present application, previous knowledge of the catalytic triad aides in identifying exchange intermediates and identifying conditions under which exchange terms can be reduced. The three protons His57-Hε2, His57-Hδ1, and Ser195-Hγ, are divided into two exchange systems that we refer to as “Hδ1” and “Hε2/Hγ” (Figure 2). Each exchange system contains direct exchange terms as well as pathways involving exchange intermediates. The Hδ1 exchange system takes into account the two distinct chemical shifts for Hδ1 depending on the protonation state of His57 (Im+ and Im in Figure 1a). The Hε2/Hγ exchange system includes exchange of Hε2 and Hγ with water, as well as possible proton exchange between the Hε2 and Hγ sites. The division into two exchange systems simplifies the Bloch equations used to model the three proton exchange system and removes the mathematical need to include biologically needless parameters (such as a term for exchange between Hδ1 and Hε2). Starting from this model, three more simplifications can be made.
Fig. 2.
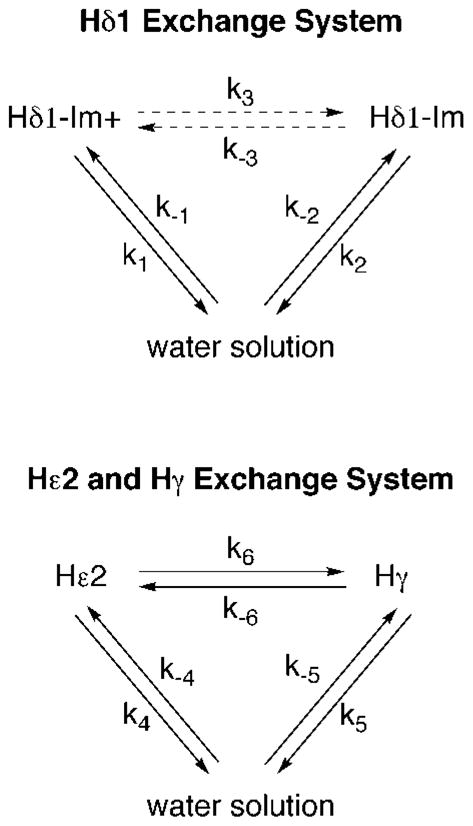
The two system exchange model for His57-Hγ, His57-Hε2, and Ser195-Hγ. Exchange between Hδ1-Im+ and Hδ1-Im is represented by a dashed arrow to reflect that this reaction is not a proton transfer reaction. The exchange events are represented schematically and not by balanced chemical equations in order to avoid complexities from numerating pathways that CEST cannot distinguish. For example, k6, exchange from Hε2 to Hγ, represents any direct pathway in which Hε2 becomes an Hγ proton attached to Oγ of Ser195. This includes the possibility of exchange to the alkoxide Oγ− forming OHγ as well as exchange to OHγ forming the transitory OHHγ+
First, a reduction in exchange parameters is made by observing that there exists an important exchange link between the two systems. The relative populations and chemical shift averaging of Hδ1-Im+ and Hδ1-Im is controlled by the exchange events of Hε2. The connection between Hε2 exchange and the charged state of His57-Hδ1 can clearly be seen in Figure 1a. The net exchange rate of a proton from the His57-Hε2 site to an acceptor, k6 + k4, controls the rate at which Hδ1-Im+ converts to Hδ1-Im. Similarly, the net exchange rate of a proton from a proton donor to the His57-Hε2 site, k−4 + k−6, controls the rate at which Hδ1-Im converts to Hδ1-Im+. The rate constants k3 and k−3 can therefore be defined explicitly in terms of the exchange rate constants describing the formation and decay of His57-Hε2 (eqs 2 and 3).
| 2 |
| 3 |
Second, the known pKa for the system provides a means of reducing the number of exchange rate parameters by identifying pH values for which certain parameters are unnecessary. For pH values much smaller than the pKa, exchange terms associated with protons in the imidazole state (e.g. k2 and k3) can be set to 0 during the fitting routine, while for pH values much larger than pKa the exchange terms associated with protons in the imidazolium state (e.g. k1, k3, k4, k6) can be set to 0. Therefore only for pH values where pH ~ pKa do all the terms need to be included.
The third method of reducing the number of fitted exchange rate constants comes from observing that a reverse exchange rate can be calculated from the corresponding forward exchange rate and equilibrium ratio according (eq 4).
| 4 |
For k−1, k−2, k−4, and k−5, Y represents the water proton concentration (110 M) and X represents the concentration of Hδ1-Im+, Hδ1-Im, Hε2, and Hγ respectively. For k−6, X represents Hε2 and Y represents Hγ. Note that to use eq 4, the protein concentration as well as the pKa of the system must be known a priori in order to determine the concentration of the exchanging protons.
Generally, CSPA measured exchange rate constants can be directly compared to exchange rates measured by NMR linewidth analysis and QUEST. However, CSPA is unique from the NMR linewidth and QUEST approaches in that it relies on a global model for measuring exchange rates. Care must be taken when comparing exchange rate measurements of signal averaged protons, as is the case with His57-Hδ1. In traditional NMR spectra, the chemical exchange rate between Hδ1-Im+ and Hδ1-Im (k3 and k−3, Figure 2) is rapid enough to result in signal averaging. The NMR linewidth measurement of the single Hδ1 signal reflects a combination of both k1 and k2 and is not directly comparable to the isolated k1 or k2 as measured by CSPA. Similarly, if Hδ1-Im+ and Hδ1-Im are signal averaged in a Z-spectrum (k3 and k−3 are faster than the saturation and transfer rate), then QUEST will measure a single exchange rate that is a combination of the k1 and k2 exchange terms. This comparison problem can be solved by combining the CSPA measured k1 and k2 terms into a population-weighted average exchange rate constant, kHδ1 (eq 5).
| 5 |
Like k1 and k2, kHδ1 is a first order rate constant with units of s−1 and reflects the inverse average lifetime of Hδ1 regardless of the charged state of His57. Note that the use of eq 5 does not assume pH independence for k1, k2, or kHδ1.
Results and Discussion
CEST NMR method applied to bCT-A
Our selection of bCT-A for study was based on the abundance of data available for this protein and that the catalytic triad of bCT-A has been shown to be structurally (Freer et al. 1970; Wang et al. 1985) and functionally (Morgan et al. 1972; Lonsdale-Eccles et al. 1978; Kerr et al. 1975) identical to the active serine protease chymotrypsin. In addition, previous 1H-NMR studies of bCT-A at acidic and basic pH values have provided useful mechanistic insights into the catalytic triad at different stages of catalysis (Markley and Westler 1996; Robillard and Shulman 1972, 1974a, b; Liang and Abeles 1987). Under acidic conditions, when His57 is in the imidazolium state, the observed interactions are considered to reflect those in the triad during the steps of catalysis when His57 is in the imidazolium form (Figure 1). Under basic conditions, when His57 is in the imidazole state, the observed interactions are considered to reflect the triad at the very start of catalysis, after the substrate has bound, but before the substrate has been attacked by the serine nucleophile. Given the important mechanistic content of pH dependent spectra, we performed CEST experiments over the pH range 3 – 10 and extracted the exchange rates of the observed protons using CSPA, and for validation, the more standard method QUEST.
Acquiring and processing CEST Z-spectra of bCT-A
Initial NMR experiments on chymotrypsinogen using a standard CEST pulse sequence (Figure S1, Supplementary Material) yielded a noisy Z-spectrum (Figure S1, Supplementary Materials). The free induction decay of the water signal in these experiments showed typical signs of radiation damping effects which persisted with both simple excite-detect and spin-echo detection CEST pulse sequences. Radiation damping was therefore hypothesized to be the cause of the noisy Z-spectrum and we therefore modified the CEST pulse sequence to include gradient echo readout (Figure 3a). The sequence consists of a crusher dephase-rephase gradient pair (G1), a readout gradient (G3), and a pre-acquisition de-phase gradient (G2). The readout gradient effectively removes radiation damping by attenuating the water signal throughout the echo except for the brief time period across the top of the echo. The G1 crusher pair removes radiation damping during the echo time TE. A simple excite-detect sequence can also be used, as long as it is in combination with readout gradients. However, in order to have the water signal in phase, we recommend a short spin echo with gradient coherence selection and gradient echo detection.
Fig. 3.

Collection of Z-spectra. (a) CEST pulse sequence with gradient echo detection. Note that time and intensity ratios are not to scale, the sequence is only for schematic explanation. A weak and long saturation pulse (usually 2 – 5 μT, 1 – 10 s) follows the scan predelay t1. High powered pulses are indicated by tall vertical bars with flip angles written above the bars in degrees. The receiver is opened immediately at the start of G3. For all experiments: all gradients along z-direction, G1 = (1 ms, 19 G/cm), G2 = (1 ms, −4 G/cm), G3 = (2 ms, 4 G/cm), TE/2 = 2 ms, acquisition time = 2 ms, SW = 100,000 Hz. (b) Z-spectrum of chymotrypsinogen-A collected using the pulse sequence from (a). Detectable peaks can be identified in the region of interest (downfield insert). The same sample produced no detectable signals when using a traditional CEST pulse sequence without readout gradients (upfield insert). The two inserts are displayed at identical scales. Sample: 2 mM chymotrypsinogen-A, pH 5.5, 20 °C, unbuffered solution (see Experimental). Collection: saturation pulse = 2.3 μT (100 Hz), 10 s, t1 = 20 s, collected as f (ν), one transient per point, collected at 100 Hz intervals, 201 total points with one transient per point, experimental time = 104 min.
The gradient echo modification allowed collection of a smooth Z-spectrum, with the observation of two previously assigned peaks of bCT-A belonging to His57-Hε2 and His57-Hδ1 at 13 and 18 ppm respectively(Markley and Westler 1996) (Figure 3b). The largest peak in the Z-spectrum (~5 ppm) is from direct saturation of water, and the second largest peak (~8 ppm) results primarily from a large number of rapidly exchanging NH backbone protons. Some signals found upfield from water are attributed to exchange-relayed NOEs. Notably, the Z-spectrum in Figure 3b was collected at pH 5.5 and 20 °C, which is the highest reported temperature/pH combination at which Hε2 has been detected by NMR spectroscopy. A key requirement for the acquisition of high quality CEST spectra is to optimize the saturation power and time to maximize the signals of interest under the given experimental conditions. In the experiment shown in Figure 3b, our compromise was a modest saturation power (2.6 μT, 110 Hz) that emphasized resolution of the Hε2 signal from the backbone NH signals. At higher saturation powers the direct saturation linewidth broadens, which may (partially) obscure the CEST effects.
After collecting raw Z-spectra, a method for isolating the Hδ1 and Hε2 signal was needed. To do this, baseline fitting was used to estimate MTR (eq 1) from sources other than Hδ1 and Hε2 exchange; (i) direct saturation of water, (ii) other exchanging protons (such as NH backbone protons), and (iii) NOEs. To determine the baseline, Z-spectrum data points were first assigned as ‘baseline’ or ‘signal’ by a custom-written peak detection algorithm (available upon request). An artificial baseline was then fit to the baseline assigned points (Figure 4a). All Z-spectrum points were subtracted from the constructed baseline, forming a new MTR spectrum with positive peaks (Figure 4b). The MTR spectrum resulting from this method of baseline correction is referred to as the MTRbc spectrum and is reported here in percent.
Fig. 4.

Baseline fitting of a Z-spectrum to create an MTRbc spectrum. Baseline fits were used to isolate the peaks of interest. (a) An example baseline, polynomial order 6 (p6), is shown (dashed line) together with the downfield region of the Z-spectrum. (b) The MTRbc spectrum formed by subtracting the Z-spectrum in ‘a’ from the p6 baseline. Sample: 1.22 mM bCT-A, pH 5.5, 4 °C, buffered solution (see Experimental). Collection: saturation pulse = 3.5 μT (150 Hz), 6 s, t1 = 18 s, collected as f(ν), collected at 75 Hz intervals, 67 total points were collected with one transient per point, total collection time = 27 min. Notice that the signal measured is close to 1% of the water signal, corresponding to about 1 M concentration and thus a signal enhancement by a factor of about 80
| 6 |
In order to sample the range of possible MTRbc spectra that were compatible with the data, several different baselines were fit to each Z-spectrum, generating nine to ten MTRbc spectra per Z-spectrum. These baselines were constructed by using manual assignments (guided by the algorithm assignments) for the Z-spectrum data points to ‘baseline’ or ‘signal’ and various functions to create the baseline. Because the baseline fitting process is generally the greatest source of error when observing such broad signals, the nine to ten MTRbc spectra were used in error analysis. Unless stated otherwise, reported errors reflect the full range of values observed from analysis of the multiple MTRbc spectra created for each Z-spectrum. Multiple baseline fitting was not used for QUEST data owing to the size of the data set. Further details can be found in the Methods and materials section.
pH dependent CEST spectra of bCT-A
Using the modified pulse sequence and baseline fitting, MTRbc spectra of the downfield region (10 – 20 ppm) of bCT-A were collected at 15 pH values over the range pH 3 – 10. An exchange rate analysis by CSPA was performed on each spectrum using the two-system exchange model shown in Figure 2. The resulting fits (Figure 5a, red curves) can be compared to the observed MTRbc spectra (Figure 5a, black curves). For control comparisons with the new CSPA approach, standard QUEST exchange rate measurements were taken at pH values 3.4, 5.5, and twice at pH 8.1 (an example of QUEST using pH 3.4 is shown in Figure S2, Supplementary Material). A table summarizing the measured exchange rates from both methods is provided in Supplementary Material (Table S1). Assignments, discussed below, are as follows, His57-Hδ1 (15 – 18 ppm), Ser195-Hε2 (13 ppm, pH ~< 7.0), and Ser195-Hγ (12 ppm, pH >~7.0).
Fig. 5.

(a) pH titration of MTRbc spectra for chymotrypsinogen-A (black) and the CSPA analysis fits (red). Each MTRbc spectrum and CSPA analysis fit shown is the average of the ten MTRbc spectra processed for each pH value and the averaged corresponding fit. The asterisk indicates that the pH 5.5 spectrum was collected at 3.5 μT (150 Hz) power as opposed to 2.6 μT (110 Hz) for all other spectra shown. (b) Chemical shift titration curves of observed signals in the MTRbc spectra. The chemical shifts shown at each pH are the average measured chemical shifts from the multiple MTRbc spectra at each pH. Hδ1 chemical shift data were fit using the Henderson-Hasselbalch equation in order to measure the pKa of His57 (black curve). (c) Hδ1 exchange rate constant, kHδ1, measured by QUEST (triangles) and CSPA (circles and bars). The circles represent the median exchange rate value measured by CSPA, while the bars represent the spread of observed values from the multiple MTRbc spectra. Exchange rates measured by the two methods were combined to fit the pKa, k1, and k2 (held as constants) using eq 5 (black curve)
When visually interpreting the CEST spectra in Figure 5a, it should be stressed that the origin of peak intensities and linewidths in CEST-spectra is very different from normal NMR spectra. First, the peak intensities are affected by the exchange rates of proton transfer to water such that increased signal intensities generally correspond to increased exchange rates. For example, in Figure 5a, the constant peak intensity of His57-Hδ1for pH < 7.0, suggests a constant exchange rate while the decrease in the peak signal intensity above pH 7.0 suggests a likely decrease in the exchange rate. Similarly, the rapid increase in the peak intensity of Hε2 between pH 3 – 5.5, suggests an increase in the Hε2 exchange rate.
Second, the linewidths of signals in a saturation spectra generally do not depend on the direct proton exchange rate to water but primarily on the power of the saturation field (B1), as well as the saturation time duration (tsat), and the T2 and T1 (of water and the exchanging proton)(Mulkern and Williams 1993). Although the effect of exchange on a signal’s linewidth is generally masked by the contribution from the B1 field, as exchange rates keep increasing their effects on the linewidth will become apparent. More powerful B1 fields result in broader linewidths and a faster exchange rate is needed to show any significant effect. Computer simulations reveal that for B1 = 2.6 μT and tsat = 6 s (parameters for most of the spectra shown here), the tipping point to see exchange effects is k ~ 1000 s−1, with strong sensitivity to k firmly established by 2500 s−1. The linewidth of peaks with k < 1000 s−1 is simulated to be between 250 – 350 Hz. In Figure 5a, for example, the increasing signal intensity of Hδ1 from pH 3 – 6, suggests an increasing exchange rate, but the similar linewidth of the peak for pH 3 – 5 suggests the exchange rate of Hε2 is less than 1000 s−1 at these pH values. These qualitative observations will be validated with the quantitative analysis below. Unlike direct exchange, exchange involving proton relay pathways can have a significant effect on the linewidth of signals in saturation spectra. Line broadening, peak shifting, and chemical shift averaging can all occur in saturation spectra as a result of inter-proton exchange. These effects are not limited by the direct exchange visibility tipping point, but are certainly affected by the significant role B1 plays in determining overall peak shape.
The following results and discussion of the spectra and exchange rate data are divided into three sections based upon the three observed protons, His57-Hδ1, His57-Hε2, and Ser195-Hγ.
His57-Hδ1
Valuable internal controls to validate the CEST methodology were provided by the previously assigned NMR signals for His57-Hδ1 at low and high pH values, and the known pH dependence of the chemical shift for this resonance. CEST easily detected the His57-Hδ1 signal of bCT-A over a broad pH range (pH 3 – 10, Figure 5a), and the pH dependence of its chemical shift yielded a pKa = 7.6 ± 0.1 that is in excellent agreement with literature values under similar conditions (Figure 5b)(Robillard and Shulman 1974a; Markley and Ibanez 1978). The limiting chemical shifts of Hδ1 in the low and high pH regimes (18 ppm and 15 ppm, respectively) also agree well with literature reports. Based on these comparisons, we concluded that the CEST experiment was yielding reliable NMR data on the catalytic triad of the bCT-A sample.
We were then interested in using CSPA to interrogate the pH dependence of the solvent exchange rate of Hδ1. The solvent exchange rate provides valuable information on the accessibility of Hδ1 to solutes, its chemical environment, and the dynamics of its hydrogen bond with Asp102 (Figure 1a). Before undertaking the analysis we noted that Hδ1 is observed as a single peak at all pH values in Figure 5a, and eq 5 can be used to calculate an average observed exchange rate at each pH value, kHδ1.
The exchange rate measurements of Hδ1 using CSPA reveal that exchange is not catalyzed by hydroxide ion over the entire pH range investigated (pH 3 – 10). Instead, it is solely controlled by the charged state of His57 (Figure 5c). In addition, control experiments established that exchange of Hδ1 is not catalyzed by phosphate buffer (Figure S4). As such, the pH dependence of kHδ1 was fit to eq 5 by holding k1 and k2 as pH independent constants (Figure 5c, black curve). At pH values below the pKa of Hε2, kHδ1 was constant with a limiting value corresponding to k1 = 500 ± 40 s−1 (Table 1). As the pH approaches the pKa of Hε2, kHδ1 decreases in a sigmoidal fashion with a pKapp = 7.4 ± 0.4 that mirrors the pKa of Hε2 measured from the pH dependence of the Hδ1 chemical shift (Figure 5b). At pH values above the pKa of Hε2 the observed rate (kHδ1) approaches a limiting value corresponding to k2 = 50 ± 80 s−1. It should be noted that the reduced signal intensity of Hδ1 in Figure 5a at high pH values is not due to exchange line broadening, but instead, is due to the adverse effect of the reduced exchange on the signal amplification component of CEST. We conclude that the pH dependence of kHδ1 is most simply accounted for by the titration of Hε2 (pKa = 7.6), resulting in a more acidic and labile Hδ1 proton at low pH values.
Table 1.
Rate constants for His57-Hδ1 and His57-Hε2 exchange catalyzed by water, phosphate dianion, and hydroxide ion (4 °C).
| His57-Hδ1
|
|
|---|---|
| k1 (s−1) | 500 ± 40 a |
| k2 (s−1) | 50 ± 80 |
| pKa | 7.4 ± 0.4
|
| His57-Hε2
|
|
| kH2O (s−1) | 100 ± 75 |
| log10 kOH− (s−1) | 10.23 ± .28 b |
| log10 kHPO42− (s−1) | 6.22 ± .78 b |
ranges represent the 95 % confidence intervals calculated for fitted parameters
the log10 values for kOH− and kHPO42− were used to fit the data, and are therefore reported as such here
The absence of kinetic terms for specific base catalysis in the pH dependence for Hδ1 exchange differs significantly from the exchange behavior of free imidazole (pKa ~ 14) and imidazolium (pKa ~ 7). The observed exchange rate at pH 9 (kHδ1 = 50 s−1), is nearly 1000-fold less than the expected rate for diffusion controlled proton abstraction from free imidazole by hydroxide ion, kex ~ kOH−× [OH−] = 4.5 × 10⁴ s−1 (with kOH− = 2.3 × 10¹⁰ (Eigen et al. 1960) and pKw = 14.7 1). This large protection is most likely due to a rate-limiting conformational transition that is required to allow access of hydroxide ion to Hδ1. Less likely is the possibility that the pKa of Hδ1-Im is significantly higher than free imidazole, such that proton transfer to hydroxide ion (pKa ~ 15.7) has become thermodynamically unfavorable.
A quite different mechanistic picture emerges from the observed kHδ1 = 500 s−1 at low pH values, which reflects proton transfer from the Im+ form of His57-Hδ1 to water. This more rapid Hδ1 exchange rate is only 10-fold less than the expected rate for thermodynamically unfavorable proton transfer from Nε2-methylhistidine (pKa = 6.1, (Markley and Westler 1996)) to water (kex ~ 4000 s−1, 2). The decreased protection of Hδ1 to abstraction by water as compared to hydroxide ion may indicate that the suggested conformational transition is pH dependent and becomes more facile at low pH values. More likely, water may have a pathway for accessing this relatively sequestered and nonpolar site that may not be available to an anionic solute such as hydroxide. This view is supported by structural studies that reveal a largely solvated catalytic triad with Hδ1 more sequestered than Hε2 (Freer et al. 1970; Wang et al. 1985). The increased solvent exposure of Hε2 is confirmed by its greater susceptibility to solute catalysts as described in the section below.
The exchange rates for Hδ1 determined from CEST measurements are generally smaller than previously measured exchange rates obtained using NMR linewidth measurements. Although the comparisons are constrained by the fact that previous measurements were made at only a few pH values and at the lower temperature of 1 °C (Markley and Westler 1996), both k1 = 500 s−1 and k2 = 50 s−1 are smaller than the previously reported values of 950 s−1 (pH 3.5), and 3520 s−1 (pH 9.0). The exchange rates at lower pH values may not be in significant discrepancy, however the large discrepancies at high pH values supports an earlier interpretation that attributed pH dependent line broadening to an increase in relaxation rate 1/T2, arising from protein aggregation or pH dependent conformational dynamics (Markley and Ibanez 1978; Tung and Steiner 1974).
The linewidth for Hδ1 in the acidic MTRbc spectra is expected given the power of the B1 field (linewidth ~ 325 Hz). Interestingly, the Hδ1 linewidth broadens by up to ~35 % in the neutral to basic pH range (7 – 8) as compared to the acidic linewidth. This additional broadening is a result of exchange between the protonated and neutral histidines, which are about evenly populated in this pH range. Although this result may be surprising given the very rapid Hε2 exchange rate (below), the validity of this conclusion is supported by the CSPA fit results which successfully reproduce the observed line broadening (Figure S3, Supplementary Material).
His57-Hε2
The CEST pH-titration of His57-Hε2 revealed several previously undetected and mechanistically important aspects of the catalytic triad. CEST clearlytracks the Hε2 resonance over the pH range of 3 – 7 (Figure 5a). At acidic pH (pH ~ 3), Hε2 appears as a broad signal at the previously assigned chemical shift of 13 ppm (Figure 5a) (Markley and Westler 1996). As the pH is raised, its signal increases up to pH 5.5, after which it broadens and shifts upfield in a smooth transition culminating in a new peak at ~ 12 ppm. This new peak persists with further increases in pH. Because the chemical shift transition connecting the low pH Hε2 signal and the new 12 ppm peak at high pH appears smooth and continuous (Figure 5b), it is tempting to assign this transition to the titration of Hε2. However, this is not chemically reasonable because it is not possible to follow the chemical shift of a proton that no longer populates a site. Given the immediate proximity of Ser195-Hγ to His57, and the absence of any other residues in the primary sequence of bCT-A that could be attributed to such a downfield chemical shift, we attribute the new 12 ppm signal to the hydrogen bond between Ser195-Hγ and His57-Nε2 (Figure 1a) 3. The CSPA analysis uses a model of the catalytic triad that includes the titration controlled appearance of the hydrogen bonded form of Hγ (indicated by its 12 ppm chemical shift) with excellent results (Figure 5a, red lines).
Interrogation by CSPA and QUEST of the pH dependence of the Hε2 exchange rate reveals that Hε2, unlike Hδ1, has a strong pH dependence (Figure 6, black points). To analyze buffer contributions to this pH dependence, QUEST and CSPA exchange rate measurements as a function of pH were measured for unbuffered samples as well as for the 14 mM total phosphate buffered samples. Under these conditions the exchange rate for Hε2, k4 (Figure 2), can be expressed using the kinetic terms for catalysis by water, hydroxide ion, and HPO42− (eq 7) (Barksdale and Rosenberg 1982; Gregory et al. 1983).
Fig. 6.
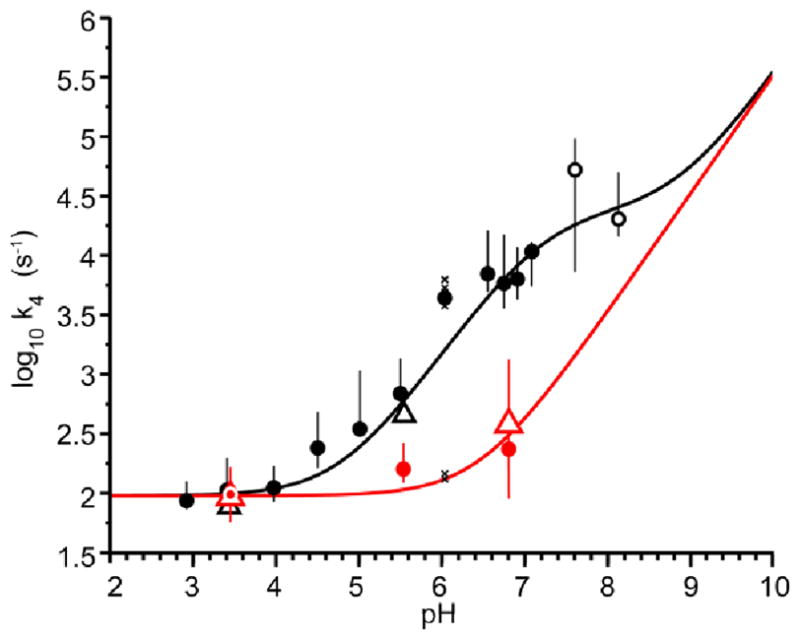
Hε2 exchange rate data for buffered (black) unbuffered (red) samples. Results from QUEST (triangles) and CSPA (circles) were combined together to fit the water, hydroxide, and buffered catalyzed exchange rate constants; kH2O, kOH1, and kHPO42−, from eq 7 (red and black curves). The circles represent the median observed CSPA exchange rate, while the bars represent the full spread of measured values obtained from fitting the multiple MTRbc spectra (9 plus an averaged spectra for each buffered sample and 10 plus and averaged spectra for each unbuffered sample). Displacement of the median value from the center of the bar reflects a skewed distribution. The two open black circles were not included in the fit to eq 7 owing to their larger spread of values. The distribution of the individual exchange rates measured from the 10 MTRbc spectra at pH 6.0 in buffer (cross marks) are explicitly shown because these values overlap into the unbuffered data. A simplified figure displaying all the CSPA data points is shown in Supplementary Figure S6
| 7 |
A catalytic term for phosphate dianion (kHPO42− ) was clearly established by comparing the pH dependent exchange rates obtained from the buffered and unbuffered samples (Figure 6, see also Table S1). Above a pH value of about 3.5, the exchange rate of Hε2 in buffered solution begins to diverge dramatically due to increasing catalysis by . At pH 7, the contribution from the kHPO42− term is 27 times the unbuffered rate ( . As the pH is increased above the pKa of 4 the buffer exchange contribution plateaus and k4 becomes dominated by the hydroxide term (kOH− = 1.7 × 10¹⁰ M−1 s−1). The fitted second order rate constant for hydroxide essentially matches the widely accepted value for diffusion-controlled proton abstraction by hydroxide(Eigen 1964), which indicates that Hε2, unlike Hδ1, is freely accessible to hydroxide ion. The fitted second-order rate constant for catalyzed exchange of Hε2 is about two orders of magnitude smaller than predicted for free imidazole or a fully solvated peptide bound histidine (~108 M−1 s−1)(Eigen 1964; Slutsky et al. 1980), indicating a significant steric, orientational, or electrostatic barrier for abstraction of Hε2 by phosphate.
As with Hδ1, the Hε2 exchange rates measured here by QUEST and CSPA are generally smaller than previously reported values determined by linewidth measurements(Markley and Westler 1996). The previously reported exchange rate for Hε2 at pH 3.5 is 383 s−1, which is only modestly larger than the 100 s−1 measured here. However, the even faster rate previously reported at pH 1 (1230 s−1), is not compatible with the present data because the rate plateaus at ~ 100 s−1 at pH values below five (Figure 6). Thus, the broad lines for Hε2 at pH 1 may not be related to the exchange rate. Interestingly, Robillard and Shulman estimated an exchange rate for Hε2 at pH 7.5 of about 14,000 s−1 based on their observation of the Hδ1 signal (Robillard and Shulman 1974a). Unfortunately, their buffer concentration and type was not specified, but their value is strikingly similar to the ~17,000 s−1 determined here in the presence of 14 mM phosphate buffer.
The above analysis of Hε2 exchange highlights a powerful aspect of CSPA, where a non-observable exchanging proton (such as Hε2 at pH 7.5) can produce a measurable effect on the CEST signal of another proton in the system (such as Hδ1). In the present case, the exchange rate for Hε2 can be measured using CSPA with buffered samples in the pH range 7.6 to 8.1, even though the Hε2 signal is not detectable at these pH values (Figure 5a). This apparent paradox is resolved by noting that Hε2, with a pKa of 7.6, will be 50% populated at pH 7.6 and 24% populated at pH 8.1, and these proton populations are sufficient to perturb the Hδ1 CEST signal (eqs 2 and 3). Therefore, the Hδ1 signal can indirectly report on the Hε2 exchange rate. The robustness of the CSPA measured exchange rates of Hε2 at pH 7.6 and 8.1 is demonstrated by the successful prediction of these values from the fitted curve created using the lower pH measurements (Figure 6, black curve).
We note that the chemical shift titration data for Hε2 in Figure 5b suggests an apparent contradiction in the pKa value for Hε2, because the apparent transition for the Hε2 chemical shift occurs at a lower pH value (~ 6.8) than the midpoint for the Hδ1 chemical shift titration (7.6). However, the CSPA fits shown in Figure 5a were calculated using a single pKa = 7.6, establishing that a single pKa is sufficient to model the observed data (see also Supplemental Information for further analysis testing the single pKa model). The paradox is resolved by noting that the premature transition of the Hε2 chemical shift in buffered solutions is expected because of its rapid exchange with water, resulting in an upfield shift towards that of water (δH2O = 5.0 ppm, 4 °C (Wishart et al. 1995)). This conclusion is supported by comparing CEST spectra in buffered versus unbuffered solution near neutral pH (these two MTRbc spectra are compared in Fig S5, Supplementary Material). In buffered solutions, Hε2 shifts slightly towards the water resonance frequency and decreases in signal intensity due to buffer catalyzed exchange. In contrast, in unbuffered solutions the Hε2 exchange rate is too slow to result in an upfield shift during the titration and its signal persists. Additionally, the faster exchange rate of Hε2 in buffered solution may cause a greater signal overlap with the incoming Hγ signal, contributing an additional upfield shift to the observed chemical shift of Hε2.
Ser195-Hγ
There are no previous observations of the resonance corresponding to Ser195-Hγ at neutral and alkaline pH values. The 12 ppm chemical shift attributed to Ser195-Hγ is downfield shifted by 7 ppm compared to the average chemical shift for a Ser-Hγ proton in proteins (5 ± 1 ppm)(Ulrich et al. 2007) indicating a significant decrease in the electron density on this proton, and the presence of a significant hydrogen bond interaction with His57-Nε2. In hydrogen bond theory, such an electronically deshielded Hγ proton is considered to be favored when the pKa values of proton donor and acceptor are matched, resulting in partial covalent character to the hydrogen bond (Gilli et al. 2006). In the present case, it seems unlikely that the pKa value of Ser195-Hγ could be matched with that of His57-Hε2 (pKa =7.6), given the high pKa value of the relevant model compound N-acetylserinamide (pKa = 13.6)(Bruice et al. 1962). Nevertheless, the 7 ppm downfield shift of Ser195-Hγ is comparable to the downfield shift of His57-Hδ1, which is known to be involved in a short distance hydrogen bond with Asp102 (Robillard and Shulman 1974a; Kossiakoff and Spencer 1981; Wang et al. 1985). Thus, greater electron density resides on Ser195-Oγ as compared to a fully solvated hydroxyl group.
No crystal structures have been collected on S1 family serine proteases at alkaline pH, and therefore, the His57-Nε2· · ·Oγ-Ser195 distance under conditions where the hydrogen bond exists is unknown. Estimates of the Ser195-OHγ · · · Nδ1-His57 donor-acceptor distance may be obtained from empirical equations that predict the hydrogen bond lengths of Im+-NH· · · carboxylate− (NH+ · ·O−) (Viragh et al. 2000) and O-H· · ·O (OH· ·O) (Zhao et al. 1997) type hydrogen bonds from 1H-NMR chemical shift values (eqs 8 and 9).
| 8 |
| 9 |
Although these are imperfect models for the Ser195-OHγ · · · His57-Nδ system, a range for the heteroatom O· · · N distance of 2.69 to 2.91 Å may be predicted using eq 8 and 9 using the measured δHγ = 12 ppm. Thus at alkaline pH values, Hγ is likely involved in a short hydrogen bond with Nε2. Mechanistically, the downfield chemical shift of Hγ implies that Ser195-Oγ has significant alkoxide character even before substrate binding.
The increased alkoxide character of Oγ upon formation of the Hγ · · · Nε2 hydrogen bond is consistent with previous NMR data (Bachovchin 1986; Robillard and Shulman 1974a) and the current model of the catalytic triad. A commonly accepted model for the catalytic triad includes a hydrogen bond between His57 and Ser195 that forms when His57-Nε2 loses its proton(Hedstrom 2002; Bachovchin 2001), and our direct observations of Ser195-Hγ support this model. The polarized hydrogen bond involving Ser195-Hγ at alkaline pH is also consistent with the widely accepted single proton transfer mechanism in which neutral His57 accepts the Hγ proton from Ser195 during the first step of catalysis(Hedstrom 2002) (Fig 1b).
Owing to the rapid exchange rate of Hε2 with water in the pH range where Ser195-Hγ is detectable (pH > 7.0, k4 ~ 104 s−1) direct exchange of Hγ with water was indistinguishable from the indirect pathway Hγ → Hε2 → water. Therefore only the direct exchange path was modeled, and the resulting exchange rate of Hγ is an ‘apparent’ exchange rate. As measured by CSPA and QUEST, the net rate of abstraction of Ser195-Hγ increased from 50 to 800 s−1 in the pH range 7.1 – 9.7 (Table S1), with a value of 800 ± 100 s−1 at pH 7.6 (4 °C). If this same rate persists upon binding of the substrate, it is competent to account for the known rate of formation of the acyl enzyme intermediate during chymotrypsin catalysis (850 s−1, 25 °C)(Hedstrom 2002).
Conclusion
CEST is a unique NMR pulse sequence whose ability to detect rapidly exchanging protons has been largely overlooked in biomolecular NMR. The CEST-CSPA approach is especially well suited for application to systems that are structurally characterized so that accurate chemical models can be used to globally model all exchanging protons in the system. A strength of the CSPA approach is that all exchange parameters are simultaneously fitted in the context of the entire system, and different mechanisms can be tested for viability. Broader biomolecular applications of CEST would include systems where the exchanging protons have chemical shifts that are isolated from other exchanging protons, such as imino protons of nucleic acids, protons near paramagnetic centers, and systems such as the catalytic triad with unusually downfield shifted resonances. In addition, the large signal amplification provided by CEST allows detection of NH-backbone signals at micromolar concentrations and could potentially be used to study macroscopic events such as protein folding, dimerization, or micelle insertion in samples that are impossible to study at higher concentrations.
Materials and Methods
Preparation of bCT-A stock solution
bCT-A was purchased from Worthington Biochemical Co. (Lakewood, NJ lot 37J9779) and buffer exchanged using a pd10 desalting column from GE Healthcare Bio-Sciences Corp (Piscataway, NJ) into either a solution of (i) phosphate buffered saline (14 mM phosphate, 0.1 M KCl) at pH 3.0, or (ii) 0.1 M KCl at pH 3.0 that had been boiled and sparged with nitrogen in order to remove dissolved carbon dioxide. Phosphate buffer was chosen because of its broad pH buffering range and its small temperature coefficient for its acid dissociation constant(Christensen et al. 1976); KCl was chosen over NaCl to reduce pH measurement inaccuracies; and a pH of 3.0 was used because it is the optimum pH for chymotrypsinogen-A stability. The effluent from the desalting column was concentrated using centriprep YM-10 concentrators (Millipore) and centrifuged according to directions at 4 °C. The stock solution was stored at 4 °C and discarded after 48 hours because of the instability of the dissolved chymotrypsinogen-A(Proskuryakov 1967).
NMR sample preparation
The sample for the full Z-spectrum in Figure 3b was made by dissolving a weighed portion (concentration determined by dry weight measurement) of bCT-A directly into unbuffered solution. The sample was used immediately. All other samples were prepared as follows. Aliquots from the stock solution were used for the NMR experiments. An individual aliquot was used for three pH values at most (usually only one pH value per aliquot). The aliquot was brought to the desired pH using concentrated KOH and HCl solutions. As previously reported, bCT-A began to aggregate and precipitate near neutral through alkaline pH (Tung and Steiner 1974)(Markley and Ibanez 1978). Therefore, each sample was centrifuged using a Beckman desk top micro high-ultracentrifuge. Samples were spun at 4 °C at an average of 100,000 g for 5 minutes. The supernatant was collected and a UV spectrum was taken centered at λ280. After the NMR experiment for each aliquot was complete, UV and pH measurements were repeated. UV measurements were performed by dissolving 10 μL of sample into 990 μL of 6 M guanidinium hydrochloride. The molar extinction coefficient at 280 nm was calculated to be 50585 M−1 cm−1 using the Swiss Institute of Bionformatics ExPAsy Server (Gasteiger et al. 2003) and A280 was converted into concentration. For buffered samples, protein concentrations ranged from 1.1 to 1.3 mM for the pH titration and from 1.3 to 1.8 mM for the QUEST experiments. For unbuffered solutions, protein concentrations ranged from 1.3 to 1.5 mM. The same samples used for the unbuffered pH titration were also used for the unbuffered QUEST experiments.
pH calibration
The pH of each sample was measured before and after each NMR experiment. As is standard in the literature, the pH measurements were made at room temperature, 22 °C, even though the NMR experiments were performed at 4 °C. As an attempt at increased accuracy, a calibration curve was created after all experiments were completed. The curve was constructed with a best fit line to a plot of values measuring the pH of buffered samples at both 22 °C and 4 °C. The linear fit had an R squared value of .94 and corrections ranged between −.15 and +.25 pH units. This conversion was used for unbuffered samples as well. All reported pH values refer to the calculated 4 °C value.
NMR
1H NMR spectra were obtained at 500 MHz on a Varian INOVA using a probe equipped with z-axis gradients; 5 mM NMR tubes, NE-RG5-7, were purchased from New Era Enterprises. Probe temperature was set to 4 °C and internal temperature was evaluated using the chemical shift difference between water and methanol(Raiford et al. 1979) or water and 2,2-Dimethyl-2-silapentane-5-sulfonic acid (DSS)(Wishart et al. 1995). After giving the sample 15 minutes to equilibrate to probe temperature, the probe was tuned, locked, and shimmed using z-axis gradient shimming.
Z-spectrum generation
Raw NMR data were processed using a custom-modified version of matNMR software (van Beek 2007). Data were baseline corrected, Fourier transformed, and the magnitude of each complex point was calculated. The water signal profile for each saturation frequency was integrated and normalized using the average water signal intensity from the three most downfield observations. Water signal intensity as function of frequency, (ν), was plotted to form the Z-spectrum. In all spectra, water was set to 5.017 ppm, its chemical shift at 4 °C (Wishart et al. 1995).
Collection of Z-spectra for pH titration
A 6 second saturation pulse of 3.5 μT (110 Hz) was used for all pH values except for the buffered pH 5.5 sample which used a 6 second 3.6 μT (150Hz) power saturation pulse (indicated by an asterisk in Figure 5a). The use of a higher saturation power at pH 5.5 was an accidental missetting in the experimental parameters that we discovered during data analysis. It had no adverse effects on the quantitative analysis of the data. The t1 predelay was 18 seconds and the spectrum was collected as a function of frequency at 75 Hz intervals. There was only one transient per frequency point and total experimental time was 27 min.
Calculation of baselines for CEST spectra
For buffered samples, a single Z-spectrum was converted to eight MTRbc spectra using manual baseline fits constructed from cubic spline interpolation (spline), piecewise cubic hermit interpolating polynomial (pchip), polynomial order 7, and polynomial order 8. Each of the manual fits were repeated twice using different, but not disjoint, sets of baseline points. A ninth MTRbc spectrum was created from an automatic peak picking program which automatically assigned points as ‘baseline’ or ‘signal’ and fit a polynomial of order 6 to the Z-spectrum. A tenth MTRbc spectrum was created by averaging together the nine MTRbc spectra. This averaged MTRbc spectrum is what is depicted in Figure 5a.
For unbuffered samples, a single Z-spectrum was converted to ten MTRbc spectra using manual fits constructed from pchip, spline, and depending on the spectrum, a variety of piecewise polynomial fits of orders 3–6 and non-piecewise polynomial fits of orders 7 and 8. All fits were repeated twice using different, but not disjoint, sets of baseline points. A final eleventh MTRbc spectrum was created from averaging the ten MTRbc spectra together.
CSPA to measure exchange rates
As mentioned in the text, the MTRbc spectra were divided into three fit regions using the previously reported pKa for His57-Hε2 of chymotrypsinogen-A, 7.5 at 3°C(Robillard and Shulman 1974a). The three regions are: an acid region where only terms associated with the catalytic triad in the imidazolium state are included in the fit, pH < 7.0; a base region where only terms associated the catalytic triad in the neutral histidine state are included in the fit, pH > 8.1; and a neutral region where all terms are included, 7.0 ≤ pH ≤ 8.1. Because the assignment of Ser195-Hγ is restricted to the triad system when His57 is in the imidazole state, Hγ exchange terms; k5, k−5, k6, and k−6, are reserved for the neutral and basic fit regions. Additionally, k6 and k−6 were not included when fitting buffered spectra for two reasons. First, for buffered data, the k3 term is dominated by k4 (eq 2) in the neutral and basic regions. Second, the large k4 term made the fitting routine unable to distinguish an exchange pathway that involved Hγ → Hε2 → water from the direct path that involved Hγ → water.
The unbuffered pH 6.8 spectrum was a special case because the Hδ1 peak in this spectrum was comparatively broad (Figure S5 Supplementary Material), suggesting both Hδ1-Im+ and Hδ1-Im may be affecting the Hδ1 signal shape, therefore this spectrum was fit using all Hδ1 exchange terms even though pH 6.8 is below the cutoff (pH < 7.0) for including basic terms. A discussion and a more detailed description of the unbuffered pH 6.8 CSPA analysis are available in Supplementary Material (specifically the parameter constraints used and a further discussion of the Hδ1 signal in unbuffered samples).
The values of 1/T1=R1 and 1/T2=R2 of the water protons and the exchanging proton needed for the numerical fits using the Bloch equations were set as described in ‘Processing QUEST spectra’ below. Generally, the distribution of values measured from fitting multiple MTRbc spectra tended to be slightly bimodal, with one dominant grouping and a smaller outlier group. Therefore median values, rather than mean values are reported.
Acquisition of QUEST spectra
For each QUEST experiment, data were collected using incremental saturation times and constant saturation power. In this case, two possible exchange rate values could explain the observed time dependent signals (McMahon et al. 2006). To eliminate ambiguity, two different saturation powers were used for a single QUEST analysis and the data were fit simultaneously. Z-spectra for QUEST were collected using 3.5 μT (150 Hz) B1 field and 4.7 μT (200 Hz) field. For buffered samples, QUEST was performed at pH 3.4, 5.5, 8.0, and 8.1. The 3.5 μT pulse was used at incremental time durations: 0.5, 1 – 10 (in 1 s increments), and 12 s, and the 4.7 μT pulse was used at incremental time durations: 0.5, 4, 6, and 10 s, except for pH 3.5 in which the 0.5 s time duration was not collected. For samples without buffer, QUEST was performed at pH 3.5 and pH 6.8. The 3.6 μT pulse was used at incremental time durations: 0.5, 1, 1.5, 2, 2.5, 3, 3.5, 4, 5, 6, 8, 10, 12 s and the 4.7 μT pulse was used at incremental time durations: 0.5, 1, 1.5, 2, 4, 6, and 10 s.
Processing QUEST spectra
For both buffered and unbuffered solutions, the partial Z-spectra were converted to MTRbc spectra using a tri-exponential baseline constructed separately for each peak. The MTRbc spectra were fit using a custom written Lorentzian-Gaussian line fitting routine and the peak amplitudes extracted. QUEST exchange rates were extracted by fitting peak amplitudes versus saturation time using numerical solutions to the Bloch equations including saturation and exchange (Zhou et al. 2004). Three fit parameters, R2 of water, R1 of the exchanging proton, and R2 of the exchanging proton were assigned by estimation as the fit is insensitive to these values (McMahon et al. 2006). R2 of water was set to 0.6 s−1 and R2 of the protein proton was set to 38 s −1, and R1 of the protein proton to 0.71 s−1 based upon estimated values for similar experiments on poly-l-lysine (McMahon et al. 2006). (Comparing measured values of select fits using R2 values of 1 s−1 and 100 s−1 resulted in differences of 4 – 10%). The QUEST fit is sensitive to the R1 of water and this was set to 0.6 s−1 based upon experimental measurement and allowed to float (+/− 0.005). The R1 of water was measured in buffer solutions at various pH values at 4 °C, and found to be stable across the pH range. An inversion-recovery experiment using a weak gradient to remove effects of radiation damping was used for the R1 measurements (van Zijl and Moonen).
Because QUEST exchange rate measurements are very sensitive to protein concentration, errors in the measurements were estimated by adding a +/− 10% error to the protein concentration measurements and rerunning QUEST (10% was chosen based upon the spread of the concentration measurements for various pH values taken from the same stock solution). These error ranges are reported in Supplementary Material Table 1.
Fitting exchange rates as a function of pH
For the Hε2 fits, the kOH− and kH2O terms were first determined from fitting unbuffered data to eq 7. The term was determined by fitting the buffered data to eq 7 with fixed kOH− and kH2O values. In order to calculate [OH−] and [HPO42−], the pKa of water (pKw) and the pKa of buffer are needed. These values under the specific conditions used here are unknown and were therefore estimated from a collection of previously reported values of pKw and pKa at various temperatures and salt concentrations (Christensen et al. 1976). In 0.1 M KCl at 4 °C, pKw was estimated to be 14.7 and the pKa of HPO42− (the conjugate base of H2PO42−) estimated to be 7.2.
Supplementary Material
Acknowledgments
We thank Dr. David Shortle for suggesting the application of CEST to the catalytic triad and helpful discussions. We thank Dr. Juliette Lecomte and Dr. Al Mildvan for insightful discussions. We thank Dr. Mike McMahon for providing the QUEST numerical simulation program with the Bloch equations. We thank Dr. Bennet Landman for programming assistance and data processing consultation. We thank Dr. Ananya Majumdar, Dr. Douglas Robinson, and Joshua Friedman for experimental assistance. This work was supported in part by NIH grant GM068626 (JTS).
Footnotes
pKw is an estimated value at 4 °C as described in Materials and Methods
calculated using references (Wüthrich 1986; Eigen 1964) and accounting for the known diffusion constant of water at 4 °C (Holz et al. 2000)
The proton with a chemical shift of 12 ppm at basic pH values must exchange rapidly with solvent to be detected by the CEST method, indicating that the proton is bound to a heteroatom. The 12 ppm chemical shift falls in the chemical shift region highly characteristic of a nitrogen bound proton in a neutral histidine side chain. bCT-A has only two histidine residues, His57 and His40. The nitrogen bound protons of His57 are assigned and His40 has a pKa of 4.6, showing no other transitions or changes with increasing pH (Markley 1978). The 12 ppm signal could not belong to a His residue, thus, by process of elimination we assign this shift to a shared proton between Ser195-Oγ and His57-Nε2.
The pKa of HPO42− at 4 °C is estimated as described in Materials and Methods
Contributor Information
Carolyn B. Lauzon, Department of Radiology and Radiological Sciences, Johns Hopkins University School of Medicine, 720 Rutland Avenue, Baltimore, Maryland 21205, USA. Department of Biophysics and Biophysical Chemistry, Johns Hopkins University School of Medicine, 725 N. Wolfe Street, Baltimore, Maryland 21205, USA
Peter van Zijl, Department of Radiology and Radiological Sciences, Johns Hopkins University School of Medicine, 720 Rutland Avenue, Baltimore, Maryland 21205, USA. F. M. Kirby Research Center, Hugo Moser Research Institute for Functional Brain Imaging, Kennedy Krieger Institute, 707 N. Broadway, Baltimore, Maryland 21205, USA.
James T. Stivers, Department of Pharmacology and Molecular Sciences, Johns Hopkins University School of Medicine, 725 N. Wolfe Street, 314 Wood Basic Science BLD, Baltimore, Maryland 21205, USA
References
- Aime S, Castelli DD, Crich SG, Gianolio E, Terreno E. Pushing the sensitivity envelope of lanthanide-based magnetic resonance imaging (MRI) contrast agents for molecular imaging applications. Acc Chem Res. 2009;42:822–831. doi: 10.1021/ar800192p. [DOI] [PubMed] [Google Scholar]
- Bachovchin W. 15N NMR spectroscopy of hydrogen-bonding interactions in the active site of serine proteases: evidence for a moving histidine mechanism. Biochem. 1986;25:7751–7759. doi: 10.1021/bi00371a070. [DOI] [PubMed] [Google Scholar]
- Bachovchin W. Review: Contributions of NMR spectroscopy to the study of hydrogen bonds in serine protease active sites. Magn Res Chem. 2001;39:S199–S213. [Google Scholar]
- Barksdale A, Rosenberg A. Acquisition and interpretation of hydrogen exchange data from peptides, polymers, and proteins. In: Glick D, editor. Methods of biochemical analysis. Vol. 28. John Wiley and Sons; Hoboken, NJ: 1982. pp. 1–113. [DOI] [PubMed] [Google Scholar]
- Bruice T, Fife T, Bruno J, Brandon N. Hydroxyl group catalysis. II. The reactivity of the hydroxyl group of serine. The nucleophilicity of alcohols and the ease of hydrolysis of their acetyl esters as related to their pKa. Biochem. 1962;1:7–12. doi: 10.1021/bi00907a002. [DOI] [PubMed] [Google Scholar]
- Bryant R. The dynamics of water-protein interactions. Annu Rev Biophys Biomol Struct. 1996;25:29–53. doi: 10.1146/annurev.bb.25.060196.000333. [DOI] [PubMed] [Google Scholar]
- Christensen J, Hansen L, Izatt R. Handbook of proton ionization heats and related thermodynamic quantities. Wiley; New York: 1976. [Google Scholar]
- Dery O, Corvera C, Steinhoff M, Bunnett N. Proteinase-activated receptors: novel mechanisms of signaling by serine proteases. Am J Physiol-Cell Physiol. 1998;274:C1429–C1452. doi: 10.1152/ajpcell.1998.274.6.C1429. [DOI] [PubMed] [Google Scholar]
- Eigen M. Proton transfer, acid-base catalysis, and enzymatic hydrolysis. Part I: elementary processes. Angew Chem Int Ed Engl. 1964;3:1–19. [Google Scholar]
- Eigen M, Hammes G, Kustin K. Fast reactions of imidazole studied with relaxation spectrometry. J Am Chem Soc. 1960;82:3482–3483. [Google Scholar]
- Forsén S, Hoffman RA. Study of moderetely rapid chemical exchange by means of nuclear magnetic double resonance. J Chem Phys. 1963;39:2892–2901. [Google Scholar]
- Freer S, Kraut J, Robertus J, Wright H. Chymotrypsinogen: 2, 5-crystal structure, comparison with-chymotrypsin, and implications for zymogen activation. Biochem. 1970;9:1997–2009. doi: 10.1021/bi00811a022. [DOI] [PubMed] [Google Scholar]
- Friedman J, McMahon M, Stivers J, Van Zijl P. Indirect detection of labile solute proton spectra via the water signal using frequency-labeled exchange (FLEX) transfer. J Am Chem Soc. 2010;132:1813–1815. doi: 10.1021/ja909001q. [DOI] [PMC free article] [PubMed] [Google Scholar]
- Gasteiger E, Gattiker A, Hoogland C, Ivanyi I, Appel R, Bairoch A. ExPASy: the proteomics server for in-depth protein knowledge and analysis. Nucleic Acids Res. 2003;31:3784–3788. doi: 10.1093/nar/gkg563. [DOI] [PMC free article] [PubMed] [Google Scholar]
- Gilli P, Bertolasi V, Pretto L, Gilli G. Outline of a transition-state hydrogen-bond theory. J Mol Struct. 2006;790:40–49. [Google Scholar]
- Goffeney N, Bulte JW, Duyn J, Bryant LH, Jr, van Zijl PC. Sensitive NMR detection of cationic-polymer-based gene delivery systems using saturation transfer via proton exchange. J Am Chem Soc. 2001;123:8628–8629. doi: 10.1021/ja0158455. [DOI] [PubMed] [Google Scholar]
- Grad J, Bryant R. Nuclear magnetic cross-relaxation spectroscopy. J Magn Reson (1969) 1990;90:1–8. doi: 10.1002/mrm.1910170216. [DOI] [PubMed] [Google Scholar]
- Gregory R, Crabo L, Percy A, Rosenberg A. Water catalysis of peptide hydrogen isotope exchange. Biochem. 1983;22:910–917. doi: 10.1021/bi00273a031. [DOI] [PubMed] [Google Scholar]
- Hedstrom L. Serine protease mechanism and specificity. Chem Rev. 2002;102:4501–4524. doi: 10.1021/cr000033x. [DOI] [PubMed] [Google Scholar]
- Heutinck K, ten Berge I, Hack C, Hamann J, Rowshani A. Serine proteases of the human immune system in health and disease. Mol Immunol. 2010;47:1943–1955. doi: 10.1016/j.molimm.2010.04.020. [DOI] [PubMed] [Google Scholar]
- Holz M, Heil S, Sacco A. Temperature-dependent self-diffusion coefficients of water and six selected molecular liquids for calibration in accurate 1 H NMR PFG measurements. Phys Chem Chem Phys. 2000;2:4740–4742. [Google Scholar]
- Kerr M, Walsh K, Neurath H. Catalysis by serine proteases and their zymogens. Study of acyl intermediates by circular dichroism. Biochem. 1975;14:5088–5094. doi: 10.1021/bi00694a010. [DOI] [PubMed] [Google Scholar]
- Kossiakoff A, Spencer S. Direct determination of the protonation states of aspartic acid-102 and histidine-57 in the tetrahedral intermediate of the serine proteases: neutron structure of trypsin. Biochem. 1981;20:6462–6474. doi: 10.1021/bi00525a027. [DOI] [PubMed] [Google Scholar]
- Kraut J. Serine proteases: structure and mechanism of catalysis. Annu Rev Biochem. 1977;46:331–358. doi: 10.1146/annurev.bi.46.070177.001555. [DOI] [PubMed] [Google Scholar]
- Liang T, Abeles R. Complex of α-chymotrypsin and N-acetyl-L-leucyl-L-phenylalanyl trifluoromethyl ketone: structural studies with NMR spectroscopy. Biochem. 1987;26:7603–7608. doi: 10.1021/bi00398a011. [DOI] [PubMed] [Google Scholar]
- Ling W, Regatte RR, Navon G, Jerschow A. Assessment of glycosaminoglycan concentration in vivo by chemical exchange-dependent saturation transfer (gagCEST) Proc Natl Acad Sci U S A. 2008;105:2266–2270. doi: 10.1073/pnas.0707666105. [DOI] [PMC free article] [PubMed] [Google Scholar]
- Lonsdale-Eccles J, Neurath H, Walsh K. Probes of the mechanism of zymogen catalysis. Biochem. 1978;17:2805–2809. doi: 10.1021/bi00607a016. [DOI] [PubMed] [Google Scholar]
- Markley J, Ibanez I. Zymogen activation in serine proteinases. Proton magnetic resonance pH titration studies of the two histidines of bovine chymotrypsinogen A and chymotrypsin A. alpha. Biochem. 1978;17:4627–4640. doi: 10.1021/bi00615a008. [DOI] [PubMed] [Google Scholar]
- Markley J, Westler W. Protonation-state dependence of hydrogen bond strengths and exchange rates in a serine protease catalytic triad: bovine chymotrypsinogen A. Biochem. 1996;35:11092–11097. doi: 10.1021/bi961366k. [DOI] [PubMed] [Google Scholar]
- McMahon MT, Gilad AA, DeLiso MA, Berman SM, Bulte JW, van Zijl PC. New “multicolor” polypeptide diamagnetic chemical exchange saturation transfer (DIACEST) contrast agents for MRI. Magn Reson Med. 2008;60:803–812. doi: 10.1002/mrm.21683. [DOI] [PMC free article] [PubMed] [Google Scholar]
- McMahon MT, Gilad AA, Zhou J, Sun PZ, Bulte JWM, van Zijl P. Quantifying exchange rates in chemical exchange saturation transfer agents using the saturation time and saturation power dependencies of the magnetization transfer effect on the magnetic resonance imaging signal (QUEST and QUESP): Ph calibration for poly L lysine and a starburst dendrimer. Magn Reson Med. 2006;55:836–847. doi: 10.1002/mrm.20818. [DOI] [PMC free article] [PubMed] [Google Scholar]
- Morgan P, Robinson N, Walsh K, Neurath H. Inactivation of bovine trypsinogen and chymotrypsinogen by diisopropylphosphorofluoridate. Proc Natl Acad Sci. 1972;69:3312–3316. doi: 10.1073/pnas.69.11.3312. [DOI] [PMC free article] [PubMed] [Google Scholar]
- Mulkern RV, Williams ML. The general solution to the Bloch equation with constant RF and relaxation terms: application to saturation and slice selection. Med Phys. 1993;20:5–13. doi: 10.1118/1.597063. [DOI] [PubMed] [Google Scholar]
- Polgar L. The catalytic triad of serine peptidases. Cell Mol Life Sci. 2005;62:2161–2172. doi: 10.1007/s00018-005-5160-x. [DOI] [PMC free article] [PubMed] [Google Scholar]
- Proskuryakov M. Preparation and some properties of porcine chymotrypsinogen. Chem Nat Compd. 1967;3:38–40. [Google Scholar]
- Raiford D, Fisk C, Becker E. Calibration of methanol and ethylene glycol nuclear magnetic resonance thermometers. Anal Chem. 1979;51:2050–2051. [Google Scholar]
- Rawlings N, Barrett A. MEROPS: the peptidase database. Nucleic Acids Res. 2010;38:D227–D233. doi: 10.1093/nar/gkp971. [DOI] [PMC free article] [PubMed] [Google Scholar]
- Robillard G, Shulman R. High resolution nuclear magnetic resonance study of the histidine--aspartate hydrogen bond in chymotrypsin and chymotrypsinogen. J Mol Biol. 1972;71:507–511. doi: 10.1016/0022-2836(72)90366-x. [DOI] [PubMed] [Google Scholar]
- Robillard G, Shulman R. High Resolution Nuclear Magnetic Resonance Studies of the Active Site of Chymotrypsin. J Mol Biol. 1974a;86:519–540. doi: 10.1016/0022-2836(74)90178-8. [DOI] [PubMed] [Google Scholar]
- Robillard G, Shulman R. High resolution nuclear magnetic resonance studies of the active site of chymotrypsin. II. Polarization of histidine 57 by substrate analogues and competitive inhibitors. J Mol Biol. 1974b;86:541–558. doi: 10.1016/0022-2836(74)90179-x. [DOI] [PubMed] [Google Scholar]
- Sherry AD, Woods M. Chemical exchange saturation transfer contrast agents for magnetic resonance imaging. Annu Rev Biomed Eng. 2008;10:391–411. doi: 10.1146/annurev.bioeng.9.060906.151929. [DOI] [PMC free article] [PubMed] [Google Scholar]
- Slutsky L, Madsen L, White R, Harkness J. Kinetics of the exchange of protons between hydrogen phosphate ions and a histidyl residue. J Phys Chem. 1980;84:1325–1329. [Google Scholar]
- Tung M, Steiner R. The Self-Association of Chymotrypsinogen A. Eur J Biochem. 1974;44:49–58. doi: 10.1111/j.1432-1033.1974.tb03456.x. [DOI] [PubMed] [Google Scholar]
- Ulrich E, Akutsu H, Doreleijers J, Harano Y, Ioannidis Y, Lin J, Livny M, Mading S, Maziuk D, Miller Z. BioMagResBank. Nucleic Acids Res. 2007 doi: 10.1093/nar/gkm957. [DOI] [PMC free article] [PubMed] [Google Scholar]
- van Beek J. matNMR: A flexible toolbox for processing, analyzing and visualizing magnetic resonance data in Matlab®. J Magn Reson. 2007;187:19–26. doi: 10.1016/j.jmr.2007.03.017. [DOI] [PubMed] [Google Scholar]
- van Zijl P, Moonen C. Solvent suppression strategies for in vivo magnetic resonance spectroscopy. In: Seelig J, Ruden M, editors. NMR, Basic Principles and Progress. Vol. 26. Springer-Verlag; Berlin: 1992. pp. 67–108. [Google Scholar]
- van Zijl PCM, Yadav N. Chemical Exchange Saturation Transfer (CEST): What is in a name and what isn’t? Magn Reson Med. 2011 doi: 10.1002/mrm.22761. [Epub ahead of print] [DOI] [PMC free article] [PubMed] [Google Scholar]
- Viragh C, Harris T, Reddy P, Massiah M, Mildvan A, Kovach I. NMR evidence for a short, strong hydrogen bond at the active site of a cholinesterase. Biochem. 2000;39:16200–16205. doi: 10.1021/bi0022644. [DOI] [PubMed] [Google Scholar]
- Wang D, Bode W, Huber R. Bovine chymotrypsinogen A: X-ray crystal structure analysis and refinement of a new crystal form at 1.8 Å resolution. J Mol Biol. 1985;185:595–624. doi: 10.1016/0022-2836(85)90074-9. [DOI] [PubMed] [Google Scholar]
- Ward KM, Aletras AH, Balaban RS. A new class of contrast agents for MRI based on proton chemical exchange dependent saturation transfer (CEST) J Magn Reson. 2000;143:79–87. doi: 10.1006/jmre.1999.1956. [DOI] [PubMed] [Google Scholar]
- Wishart DS, Bigam CG, Yao J, Abildgaard F, Dyson HJ, Oldfield E, Markley JL, Sykes BD. 1H, 13C and 15N chemical shift referencing in biomolecular NMR. J Biomol NMR. 1995;6:135–140. doi: 10.1007/BF00211777. [DOI] [PubMed] [Google Scholar]
- Wüthrich K. Baker Lecture Series. John Wiley and Sons; New York: 1986. NMR of proteins and nucleic acids. [Google Scholar]
- Yoshida S, Shiosaka S. Plasticity-related serine proteases in the brain (review) Int J Mol Med. 1999;3:405–409. doi: 10.3892/ijmm.3.4.405. [DOI] [PubMed] [Google Scholar]
- Zhao Q, Abeygunawardana C, Gittis A, Mildvan A. Hydrogen bonding at the active site of [delta] 5-3-ketosteroid isomerase. Biochem. 1997;36:14616–14626. doi: 10.1021/bi971549m. [DOI] [PubMed] [Google Scholar]
- Zhou J, Wilson D, Sun P, Klaus J, van Zijl P. Quantitative description of proton exchange processes between water and endogenous and exogenous agents for WEX, CEST, and APT experiments. Magn Reson Med. 2004;51:945–952. doi: 10.1002/mrm.20048. [DOI] [PubMed] [Google Scholar]
Associated Data
This section collects any data citations, data availability statements, or supplementary materials included in this article.