Abstract
Increased aggregation of misfolded proteins is associated with aging, and characterizes a number of neurodegenerative disorders caused by homopolymeric amino acid expansion mutations. PABPN1 is an aggregation-prone nuclear protein. Natural aggregation of wild-type (WT) PABPN1 is not known to be disease-associated, but alanine-expanded PABPN1 (expPABPN1) accumulates in insoluble intranuclear inclusions in muscle of patients with oculopharyngeal muscular dystrophy (OPMD). We applied microscopic image quantification to study PABPN1 aggregation process in living cells. We identified transitional pre-inclusion foci and demonstrate that these structures significantly differ between WT- and expPABPN1-expressing cells, while inclusions of these proteins are indistinguishable. In addition to the immobile PABPN1 in inclusions, in the nucleoplasm of expPABPN1 expressing cells we also found a fraction of immobile proteins, representing pre-aggregated species. We found that pre-aggregated and pre-inclusion structures are reverted by a PABPN1 specific affinity binder while inclusion structures are not. Together our results demonstrate that the aggregation process of WT- and expPABPN1 differs in steps preceding inclusion formation, suggesting that pre-aggregated protein species could represent the cytotoxic structures.
Key words: protein aggregation, protein dynamic, PABPN1, protein mobility, nuclear structures
Introduction
Inclusion formation is a pathological hallmark of a number of neuro- and myodegenerative diseases. In many of these diseases, the genetic lesion causes expansion of homopolymeric polyglutamine (polyGlu) or polyalanine (polyAla) tracts. These expanded proteins are often misfolded and accumulate in insoluble polymers,1,2 and eventually form fibrillar structures.3 In addition to the disease-associated protein aggregation, widespread protein aggregation was recently found in normal aging of C. elegans.4 Common to the polyGlu or polyAla and the aging-associated aggregated proteins is that they are found in a broad spectrum of cell types.4,5 Studies of polyGlu repeat in heterologous systems and in unicellular models demonstrated that the aggregation process is not cell type specific and is not limited to multicellular organisms.5 Despite the intensive studies on protein aggregation the processes by which inclusions are formed and their role in cytotoxicity is largely unknown.
The poly(A) binding protein nuclear 1 (PABPN1) is an aggregation prone protein and PABPN1 overexpression leads to the formation of intranuclear inclusions in cultured cells and in aging rat neuron cells.6,7 Homopolymeric polyAla expansion mutations are found in patients with oculopharyngeal muscular dystrophy (OPMD).8 As a result, an Alanine tract of 10 residues at N-terminus of the wild-type (WT) PABPN1 is expanded in the mutant protein forms by 2–7 Alanine residues. Alanine-expanded PABPN1 (expPABPN1) has a higher aggregation potential as compared with the WT protein.9 WT- and expPABPN1 are both prone to aggregation, but only the mutant form is known to be pathogenic.10,11 So far, however, the aggregation process of PABPN1 is not fully understood. We hypothesized that differences in the aggregation process and/or aggregation structures may provide an explanation for their differences in cytotoxicity. We therefore carried out comparative studies analyzing the aggregation process in cells expression WT- or expPABPN1.
The aggregation propensity of aggregation-prone proteins is proportional to their expression level.12 We therefore only selected cells with low transgene expression levels to minimize overexpression effects of the aggregation process. We preformed quantitative image analysis of the aggregation process in cells expressing Ala10- or Ala16-PABPN1 (also referred as WT- and expPABPN1, respectively) with comparable low transgene expression levels. With these criteria, we found that PABPN1 inclusion formation is a multi-step process where transitional and reversible foci, we named pre-inclusions, precede inclusion formation. We demonstrate that the aggregation process of WT-PABPN1 significantly differs from that of expPABPN1 in the pre-inclusion step. We show that pre-inclusions but not inclusion structures can be efficiently reverted with a specific affinity binder to PABPN1. In addition, we found evidence for pre-aggregated proteins in the nucleoplasm of expPABPN1 but not of WT-PABPN1 expressing cells. We suggest that these pre-aggregated forms might represent pathogenic components of expPABPN1, which could be targets for anti-aggregation therapies.
Results
Establishment of a cell model for studying GFP-PABPN1 in living cells.
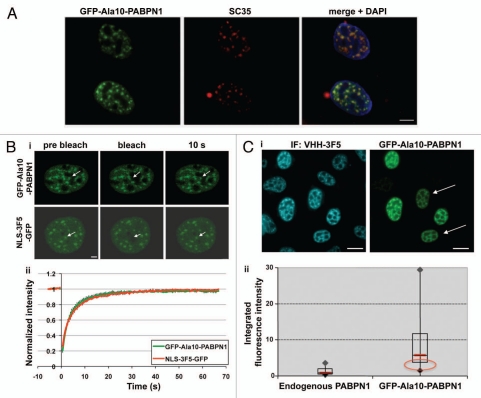
The process of nuclear inclusion formation was studied in living U2OS cells. N-terminal fusion of yellow or green fluorescent protein (YFP or GFP) to PABPN1 showed a predominantly nuclear localization in speckles, as previously reported in references 6, 7 and 13. Speckles localization was observed for endogenous PABPN1 when immunofluorescently stained with VHH-3F5, a specific affinity binder of PABPN1 16 (Fig. 1). Similar localization was also found for the GFP-PABPN1 fusion (Fig. 1). Speckles are defined with SC35, localization and diffuse amorphous structures. Based on this definition, PABPN1 localized in speckles in U2OS cells (Fig. 1A). Analysis of PABPN1 mobility in speckles, by fluorescence recovery after photobleaching (FRAP), shows that the N-terminal fusion protein of PABPN1 has 100% fluorescence recovery (Fig. 1B). This indicates that when localized to speckles GFP-Ala10-PABPN1 is mobile.14,15 The GFP-VHH-3F5 protein also showed speckles localization (Fig. 1Bi). The fluorescence recovery rate of VHH-3F5-GFP in speckles was very similar to that of GFP-PABPN1 (Fig. 1Bii). Based on these protein mobility studies we conclude that the mobility of GFP-PABPN1 is similar to that of VHH-3F5-GFP bound to endogenous PABPN1.
Figure 1.
GFP-PABPN1 nuclear localization and protein mobility is similar to that of endogenous PABPN1. (A) Co-localization of GFP-PABPN1 with SC35. U2OS cells were transfected with GFP-Ala10-PABPN1 and were fixed 24 hours post transfection. Immunolabeling was carried out with anti-SC35 antibodies, which were visualized with secondary Alexa 594-conjugated antibodies. Scale bar is 5 µm. (B) VHH-3F5 does not change the mobility of PABPN1 in speckles. U2OS cells were transfected with GFP-Ala10-PABPN1 or VHH-3F5-GFP constructs. 20 hours post transfection cells showing speckles organization were subjected to FRAP experiments. (i) Images are of representative cells expressing either GFP-Ala10-PABPN1 or VHH-3F5-GFP at pre-bleaching or 10 seconds after bleaching. Arrows indicate the bleached area (2 µm). Scale bars are 1 µm. (ii) Curves show the recovery of fluorescence intensity for GFP-Ala10-PABPN1 (green line), or VHH-3F5-GFP (red line). Average represents 10 cells. (C) Determination of transgene expression levels in a cell-based assay. (i) Images of fixed cells expressing GFP-Ala10-PABPN1, which were labeled with VHH-3F5 and visualized with a secondary Deac-conjugated antibody. A similar nuclear localization is found for endogenous PABPN1 and the GFP-fused PABPN1. Scale bars are 20 µm. (ii) B-box plots show the normalized integrated fluorescence intensity, which was calculated from 75 cells. The red circle indicates expression levels that were selected for analysis. Arrows in (i) point to typical cells, which were selected for studies.
Since the aggregation propensity of aggregation-prone proteins is proportional to their expression level,12 it is essential to select cells with similar expression levels for comparative studies. The transgene expression level was determined in images of cell nuclei with speckles organization of PABPN1. The measurements of the integrated GFP fluorescence intensity show high variation in expression levels between individual cells, while the variations in endogenous PABPN1, which was visualized with VHH-3F5, were much smaller (Fig. 1Cii). Therefore, in our studies only cells with low transgene expression levels were selected for further analysis (Fig. 1Cii; typical cells are indicated with arrows Fig. 1Ci). This demonstrates that at low expression levels fusion of a fluorescent protein at the N-terminus of PABPN1 is suitable to study the aggregation process of PABPN1 in living cells.
PABPN1 aggregation is a multi step process.
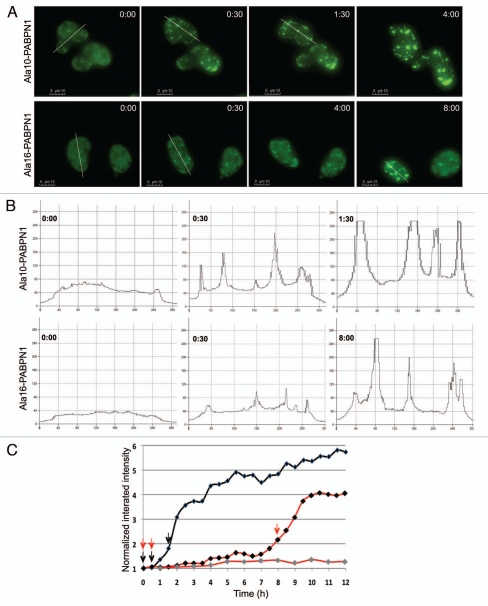
The aggregation process of PABPN1 was studied in living cells. During imaging we noticed that inclusions disappeared during mitosis, which was accompanied by a cytoplasmic redistribution of GFP-PABPN1 (Sup. Fig. 1). To eliminate the effect of cell division on the aggregation process, in our analysis only non-dividing cells were included. Consistent with previous studies,6 time lapse-images show that PABPN1 localization changes from speckles to inclusions (Fig. 2A). Intensity plots demonstrated a change in the distribution of PABPN1 fluorescence: from an irregular distribution in nuclei with speckles, to a focal fluorescence distribution in nuclei with foci (Fig. 2B). A focal fluorescence distribution is typical for aggregated proteins.17 For a quantitative description of the aggregation process, the integrated intensity of YFP-PABPN1 was measured from the time-lapse images at 30 min intervals (Fig. 2C). This analysis reveals that foci are first formed without increase in fluorescence intensity (Fig. 2B and C; 30 min) and subsequently the PABPN1 integrated intensity is increased together with PABPN1 accumulation in foci (Fig. 2B and C). This suggests that aggregation of PABPN1 in foci proceeds in two steps: first foci are made of existing proteins (named pre-I) and subsequently accumulation of PABPN1 is associated with inclusion formation.
Figure 2.
PABPN1 foci formation is a multi step process. (A) Time-lapse imaging of inclusion formation in cells expressing WT-PABPN1 (Ala10-PABPN1) or expPABPN1 (Ala16-PABPN1) fused to YFP. Time 0 was defined as 1 hour before foci formation. The elapsed time of each frame is indicated. Scale bars are 10 µm. (B) Intensity distribution plots of PABPN1 were made from cells at 0:00, 0:30 and 1:30 and 8:30 hours (in A). Intensities were measured along the transverse lines (shown in A). (C) Quantification of PABPN1 intensity in selected nuclei. Integrated intensity measured in 30–60 min intervals and was normalized to the intensity measured at time 0. Shown are cells expressing YFP-Ala10-PABPN1 (black line) and two YFP-Ala16-PABPN1 expressing cells (red lines). Arrows indicate the times that were selected for generating the intensity plots (B).
Quantification of PABPN1 aggregation process reveals pre-inclusion structures.
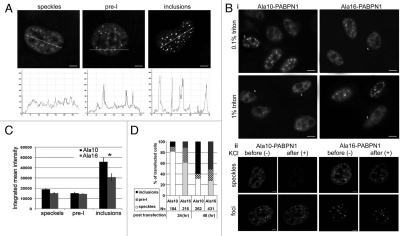
To analyse the aggregation process of PABPN1 in more details, confocal images of single nuclei were taken and image quantifications were used to describe the nuclear organization of PABPN1. We found a change in fluorescence distribution from an irregular to a foci type of distribution in nuclei with speckles or with inclusions, respectively (Fig. 3A). Also, PABPN1 was depleted from the nucleoplasm in nuclei with inclusions. In nuclei with pre-I, both nucleoplasm staining and foci structures were found (Fig. 3A), suggesting that pre-I is a transitional step. This suggests that during PABPN1 aggregation proteins are gradually depleted from the nucleoplasm and accumulate in foci.
Figure 3.
Quantification of INI formation reveals transitional pre-I structures. Cells expressing YFP-Ala10-PABPN1 (YFP-Ala10) or YFP-Ala16-PABPN1 (YFP-Ala16) vectors and were imaged 24 hours after transfection. (A) Confocal images of representative nuclei show PABPN1 localized to speckles, pre-I and inclusions. Scale bars are 1 µm. Exposure times are equal. For each of the organizational structures intensity distribution plots of PABPN1 were made along the transverse lines. (B) Biochemical properties of pre-I structures. YFP-Ala10-PABPN1 or YFP-Ala16-PABPN1 transfected cells were treated with KCl or Triton-X100 24 hours after transfection. (i) Cells were treated with 1% triton X-100 for 15 minutes, 0.1%% triton X-100 was used as a control. Cells with speckles fluorescence distribution are indicated with S. Scale bars are 10 µm. (ii) Confocal Z-stacks were taken from living cells 20 minutes after KCl (1 M final concentration) treatment. As a control, the same cells were imaged before treatment. Shown are maximum projections of representative cells with speckles or pre-INI. Scale bars are 1 µm. The fluorescence intensity for each of the nuclei is shown. (C) Quantification of integrated fluorescence intensity in cells exhibiting speckles, pre-I or inclusion organization of PABPN1. Confocal images were taken from cells transfected with YFP-Ala10-PABPN1 or with YFP-Ala16-PABPN1 27 hours post transfection, Histograms show the integrated mean intensity of PABPN1 fluorescence in each of the structural organizations: speckles, pre-I and INI. The asterisk indicates p < 0.05, two-tailed t-test. Averages represent 25 cells. (D) Histograms show the percentage of cells with Ala10- or Ala16-PABPN1 with speckles, pre-I or inclusions at 24 and 48 hours after transfection. The number (N=) of counted cells is indicated.
To confirm that PABPN1 in foci is aggregated according to the biochemical definition,7,18 cells were treated with high Triton X100 or KCl concentration. PABPN1 foci were resistant to 1% Triton-X100 treatment (Fig. 3Bi). In contrast, the organization in speckles disrupted after treatment with 1% Triton-X100 but not with 0.1% Triton-X100 (Fig. 3Bi speckles are marked with S). In addition, confocal images of single nuclei before and after 1M KCl show that the fluorescence distribution of Ala10- or Ala16-PABPN1 in foci is KCl resistant, whereas the distribution in speckles disrupted and reduced (Fig. 3Bii). This demonstrated that pre-I structures contain aggregated PABPN1. Based on these biochemical experiments no differences were found between aggregated WT- or expPABPN1 proteins.
Next, we evaluated the expression level of nuclear PABPN1 by measuring the integrated mean fluorescence intensity from confocal images. Between speckles and inclusions a significant increase in protein accumulation was found (Fig. 3C), further demonstrating that in vitro aggregation is associated with increase in protein accumulation.12 In cells with pre-I structures the mean integrated fluorescence intensity was similar to that measured in cells with speckles (Fig. 3C). This indicates that the existing PABPN1 proteins initially aggregate and only after an increase in PABPN1 protein accumulation inclusions are formed. This conclusion is consistent with the observations in Figure 2B showing that foci are first formed without increase in fluorescence intensity and only subsequently an increase in PABPN1 protein accumulation was found. Together it suggests that pre-I are formed from pre-existing PABPN1 molecules.
If inclusion formation was associated with protein accumulation we would expect to find a gradual increase in cells containing inclusions in a population of transfected cells. The proportion of transfected cells with inclusions increased between 24 and 48 hours whereas the proportion of cells with speckles reduced (Fig. 3D). In contrast, the proportion of cells with pre-I structures did not change between the two time points (Fig. 3D). This further suggests that pre-I structures are transitional.
Pre-inclusion structures differ between WT- and expPABPN1.
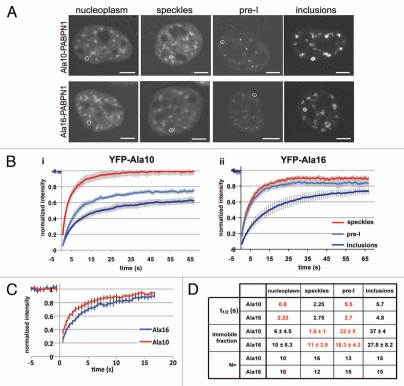
To further characterize structures of nuclear PABPN1, protein mobility was determined with the FRAP procedure. YFP-PABPN1 mobility was analysed in bleached regions of speckles, pre-I and inclusions (examples of the bleached regions are indicated with a circle in Fig. 4A). The fluorescence recovery plots of PABPN1 revealed distinct protein mobility between speckles, pre-I and inclusions (Fig. 3B). Consistent with the characteristic of aggregated proteins, in pre-I and inclusions immobile fractions were found, while in speckles Ala10-PABPN1 was fully mobile (Fig. 4B). Interestingly, in speckles of Ala16-PABPN1 a small immobile fraction was found (Fig. 4B and D). Also in the nucleoplasm of Ala16-PABPN1, but not in Ala10-PABPN1 expressing cells, a small immobile fraction was found (Fig. 4C and D). This indicates the presence of bound protein species of expPABPN1 in the nucleoplasm before aggregated species are formed.
Figure 4.
FRAP analysis reveals differences in protein mobility between WT- and expPABPN1. FRAP analysis was preformed on cells transfected with YFP-Ala10-PABPN1 (YFP-Ala10) or YFP-Ala16-PABPN1 (YFP-Ala16) vectors. (A) Confocal images of representative nuclei. The bleached area in nucleoplasm, speckles, pre-I and inclusions are indicated with circles. Scale bars are 1 µm. (B) FRAP plots show the fluorescence recovery of YFP-Ala10-PABPN1 (i) or YFP-Ala16-PABPN1 (ii) in speckles (red line), pre-I (light blue) or inclusions (dark blue). (C) FRAP plots show the fluorescence recovery of YFP-Ala10-PABPN1 (red) or YFP-Ala16-PABPN1 (blue) in the nucleoplasm. (D) Table shows the biophysical properties of PABPN1 in the three nuclear structures and in the nucleoplasm. Differences between YFP-Ala10-PABPN1 and YFP-Ala16-PABPN1 are highlighted in red. N indicates the number of cells used for statistical analysis.
Between pre-I and inclusions a gradual and statistical significant increase in the immobile fraction and in the average half time (t1/2) was found (Fig. 4B and D). As PABPN1 mobility in pre-I structures was intermediate to that in inclusions and speckles, it further suggests that pre-I structures are transitional. Most differences were found in the pre-I structures (Fig. 4D). In the Ala16-PABPN1 expressing cells the immobile fraction and the average half time were smaller as compared with Ala10-PABPN1 expressing cells. This indicates a higher mobility of the mutant protein in pre-I as compared to the WT protein. In contrast, the mobility in inclusions did not differ between cells expressing Ala10- or Ala16-PABPN1 (Fig. 4D). Together, this reveals differences between WT- and expPABPN1 mobility early in the aggregation process, while the mobility in inclusions appeared to be very similar. In addition, it suggests that pre-I structures are distinct from inclusions.
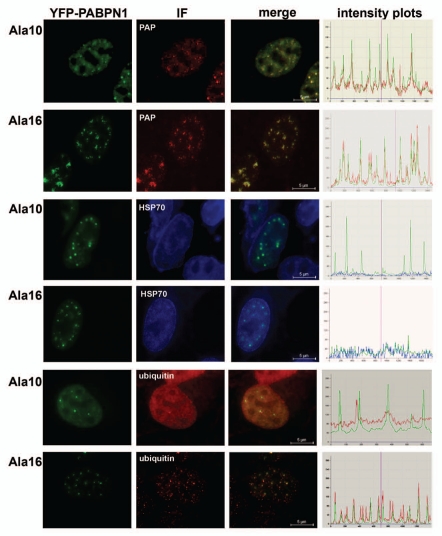
Next we employed microscopic co-localization studies to further characterize pre-I structures. Molecular partners were used to differentiate between PABPN1 in speckles and in inclusions.7 Whereas SC35 co-localizes with PABPN1 in speckles it does not co-localize with inclusions and poly(A) polymerase (PAP) and ubiquitin co-localize with PABPN1 in inclusions but not in speckles.7 We confirmed these observations in our cell model (Sup. Fig. 2) and investigated the co-localization of these molecular partners in pre-I (Fig. 5). Fluorescence intensity plots were applied to determine co-localization between PABPN1 and molcular partners in pre-I structures (Fig. 5). PAP, but not HSP70 co-localized with pre-I structures in Ala10- and Ala16-PABPN1 transfected cells (Fig. 5). Ubiquitin, however, co-localized only with pre-I structures of expPABPN1 (Fig. 5). This indicates that molecular differences between Ala10- and Ala16-PABPN1 exist between pre-I and inclusion structures, and between pre-I of expPABPN1 and those of the WT protein.
Figure 5.
Differential co-localization of molecular partners in pre-I structures. Cells expressing YFP-Ala10-PABPN1 (Ala10) or YFP-Ala16-PABPN1 (Ala16) were fixed 30 hours post transfection and were immunolabeled for PAP, Hsp70 and poly-ubiquitin. PAP and ubiquitin antibodies were visualized with an Alexa 594 conjugated secondary antibody and the Hsp70 antibody was recognized with a DEAC-conjugated secondary antibody. Co-localization between PABPN1 and the antibody is visualized in the merged images. Scale bars are 5 µm.
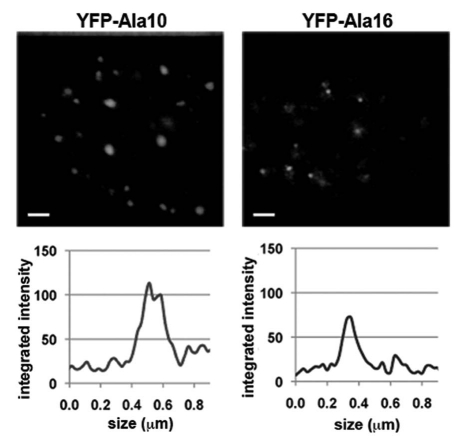
Since pre-I structures of Ala10- and Ala16-PABPN1 differ in molecular partners, it is possible that their size also differs. To address this possibility Stimulated Emission Depletion (STED) microscopy was applied, since its resolution is higher than that of a confocal microscope.19 The smallest pre-I structures in Ala16-PABPN1 expressing cells were 50–70 nm (Fig. 6). In cells expressing Ala10-PABPN1, however, the smallest particles found were 150–170 nm (Fig. 6). This suggests that pre-I structures of expPABPN1 are more stable, and thus detectable, as compared to pre-I of WT PABPN1.
Figure 6.
High-resolution STED microscopy reveals size differences between WT- and expPABPN1 pre-I structures. Cells expressing YFP-Ala10-PABPN1 or YFP-Ala16-PABPN1 were fixed 24 hours post transfection and subjected to STED microscopy. (i) Image shows representative nuclei, scale bar equals 400 nm. (ii) Line profiles and foci size is shown for the smallest individual foci in each of the images.
Temporal differences in the aggregation process between WT and expPABPN1 are found in the pre-inclusion step.
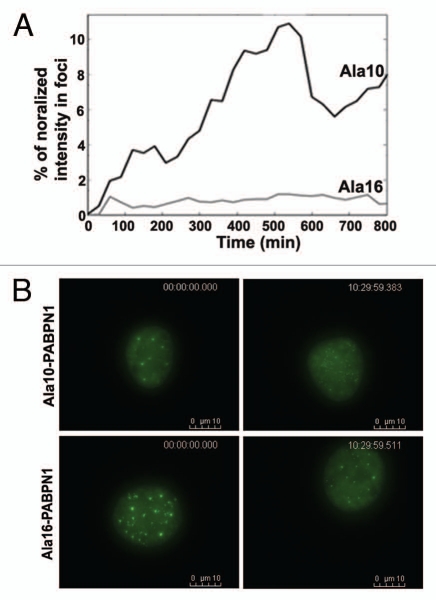
To identify temporal differences in the aggregation process of WT and mutant PABPN1 the accumulation of fluorescence in foci between WT and mutant PABPN1 was quantified in images from 15 nuclei. A fast increase in the mean fluorescence intensity in foci was found in Ala10 expressing cells while at the same time (t = 13.3 hours) the mean fluorescence intensity of Ala16 expressing cells was only slightly increased (Fig. 7A). These differences were consistent and significant (p < 0.005), indicating that WT-PABPN1 accumulation in foci is faster as compared to the accumulation of the expPABPN1 protein in foci.
Figure 7.
Temporal differences between WT and expPABPN1 aggregation process. (A) Quantitative analysis of PABPN1 accumulation in foci. The fluorescence intensity in foci was measured from time-lapse images of cells expressing YFP-Ala10-PABPN1 or YFP-Ala16-PABPN1. The percentage of fluorescence intensity localized to foci was calculated from the nuclear fluorescence intensity. Plots show average of 7 and 15 cells for WT- and expPABPN1, respectively. (B) Pre-I reversion. Images of nuclei at time 0:00 and 10:30 hours were taken from time-lapse imaging of cells expressing YFP-Ala10- or Ala16-PABPN1. Time and scale bars are indicated.
In about 20% of the Ala10-PABPN1 expressing cells (N = 25 cells), foci were spontaneously reverted to a speckle-like organization (Fig. 7B and Sup. Movie 2A). In contrast, during the same time (10.5 hours) foci reversion was not found in Ala16-PABPN1 expressing cells (N = 30 cells) (Fig. 7B and Sup. Movie 2B). This reversion was not associated with cell division. This reveals that foci structures of WT-PABPN1 but not of the mutant protein are reversible.
PABPN1 affinity binder specifically reverses pre-inclusion structures.
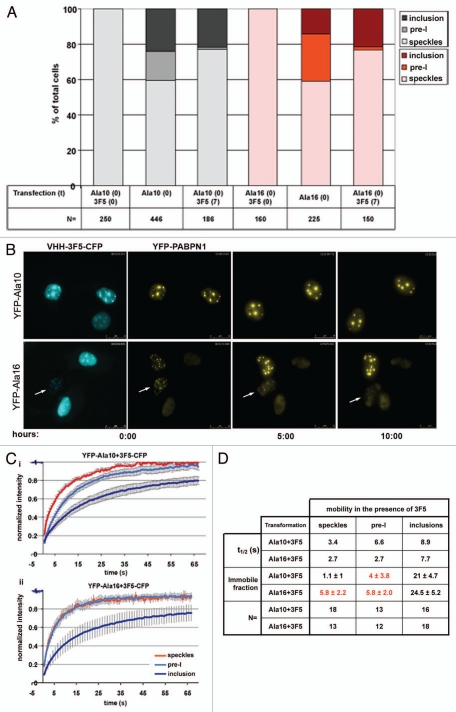
The intrabody VHH-3F5 is a small affinity binder for PABPN1, which specifically recognizes the alpha-helical domain in PABPN1.16,20 The alpha-helical domain is essential for INI formation,9 and binding of VHH-3F5 to PABPN1 interferes with this process in both cellular and animal models.16,21 Here we analyzed whether VHH-3F5 specifically interferes with inclusions or pre-I structures. In agreement with previous studies,16 when VHH-3F5 was simultaneously expressed with either WT- or expPABPN1, cells containing inclusions were not detected. This indicates prevention of protein aggregation by VHH-3F5 (Fig. 8A; VHH-3F5, t = 0). In sequential co-transfection experiments where transfection of VHH-3F5-CFP followed that of YFP-PABPN1 with 7 hours time interval, a significant reduction of cells with pre-I was found (Fig. 8A; 3F5, t = 7) and in time-lapse imaging reversion of pre-I into speckles was detected. In these experiments, no inclusion reversal was found (Fig. 8B). Since VHH-3F5 co-localizes with both pre-I and inclusion structures (Fig. 8B) the difference in its propensity to revert PABPN1 aggregates could result from the different biophysical properties of PABPN1 in each of the structures.
Figure 8.
VHH-3F5 dissolves pre-I structures. (A) Histograms show the percentage of speckle, pre-I or inclusions as function of time in cells co-expressing YFP-Ala10-PABPN1 or YFP-Ala16-PABPN1 and NLS-VHH-3F5-CFP. Cells were either co-transfected with the PABPN1 and VHH-3F5 plasmids at time 0, or initially transfected with the PABPN1 constructs and after 7 hours co-transfected with the VHH-3F5 construct. Measurements were carried out 24 or 32 hours post-transfection, respectively. The number of cells for each histogram is indicated. (B) Time-lapse imaging of cells that were initially transfected with either YFP-Ala10-PABPN1 or YFP-Ala16-PABPN1 and 7 hours later co-transfected with VHH-3F5-CFP. Imaging of living cells started 24 hours after transfection with VHH-3F5-CFP. Upper row shows co-transfected cells with inclusions. VHH-3F5-CFP binding to PABPN1 in inclusions does not affect the aggregates. Lower row show a co-transfected cell with pre-I (indicated with an arrow), where the foci structures gradually disappears. (C) FRAP fluorescence recovery plots of U2OS cells that were sequentially co-transfected cells. FRAP was measured from YFP-Ala10-PABPN1 (i) or YFP-Ala16-PABPN1 (ii) in speckles (red line), pre-I (light blue) and inclusions (dark blue). Averages represent 12–18 cells, as indicated in (D). Table shows the half time of fluorescence recovery (t1/2) in seconds and the immobile fraction for every set of transformations in each of the PABPN1 organizational structures. Numbers that are highlighted in red indicate significant difference between the single transfections, as shown in Figure 3C, and the co-transfections with VHH-3F5. The number of cells used for statistical analysis is indicated (N).
To test this hypothesis, we analyzed the effect of VHH-3F5 on PABPN1 mobility in cells that were sequentially co-transfected with Ala10-PABPN1 or Ala16-PABPN1 and VHH-3F5-CFP, as described above. The fluorescence recovery plots revealed that in the presence of VHH-3F5-CFP the mobility of PABPN1 increased in pre-I, and the immobile fraction was reduced (Fig. 8D and indicated in red). In contrast, VHH-3F5-CFP expression did not affect PABPN1 mobility and the immobile fraction in inclusions (Fig. 8C). Importantly, VHH-3F5 also reduced the immobile fraction of pre-aggregated Ala16 in speckles (Fig. 8D). These results suggest that VHH-3F5 prevents INI formation by reducing pre-aggregated and pre-inclusion structures of expPABPN1.
Discussion
Protein aggregation of poly-Ala or poly-Glu expanded mutant proteins is a pathological hallmark of a number of neuro- and myodegenerative diseases. In addition, a widespread protein aggregation was recently demonstrated during normal aging of C. elegans.4 Although prevention of protein aggregation in disease models has been shown a promising therapeutic strategy to delay the pathogenesis of this group of disorders in animal models (reviewed in ref. 22 and 23), it is essential to demonstrate the target specificity of these anti-aggregation strategies. Taking advantage of the aggregation-prone biochemical property of WT- and expPABPN1 we performed a quantitative comparative study of the aggregation process. Smilar to aggregation of poly-Glu expanded proteins PABPN1 aggregation process can be divided into distinct steps. Initially pre-I insoluble structures are formed from existing PABPN1 molecules and inclusion formation is associated with an increase in protein accumulation. Pre-I and inclusions are also distinguished based on PABPN1 mobility and co-localization of molecular partners, but biochemically they are similar. Moreover, pre-I structures are transitional while inclusions are not.
Our studies here revealed temporal differences between the Ala10- and Ala16-PABPN1 aggregation processes. We found a temporal extension of the pre-I step in Ala16-PABPN1 expressing cells suggesting a delay in inclusion formation. Our FRAP analysis revealed that in pre-I structures of Ala16-PABPN1 protein mobility is higher than that of the WT protein. Since aggregated proteins are entrapped in inclusions, the higher protein mobility suggests a slower protein entrapment and therefore a delay in inclusion formation in expPABPN1 expressing cells. In our studies, however we did not find differences between inclusions of WT- and expPABPN1 expressing cells. Together we suggest that the aggregation process of WT- and expPABPN1 differs in steps preceding inclusion formation.
Although aggregated proteins are mostly known for their accumulation in insoluble inclusion bodies,18 here we identified an immobile fraction of Ala16-PABPN1, which is not localized to fluorescence foci. This immobile fraction could represent pre-aggregated species and could be equivalent to oligomers of polyGlu.24 More recently, in cellular models for Huntington disease, these oligomers were suggested to initiate the aggregation process of the mutant protein and have been suggested to represent a toxic unit.25,26 Since only expPABPN1 is known to be toxic, the differences presented here between WT- and expPABPN1 could suggest that toxicity of expPABPN1 may lie in early aggregation stages, preceding inclusion formation. In vitro, the functionality of PABPN1 is restricted to the soluble protein.27 Thus, it is possible that pre-aggregated PABPN1 and PABPN1 in pre-I structures are less active. Since these protein species are predominately found in cells expressing the mutant protein, it suggests that in cells expressing expPABPN1, the availability of functional PABPN1 is reduced as compared with cells expressing the WT protein. A change in the ratio between soluble and insoluble protein species was recently suggested for other aggregation disorders like Dystrophia myotonia type 1 28 and Huntington's disease.29 Therefore, the change in ratio between the soluble and insoluble protein species in protein aggregation disorders could lead to reduced cell function.
VHH-3F5 was demonstrated as an effective anti-aggregation molecule in an OPMD Drosophila model21 and in Hela cells.16 Here we show that VHH-3F5 is highly effective in reversal of pre-I structures and that it reduces the mobility of PABPN1 in pre-I structures. Moreover VHH-3F5 reduces the immobile fraction in pre-aggregated species. This suggests that anti-aggregation approaches would be more effective when the ratio between pre-aggregated and aggregated proteins is high. When the aggregated proteins are entrapped in inclusions they are less mobile and therefore aggregation reversion is less efficient. These results open a new opportunity to interfere with pre-aggregated structured of disease-associated aggregated proteins.
Materials and Methods
Plasmid constructs.
The Ala10-PABPN1 (WT-PABPN1) was cloned in the EGFP-C1 (Clontech Laboratories Inc.,) expression vector using the following primers, forward: 5′-ACG AGA ATT CAT GGC GGC G, reverse: 5′-GAT ATG GTA CCG GGT AAG GGG ATA CC containing EcoRI and BamHI restriction sites, respectively. Subsequently, the EGFP fragment was replaced by ECFP and EYFP using the restriction sites EcoRI and BamH1. The cDNA for Ala16-PABPN1 (expPABPN1) was amplified from the WT-PABPN1 using the forward primer 5′-ACG AGA ATT CAT GGC GGC GGC GGC G-3′, and the reverse primer 5′-GAT ATG GTA CCG GGT AAG GGG ATA CC-3′, containing EcoRI and BamHI restriction sites, respectively. Purified and amplified PCR fragments were inserted in-frame into EcoRI-BamH1 fragment of pEGFP and pEYFP (Clontech Laboratories Inc.). All plasmids were verified by direct sequencing (LGTC, Leiden, Netherlands). The NLS-VHH-3F5-GFP construct was previously described in reference 16. The NLS-VHH-3F5 fragment was cloned into the ECFP-N1 using EcoRI-BamHI restriction sites.
Cell culture, transfection and cell-based selection.
U2OS human osteosarcoma cells were obtained from A.G. Jochemsen (MCB, LUMC, Leiden, The Netherlands). Cells were routinely grown in Dulbecco's medium (DMEM) without phenol red, containing 1.0 mg/ml glucose, supplemented with 10% foetal calf serum (FCS), 2 mM L-glutamine, 100 U/ml penicillin and 100 µg/ml streptomycin, all Gibco BRL, in a humidified incubator at 37°C (5% CO2).
For transformation, U2OS-cells were grown to 60–70% confluence on small Petri dishes containing a glass bottom (Mat Tek corporation, glass bottom no 1.5). Cells were transfected with a total of 0.7 µg of the plasmid DNA by using Lipofectamine™ 2000 (Invitrogen) according to the manufacturer's protocol. For co-transfection experiments 0.5 µg of each plasmid were used. Cells were analyzed between 20–72 hours post-transfection only.
The normalized integrated fluorescence intensity was calculated in the following steps: (1) using DAPI staining the nuclear ROI was determined. (2) the integrated nuclear fluorescence intensity of GFP and CFP spectra in the nuclear ROI was measured. (3) in excel the normalized integrated intensity was calculated after background correction. Subsequently the endogenous level was calculated: endogenous = [CFP] - [GFP]; the transgene expression level was normalized to the endogenous [GFP]/[endogenous].
Activation of apoptosis was monitored with the cleaved caspase-3 antibody, and was found only in cells that express PABPN1 at high overexpression levels (Sup. 4). These cells were excluded from our studies.
Immunocytochemistry.
Immunocytochemistry of transfected cells grown on glass was carried out as previously described in reference 30. PABPN1 was detected with VHH-3F5-Myc (1:1,000) and secondary mouse anti Myc (1:1,000; Sigma-Aldrich) and DEAC conjugated secondary antibodies. Additional antibodies used in this study are: mouse anti SC35 (1:500; Sigma-Aldrich), rabbit anti PAP (1:500; Santa Cruz Biotechnology), sheep anti Ubiquitin (1:500; Abcam), rabbit anti poly-Ubiquitin (1:500; Dako), rabbit anti Hsp70 (1:750; Santa Cruz Biotechnology), which were detected with the appropriate Alexa-Fluor 488, Alexa-Fluor 594 (Invitrogen) or DEAC conjugated secondary antibodies. Preparations were mounted in Citifluor (Agar Scientific) containing 400 µg/ml DAPI (Sigma-Aldrich) and examined with confocal laser scanning microscopy (Leica SP5) or Fluorescence microscope (Leica DM RXA), using a 63x or a 100x lens NA 1.4 plan Apo objective.
Live cell imaging and image analysis.
Imaging of living cells was carried out in a climate chamber maintained at 37°C and 5% CO2. For short periods, cells were maintained in 37°C without CO2. Unless otherwise mentioned, image analysis and quantification was performed with an imaging program that was made in the department of MCB, LUMC, Leiden, The Netherlands.
Time-lapse microscopy. We used wide-field microscopy on a microscopic workstation (model AF6000 XL; Leica), equipped with a Leica EL6000 external light source with metal halide bulb and a 63x NA 1.4 plan Apo objective. A CFP-YFP FRET filter block from Chroma technology was used to collect fluorescence images.
During the imaging climate chamber maintained at 37°C and the CO2 concentration adjusted to 5%. A binning of 2 × 2 pixels was used to reduce the exposure time below 1 second. Time lapse imaging of 10 Z-stacks was carried out at 30 min intervals. Image processing was carried out with Leica software.
Quantification of foci dynamics. Quantification analysis of the time-lapse microscopic images that were taken at 30 minutes intervals was carried out using the Image Processing toolbox of the software package Matlab. An adaptive threshold was first applied to separate the nucleus from the cytoplasmic background. Next, the extended-maxima transform31 was used to identify local maxima of the image intensity. The local intensity maxima were set and identified as foci, in order to be distinguished from the diffused signal in speckles. This automatic foci quantification was applied to all (usually 2–4) cells in a single frame. Fluorescence intensity in foci was normalized to the nuclear intensity and was plotted over time. In order to compare between multiple cells, time 0 was defined as one hour before foci were detected. The fluorescence intensity in speckles was set as a threshold value and fluorescence intensities in foci above the threshold value were recorded in time.
Fluorescence recovery after photobleaching (FRAP). FRAP experiments were performed on a Leica TCS/SP5 confocal microscope using a 100x NA 1.4PL APO objective lens. The 488 nm and 514 nm laser lines were used for excitation of GFP and YFP, respectively. Since the pre-I structures are highly mobile, we choose a 2 µm bleaching area, containing a single particle (Fig. 1A). For bleaching the laser power was set to maximum. Ten images were taken before the bleaching and 120 images after bleaching at time intervals of 0.555 s at 4% laser transmission to avoid additional bleaching. Fluorescence recovery analyses of the beached areas were automatically carried out with Leica software. The recovery curves were corrected for background, fluorescence fading and decrease in fluorescence during photobleaching. The t1/2 value was defined as the time required for reaching half-maximum recovery and was calculated from the corrected recovery curves.
STED microscopy and particle size. Transfected U2OS cells were fixed 24 hours post transfection and were imaged with a STED microscope as described in reference 19. Quantification of particle size was carried out as described in reference 19.
Acknowledgments
We thank B. Hein and K.I. Willig (Department of Nanobiophotonics, Max Planck Institute for Biophysical Chemistry, Göttingen, Germany) for using their STED microscope facility and for useful discussions. We thank Curtis Barrett and Gert Jan B. van Ommen (LUMC, The NL) for useful comments on the manuscript.
This work was supported with funds from Agentschap NL (IGE05005), the European Union (POLY-ALA: LSHM-CT-2005-018675), the MDA (68016) and the Association Française contre les Myopathies.
Supplementary Material
References
- 1.Di Prospero NA, Fischbeck KH. Therapeutics development for triplet repeat expansion diseases. Nat Rev Genet. 2005;6:756–765. doi: 10.1038/nrg1690. [DOI] [PubMed] [Google Scholar]
- 2.Tavanez JP, Bengoechea R, Berciano MT, Lafarga M, Carmo-Fonseca M, Enguita FJ. Hsp70 chaperones and type I PRMTs are sequestered at intranuclear inclusions caused by polyalanine expansions in PABPN1. PLoS One. 2009;4:6418. doi: 10.1371/journal.pone.0006418. [DOI] [PMC free article] [PubMed] [Google Scholar]
- 3.Uversky VN. Alpha-synuclein misfolding and neurodegenerative diseases. Curr Protein Pept Sci. 2008;9:507–540. doi: 10.2174/138920308785915218. [DOI] [PubMed] [Google Scholar]
- 4.David DC, Ollikainen N, Trinidad JC, Cary MP, Burlingame AL, Kenyon C. Widespread protein aggregation as an inherent part of aging in C. elegans. PLoS Biol. 2010;8:1000450. doi: 10.1371/journal.pbio.1000450. [DOI] [PMC free article] [PubMed] [Google Scholar]
- 5.Hands S, Wyttenbach A. Neurotoxic protein oligomerisation associated with polyglutamine diseases. Acta Neuropathologica. 2010;120:419–437. doi: 10.1007/s00401-010-0703-0. [DOI] [PubMed] [Google Scholar]
- 6.Klein AF, Ebihara M, Alexander C, Dicaire MJ, Sasseville AMJ, Langelier Y, et al. PABPN1 polyalanine tract deletion and long expansions modify its aggregation pattern and expression. Exp Cell Res. 2008;314:1652–1666. doi: 10.1016/j.yexcr.2008.02.005. [DOI] [PubMed] [Google Scholar]
- 7.Tavanez JP, Calado P, Braga J, Lafarga M, Carmo-Fonseca M. In vivo aggregation properties of the nuclear poly(A)-binding protein PABPN1. Rna-A Publication of the Rna Society. 2005;11:752–762. doi: 10.1261/rna.7217105. [DOI] [PMC free article] [PubMed] [Google Scholar]
- 8.Brais B, Bouchard JP, Xie YG, Rochefort DL, Chretien N, Tome FM, et al. Short GCG expansions in the PABP2 gene cause oculopharyngeal muscular dystrophy. Nat Genet. 1998;18:164–167. doi: 10.1038/ng0298-164. [DOI] [PubMed] [Google Scholar]
- 9.Abu-Baker A, Messaed C, Laganiere J, Gaspar C, Brais B, Rouleau GA. Involvement of the ubiquitin-proteasome pathway and molecular chaperones in oculopharyngeal muscular dystrophy. Hum Mol Genet. 2003;12:2609–2623. doi: 10.1093/hmg/ddg293. [DOI] [PubMed] [Google Scholar]
- 10.Berciano MT, Villagra NT, Ojeda JL, Navascues J, Gomes A, Lafarga M, et al. Oculopharyngeal muscular dystrophy-like nuclear inclusions are present in normal magnocellular neurosecretory neurons of the hypothalamus. Hum Mol Genet. 2004;13:829–838. doi: 10.1093/hmg/ddh101. [DOI] [PubMed] [Google Scholar]
- 11.Villagra NT, Bengoechea R, Vaque JP, Llorca J, Berciano MT, Lafarga M. Nuclear compartmentalization and dynamics of the poly(A)-binding protein nuclear 1 (PABPN1) inclusions in supraoptic neurons under physiological and osmotic stress conditions. Mol Cell Neurosci. 2008;37:622–633. doi: 10.1016/j.mcn.2007.12.012. [DOI] [PubMed] [Google Scholar]
- 12.Tartaglia GG, Pechmann S, Dobson CM, Vendruscolo M. Life on the edge: a link between gene expression levels and aggregation rates of human proteins. Trends Biochem Sci. 2007;32:204–206. doi: 10.1016/j.tibs.2007.03.005. [DOI] [PubMed] [Google Scholar]
- 13.Sasseville AMJ, Caron AW, Bourget L, Klein AF, Dicaire MJ, Rouleau GA, et al. The dynamism of PABPN1 nuclear inclusions during the cell cycle. Neuro of Dis. 2006;23:621–629. doi: 10.1016/j.nbd.2006.05.015. [DOI] [PubMed] [Google Scholar]
- 14.Reits EA, Neefjes JJ. From fixed to FRAP: measuring protein mobility and activity in living cells. Nat Cell Biol. 2001;3:145–147. doi: 10.1038/35078615. [DOI] [PubMed] [Google Scholar]
- 15.Sprague BL, McNally JG. FRAP analysis of binding: proper and fitting. Trends Cell Biol. 2005;15:84–91. doi: 10.1016/j.tcb.2004.12.001. [DOI] [PubMed] [Google Scholar]
- 16.Verheesen P, de Kluijver A, van Koningsbruggen S, de Brij M, de Haard HJ, van Ommen GJ, et al. Prevention of oculopharyngeal muscular dystrophy-associated aggregation of nuclear polyA-binding protein with a single-domain intracellular antibody. Hum Mol Genet. 2006;15:105–111. doi: 10.1093/hmg/ddi432. [DOI] [PubMed] [Google Scholar]
- 17.Morley JF, Brignull HR, Weyers JJ, Morimoto RI. The threshold for polyglutamine-expansion protein aggregation and cellular toxicity is dynamic and influenced by aging in Caenorhabditis elegans. Proc Natl Acad Sci USA. 2002;99:10417–10422. doi: 10.1073/pnas.152161099. [DOI] [PMC free article] [PubMed] [Google Scholar]
- 18.Rajan RS, Illing ME, Bence NF, Kopito RR. Specificity in intracellular protein aggregation and inclusion body formation. Proc Natl Acad Sci USA. 2001;98:13060–13065. doi: 10.1073/pnas.181479798. [DOI] [PMC free article] [PubMed] [Google Scholar]
- 19.Hein B, Willig KI, Hell SW. Stimulated emission depletion (STED) nanoscopy of a fluorescent protein-labeled organelle inside a living cell. Proc Natl Acad Sci USA. 2008;105:14271–14276. doi: 10.1073/pnas.0807705105. [DOI] [PMC free article] [PubMed] [Google Scholar]
- 20.Impagliazzo A, Tepper AW, Verrips TC, Ubbink M, van der Maarel SM. Structural basis for a PABPN1 aggregation-preventing antibody fragment in OPMD. FEBS Lett. 2010 doi: 10.1016/j.febslet.2010.03.010. [DOI] [PubMed] [Google Scholar]
- 21.Chartier A, Raz V, Sterrenburg E, Verrips CT, van der Maarel SM, Simonelig M. Prevention of oculopharyngeal muscular dystrophy by muscular expression of Llama single-chain intrabodies in vivo. Hum Mol Genet. 2009;18:1849–1859. doi: 10.1093/hmg/ddp101. [DOI] [PubMed] [Google Scholar]
- 22.Brais B. Oculopharyngeal muscular dystrophy: a polyalanine myopathy. Curr Neurol Neurosci Rep. 2009;9:76–82. doi: 10.1007/s11910-009-0012-y. [DOI] [PubMed] [Google Scholar]
- 23.Nagai Y, Popiel HA. Conformational changes and aggregation of expanded polyglutamine proteins as therapeutic targets of the polyglutamine diseases: exposed beta-sheet hypothesis. Curr Pharm Des. 2008;14:3267–3279. doi: 10.2174/138161208786404164. [DOI] [PubMed] [Google Scholar]
- 24.Sanchez I, Mahlke C, Yuan J. Pivotal role of oligomerization in expanded polyglutamine neurodegenerative disorders. Nature. 2003;421:373–379. doi: 10.1038/nature01301. [DOI] [PubMed] [Google Scholar]
- 25.Legleiter J, Mitchell E, Lotz GP, Sapp E, Ng C, DiFiglia M, et al. Mutant huntingtin fragments form oligomers in a polyglutamine length-dependent manner in vitro and in vivo. J Biol Chem. 2010;285:14777–14790. doi: 10.1074/jbc.M109.093708. [DOI] [PMC free article] [PubMed] [Google Scholar]
- 26.Olshina MA, Angley LM, Ramdzan YM, Tang J, Bailey MF, Hill AF, et al. Tracking mutant huntingtin aggregation kinetics in cells reveals three major populations that include an invariant oligomer pool. J Biol Chem. 2010;285:21807–21816. doi: 10.1074/jbc.M109.084434. [DOI] [PMC free article] [PubMed] [Google Scholar]
- 27.Kuhn U, Gundel M, Knoth A, Kerwitz Y, Rüedel S, Wahle E. Poly(A) tail length is controlled by the nuclear poly(A)-binding protein regulating the interaction between poly(A) polymerase and the cleavage and polyadenylation specificity factor. J Biol Chem. 2009;284:22803–22814. doi: 10.1074/jbc.M109.018226. [DOI] [PMC free article] [PubMed] [Google Scholar]
- 28.Junghans RP. Dystrophia myotonia: why focus on foci? Eur J Hum Genet. 2009;17:543–553. doi: 10.1038/ejhg.2008.227. [DOI] [PMC free article] [PubMed] [Google Scholar]
- 29.de Mezer M, Wojciechowska M, Napierala M, Sobczak K, Krzyzosiak WJ. Mutant CAG repeats of Huntingtin transcript fold into hairpins, form nuclear foci and are targets for RNA interference. Nucl Acids Res. 39:3852–3863. doi: 10.1093/nar/gkq1323. [DOI] [PMC free article] [PubMed] [Google Scholar]
- 30.Raz V, Carlotti F, Vermolen BJ, van der PE, Sloos WC, Knaan-Shanzer S, et al. Changes in lamina structure are followed by spatial reorganization of heterochromatic regions in caspase-8-activated human mesenchymal stem cells. J Cell Sci. 2006;119:4247–4256. doi: 10.1242/jcs.03180. [DOI] [PubMed] [Google Scholar]
- 31.Soille P. Morphological Image Analysis: Principles and Applications. Springer-Verlag; 2010. [Google Scholar]
Associated Data
This section collects any data citations, data availability statements, or supplementary materials included in this article.


