Abstract
We demonstrate the application of image-based high-content screening (HCS) methodology to identify small molecules that can modulate the FGF/RAS/MAPK pathway in zebrafish embryos. The zebrafish embryo is an ideal system for in vivo high-content chemical screens. The 1-day old embryo is approximately 1mm in diameter and can be easily arrayed into 96-well plates, a standard format for high throughput screening. During the first day of development, embryos are transparent with most of the major organs present, thus enabling visualization of tissue formation during embryogenesis. The complete automation of zebrafish chemical screens is still a challenge, however, particularly in the development of automated image acquisition and analysis. We previously generated a transgenic reporter line that expresses green fluorescent protein (GFP) under the control of FGF activity and demonstrated their utility in chemical screens 1. To establish methodology for high throughput whole organism screens, we developed a system for automated imaging and analysis of zebrafish embryos at 24-48 hours post fertilization (hpf) in 96-well plates 2. In this video we highlight the procedures for arraying transgenic embryos into multiwell plates at 24hpf and the addition of a small molecule (BCI) that hyperactivates FGF signaling 3. The plates are incubated for 6 hours followed by the addition of tricaine to anesthetize larvae prior to automated imaging on a Molecular Devices ImageXpress Ultra laser scanning confocal HCS reader. Images are processed by Definiens Developer software using a Cognition Network Technology algorithm that we developed to detect and quantify expression of GFP in the heads of transgenic embryos. In this example we highlight the ability of the algorithm to measure dose-dependent effects of BCI on GFP reporter gene expression in treated embryos.
Keywords: Cellular Biology, Issue 40, Zebrafish, Chemical Screens, Cognition Network Technology, Fibroblast Growth Factor, (E)-2-benzylidene-3-(cyclohexylamino)-2, 3-dihydro-1H-inden-1-one (BCI), Tg(dusp6:d2EGFP)
Protocol
1) Set up zebrafish matings and BCI treatment.
Two days prior to treatment, identify homozygous male Tg(dusp6:d2eGFP)pt6 zebrafish and place individually into mating tanks1. Add separator and a wild type AB* female fish and leave in mating cages overnight.
The next morning remove the separator, and collect embryos after 1 hour. Transfer embryos to 100mm dishes with E3 (5 mM NaCl, 0.17 mM KCl, 0.33 mM CaCl2, 0.33 mM MgSO4), solution and incubate at 28°C for 6 hours. Remove dead and unfertilized embryos, add fresh E3 solution, and incubate overnight.
Sort transgenic embryos for similar stage (24hpf) and uniform GFP expression. Array embryos individually into each well of a 96-well plate.
Remove excess E3 solution with a micropipette. Add 200μl of E3 solution with a multi-channel pipettor into each well.
- Add the following compounds as listed:
1 2 3 4 5 6 7 8 9 10 11 12 A 2μlDMSO 2μlBCl (0.1mM) 2μlBCl(0.5mM) 2μlBCl (1mM) 2μlBCl (2mM) 2μlBCl(2.5mM) 2μlBCl (0.1mM) 2μlBCl(0.5mM) 2μlBCl (1mM) 2μlBCl (2mM) 2μlBCl (2.5mM) 2μl DMSO B 2μl DMSO 2μlBCl(0.1mM) 2μlBCl(0.5mM) 2μlBCl (1mM) 2μlBCl (2mM) 2μlBCl(2.5mM) 2μlBCl(0.1mM) 2μlBCl(0.5mM) 2μlBCl (1mM) 2μlBCl (2mM) 2μlBCl(2.5mM) 2μl DMSO C 2μl DMSO 2μlBCl(0.1mM) 2μlBCl(0.5mM) 2μlBCl (1mM) 2μlBCl (2mM) 2μlBCl(2.5mM) 2μlBCl(0.1mM) 2μlBCl(0.5mM) 2μlBCl (1mM) 2μlBCl (2mM) 2μlBCl(2.5mM) 2μl DMSO D 2μl DMSO 2μlBCl(0.1mM) 2μlBCl(0.5mM) 2μlBCl (1mM) 2μlBCl (2mM) 2μlBCl(2.5mM) 2μlBCl(0.1mM) 2μlBCl(0.5mM) 2μlBCl (1mM) 2μlBCl (2mM) 2μlBCl(2.5mM) 2μl DMSO E 2μl DMSO 2μlBCl(0.1mM) 2μlBCl(0.5mM) 2μlBCl (1mM) 2μlBCl (2mM) 2μlBCl(2.5mM) 2μlBCl(0.1mM) 2μlBCl(0.5mM) 2μlBCl (1mM) 2μlBCl (2mM) 2μlBCl(2.5mM) 2μl DMSO F 2μl DMSO 2μlBCl(0.1mM) 2μlBCl(0.5mM) 2μlBCl (1mM) 2μlBCl (2mM) 2μlBCl(2.5mM) 2μlBCl(0.1mM) 2μlBCl(0.5mM) 2μlBCl (1mM) 2μlBCl (2mM) 2μlBCl(2.5mM) 2μl DMSO G 2μl DMSO 2μlBCl(0.1mM) 2μlBCl(0.5mM) 2μlBCl (1mM) 2μlBCl (2mM) 2μlBCl(2.5mM) 2μlBCl(0.1mM) 2μlBCl(0.5mM) 2μlBCl (1mM) 2μlBCl (2mM) 2μlBCl(2.5mM) 2μl DMSO H 2μl DMSO 2μlBCl(0.1mM) 2μlBCl(0.5mM) 2μlBCl (1mM) 2μlBCl (2mM) 2μlBCl(2.5mM) 2μlBCl(0.1mM) 2μlBCl(0.5mM) 2μlBCl (1mM) 2μlBCl (2mM) 2μlBCl(2.5mM) 2μlDMSO
2) Automated imaging of 96-well plates and analysis.
Add 10μl of tricaine (0.61mM) to each well to anesthetize 30hpf embryos.
Load plate into Molecular Devices Imagexpress Ultra.
Open Metaxpress software. Choose a configuration with a 4x objective and maximum pinhole diameter, configure laser autofocus to detect plate bottom, and determine optimal Z-plane to detect regions of interest. Acquire images at excitation / emission wavelengths of 488/525 nm (GFP). Set scan area as a single site of 2000x2000 pixels (4 x 4 mm) with no binning. Configure laser power and gain such that brightest regions in positive control images do not saturate. Confirm proper image acquisition in several positive and negative control wells.
Start plate scan. The instrument will automatically acquire images from all wells and archive them in a SQL server database.
Upload images into Definiens Developer using the Cellenger application module and an import filter that recognizes image format and file structure generated by the Molecular Devices Imagexpress Ultra platform.
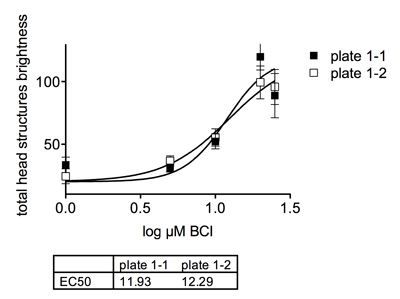
Process images with a custom designed Cognition Network Technology algorithm (also termed a ruleset). The algorithm, which we custom developed based on a recently published ruleset 2, is designed to automatically identify embryo, yolk, and head, and to quantify the brightness and area of GFP-expressing head structures. Wells in which no embryo is detected or where the head cannot be unambiguously assigned (for example, with high compound toxicity or out of focus images) are excluded from the analysis. Configure the algorithm using several negative control images (vehicle treated) and positive control images (BCI treated) such that head and yolk are correctly identified in both. Set a "head structures" detection threshold as multiples of mean yolk intensity until detection of bright head structures matches visual observation. Define parameters to export. In this example, the most informative parameter was the total integrated brightness of GFP-positive regions within the head, hereafter termed "total head structures brightness" (Figure 1).
 Figure 1Graph depicitng the dose dependent effects of BCI on GFP expression in transgenic embryos.
Run the algorithm on all plate images using the integrated job scheduler. The Definiens software uses distributed computing on several processors ("engines"), enabling simultaneous analysis of multiple images. The algorithm calculates numerical measures based on the results from the image analysis, which are saved in the database together with a copy of the processed image, with analysis applied.
Representative Results:
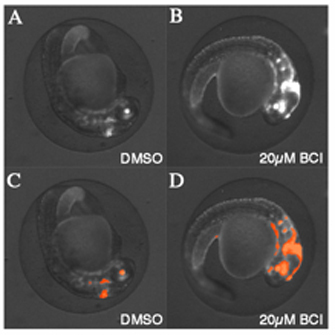
After all images are analyzed, data can be visualized within Cellenger or exported to third party software (Excel, GraphPad Prism) for further analysis and graphical representation. Figure 2 shows archived scan images from a vehicle treated and a BCI-treated well, with and without CNT analysis applied. Figure 1 documents a dose-dependent effect of BCI on GFP reporter gene expression in Tg(dusp6:d2EGFP)pt6 embryos. The concentration required to elicit a half maximal response (EC50) was approximately 12 μM.  Figure 2Automated image capture and analysis of transgenic zebrafish embryos. (A) DMSO vehicle treated Tg(dusp6:d2eGFP)pt6 embryo at 30hpf. (B) Transgenic embryos treated with 20μM BCI show increases in GFP expression. (C) Image of embryo from (A) after running Definiens ruleset to find GFP expression in the head. Orange spots denote where the software measures GFP intensity. (D) Image of embryo from (B) after running Definiens ruleset to find GFP expression in the head. Orange spots denote where the software measures GFP intensity. Note that the ruleset was able to find an expanded area of GFP expression in the treated embryo.
Discussion
A major factor limiting the throughput of zebrafish chemical screens is the lack of methodology to systematically process 96-well plates for imaging and analysis. Because images of multicellular organisms are complex, low contrast, and heterogeneous in nature, existing image analysis algorithms fail to detect and quantify specific structures within the organism. Most published zebrafish chemical screens therefore involve visual examination of individual wells by dedicated personnel throughout the procedure. This usually prevents the generation of numerical readouts and a complete archiving of screen images and data. Furthermore, manual evaluation eliminates several key advantages of image-based screening, namely the ability to conduct retrospective analyses of screen performance, to examine phenotypic changes that were not the primary focus of the screening campaign (e.g., toxicity or developmental defects) and to cross-reference screening data with past or future screens using the same compound library.
In this report we highlight methodology for automated imaging and analysis of zebrafish embryos in multiwell plates without user intervention. We automated image capture on an ImageXpress Ultra laser scanning confocal reader (Molecular Devices, Sunnyvale, CA) to image Tg(dusp6:d2EGFP)pt6 embryos in 96 well plates and developed an image analysis algorithm based on Definiens' Cognition Network Technology that quantified GFP expression in the heads of transgenic embryos. The method delivered graded responses and quantified the in vivo activity of a small molecule activator of FGF signaling. Similar results were obtained with the epifluorescence-based ArrayScan II (Cellomics Inc., Pittsburgh PA) documenting that it is possible to implement automated image capture of zebrafish embryos on a variety of commercially available plate readers 2. The development of methodology to automatically analyze multicellular organism images eliminated the need for visual scoring by a human observer and enabled the generation and archiving of numerical data and images for retrospective analysis and comparisons with future screens.
Acknowledgments
This work is funded by the NICHD/NIH (1R01HD053287) to Hukriede, NCI/NIH (P01 CA78039) to Vogt, and NHLBI/NIH (1R01HL088016) to Tsang.
References
- Molina GA, Watkins SC, Tsang M. Generation of FGF reporter transgenic zebrafish and their utility in chemical screens. BMC Dev Biol. 2007;7:62–62. doi: 10.1186/1471-213X-7-62. [DOI] [PMC free article] [PubMed] [Google Scholar]
- Vogt A. Automated image-based phenotypic analysis in zebrafish embryos. Dev Dyn. 2009;238:656–663. doi: 10.1002/dvdy.21892. [DOI] [PMC free article] [PubMed] [Google Scholar]
- Molina G. Zebrafish chemical screening reveals an inhibitor of Dusp6 that expands cardiac cell lineages. Nat Chem Biol. 2009;5:680–687. doi: 10.1038/nchembio.190. [DOI] [PMC free article] [PubMed] [Google Scholar]


