Abstract
In 3-D ultrasound imaging where 2-D transducer arrays with more than hundreds of elements are used, sparse arrays can be used to reduce the number of active ultrasound channels. Under a restriction of desired number of active channels, we can maximize the image quality by optimally choosing the positions of active elements. Here we use the method of simulated annealing to find the optimal configuration of a 2-D sparse array. This algorithm tries to minimize the value of an objective function defined as the energy ratio between the nonfocal and focal regions in the point spread function (PSF). Optimal configurations were found for the cases of choosing 16, 20, 24, 28, and 32 transmit and receive elements from a 16×16-element rectangular transducer array. With only 32 transmit and 32 receive elements, we could achieve an energy ratio of 16%, compared to 6% of the full array, which is the gold standard utilizing all the 256 elements for both transmit and receive. Using Field II, we simulated imaging with the optimal sparse arrays, for off-axis targets as well as on-axis targets, and the resulting images were compared with those from some other configurations, such as full-transmit full-receive, full-transmit x-receive, x-transmit boundary-receive, and so on.
Keywords: Simulated annealing, Sparse transducer array, Optimization, Ultrasound imaging
INTRODUCTION
In 3-D volumetric ultrasound imaging where 2-D transducer arrays with more than hundreds of elements are used, it is challenging to fabricate and interconnect as many electronic channels as the transducer elements [1], [2]. In addition, the data processing speed required in real-time imaging and the total power budget also make it difficult to use a large number of ultrasound channels [3].
In many applications, sparse arrays can be used to reduce the front-end complexity and improve the image processing speed. Since the beam pattern of an aperture is determined by its geometry, we can maximize the image quality by optimally choosing the locations of the active elements, under a restriction of desired number of active transmit and receive elements.
There have been various approaches to design sparse arrays. For example, random approaches [4]–[6], genetic algorithms [7]–[10], linear programming [11], and sparse periodic layouts [12]–[14] have been proposed as strategies for finding optimal sparse array configurations. Recently, Karaman et al. [15] developed a design method to eliminate redundancies in transmit-receive element combinations, using the concept of coarray. An alternative approach for the sparse array design is optimization by simulated annealing. This method is based on the analogy between the annealing in a solid material and the multivariate or combinatorial optimization process [16], and has produced appreciable results in previous works [17]–[21].
In this paper, we propose another application of simulated annealing algorithm for finding an optimal 2-D sparse array configuration. We defined an objective function as the energy ratio between the non-focal and focal regions in the point spread function, and implemented a simulated annealing algorithm that tries to minimize it. In each iteration of simulated annealing process, the objective function was evaluated using the Field II [22], [23] simulation results. The optimal locations of active elements were found from a 16×16-element transducer array, and we could achieve comparable image quality to that of other configurations using more number of transducers. Section II describes the methods we used, and in Section III the results of optimization are presented. The imaging simulation results with the optimal sparse arrays we found are provided in Section IV.
II. METHODS
A. Problem Definition
In the beam pattern of a sparse array, it is desirable that most of the ultrasonic energy is concentrated in the main lobe region. In other words, we want to have a point spread function (PSF) with as much energy as possible inside of the focal region, and as little energy as possible outside of that region. So our objective in this problem would be to minimize the energy ratio between the non-focal and focal regions in the PSF, by properly choosing the locations of limited number of transmit and receive elements. In summary, we define our problem as,
-
-
Find the optimal location of each transmit/receive element,
-
-
That minimizes the objective function Eout/Ein,
-
-
Subject to limited number of transmit/receive elements,
where Eout and Ein are the PSF energy in the non-focal region and in the focal region, respectively.
B. Evaluating the Objective Function
With the synthetic phased array (SPA) imaging technique, where a single transmit element is excited and all the receive elements are enabled at each firing event, an image obtained using an array of transducer elements can be considered as a sum of sub-images contributed by individual transmit-receive element pairs. Similarly, PSF of a transducer array can also be constructed by superposition of sub-PSFs of individual transmit-receive element pairs. Using Field II, sub-PSFs of all the transmit-receive element pairs from a dense 2-D rectangular array were simulated and saved. To construct the PSF of a sparse array, the sub-PSF data relevant to the configuration are read and added. And then we can obtain the values of Ein and Eout by simply integrating the PSF energy inside and outside of the focal volume, respectively, to calculate the energy ratio which is our objective function.
C. Simulated Annealing
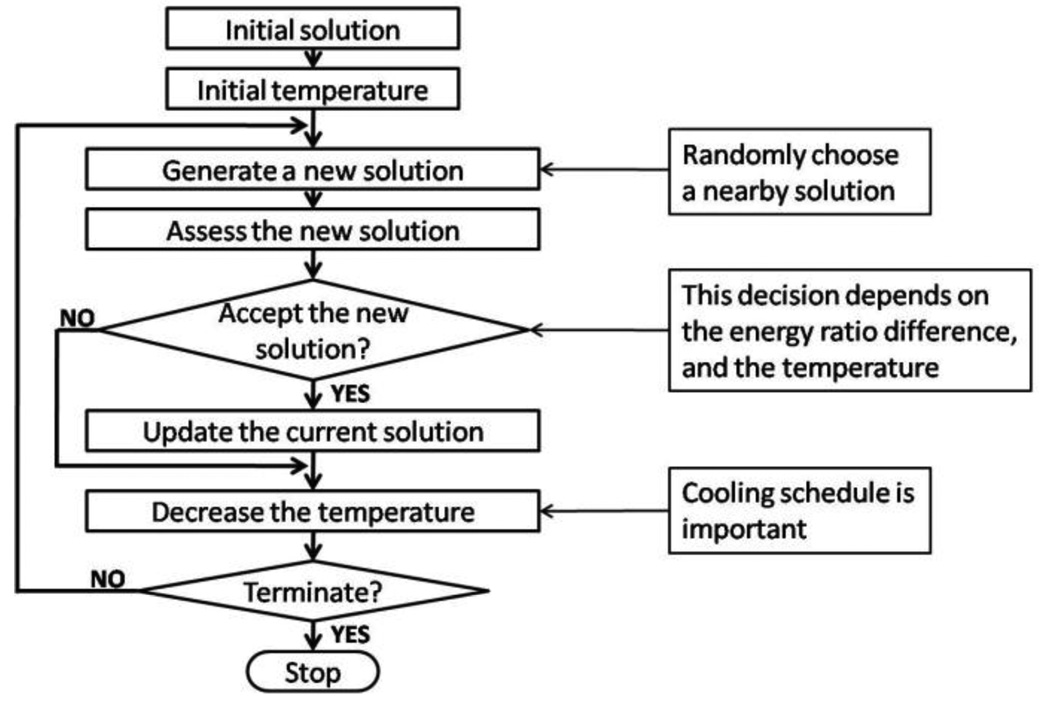
The basic algorithm of simulated annealing used in this study is shown in Fig. 1. Starting from an initial solution, which is an arbitrary sparse array configuration with required number of active transmit and receive elements, it tries to improve the solution until it finds an acceptable solution.
Figure 1.
The basic simulated annealing algorithm.
In each iteration, it perturbates the current solution, by randomly selecting one transmit or receive element, and moving it to one of its nearby positions. Since we are moving only one element at a time, the PSF of the new aperture can be quickly calculated from the PSF of the previous aperture, by replacing the contribution of the eliminated element with that of the new element, instead of recalculating the PSF from scratch.
The acceptance decision is based on the objective function value calculated from the PSF, and the current temperature. Denoting the energy ratio of the new solution by F(Sn), the energy ratio of the previous solution by F(Sn−1), and the current temperature by T, we defined our acceptance probability function P(ΔF(S), T) as
| (1) |
where
| (2) |
Thus, if the new solution is better than the previous solution, i.e., if the new energy ratio is smaller than the previous one, the new solution is always accepted. On the other hand, if the new solution has an energy ratio larger than the previous energy ratio, the new solution is accepted with probability of P(ΔF(S), T). The smaller ΔF(S) is, and the higher the temperature is, it is more likely that the new solution is accepted, even though it is worse than the previous solution. So at high temperature, the algorithm can easily escape from a local minimum.
At the end of each iteration, we decrease the temperature, making it harder for a worse solution to be accepted. The cooling schedule is determined by the cooling factor, α. With the initial temperature T0, the temperature becomes, after i iterations,
| (3) |
We can give more chances of finding the global optimum by cooling down slowly, but it also slows down the convergence of the solution. So the cooling schedule must be chosen carefully.
III. RESULTS
Assuming a 2-D 16×16-element rectangular transducer array, we implemented the simulated annealing algorithm to find the optimal sparse array configurations with 16, 20, 24, 28, and 32 active transmit and receive elements. The parameters used in the PSF simulation are listed in Table I. To simplify the problem, the symmetry of the aperture was assumed in both horizontal and vertical directions. Also, in order to reduce the front-end electronics complexity, we required that no element is used for both transmit and receive.
TABLE I.
Simulation Parameters
| Parameter | VALUE |
|---|---|
| Array size | 16×16 elements |
| Center frequency | 10 MHz |
| Fractional bandwidth (FBW) | 80% |
| Element pitch | 60 µm |
| Element size | 50 µm × 50 µm |
| Kerf | 10 µm |
| Excitation pulse | Gaussian pulse with 80% FBW |
| Sampling frequency | 100 MHz |
| Point target location | On axis, with F number of 4 (3.8 mm) |
| Scan volume | 9 mm × 9 mm × 4.2 mm |
| Focal volume | 1.1 mm × 1.1 mm × 0.18 mm |
| Voxel size | 100 µm × 100 µm × 20 µm |
| Ultrasound velocity | 1540 m/sec |
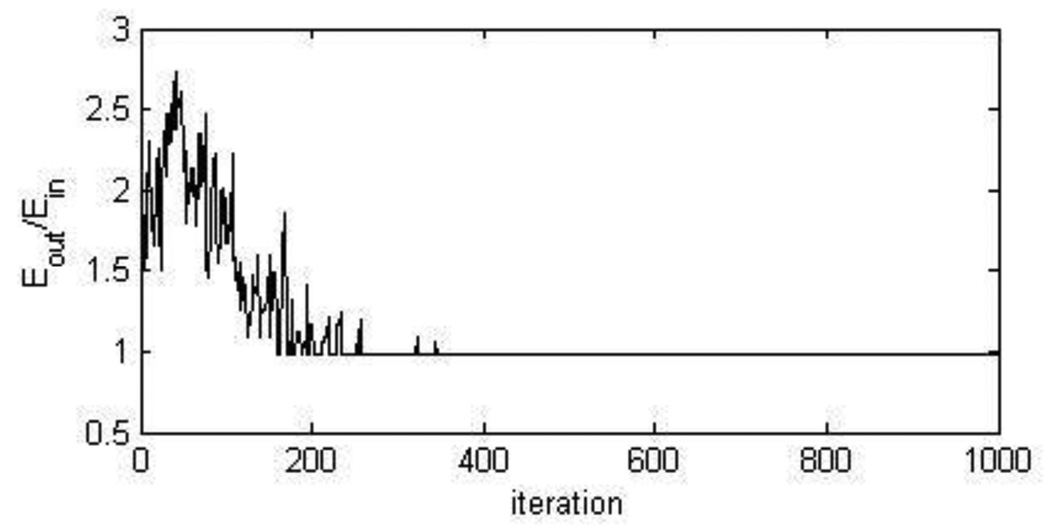
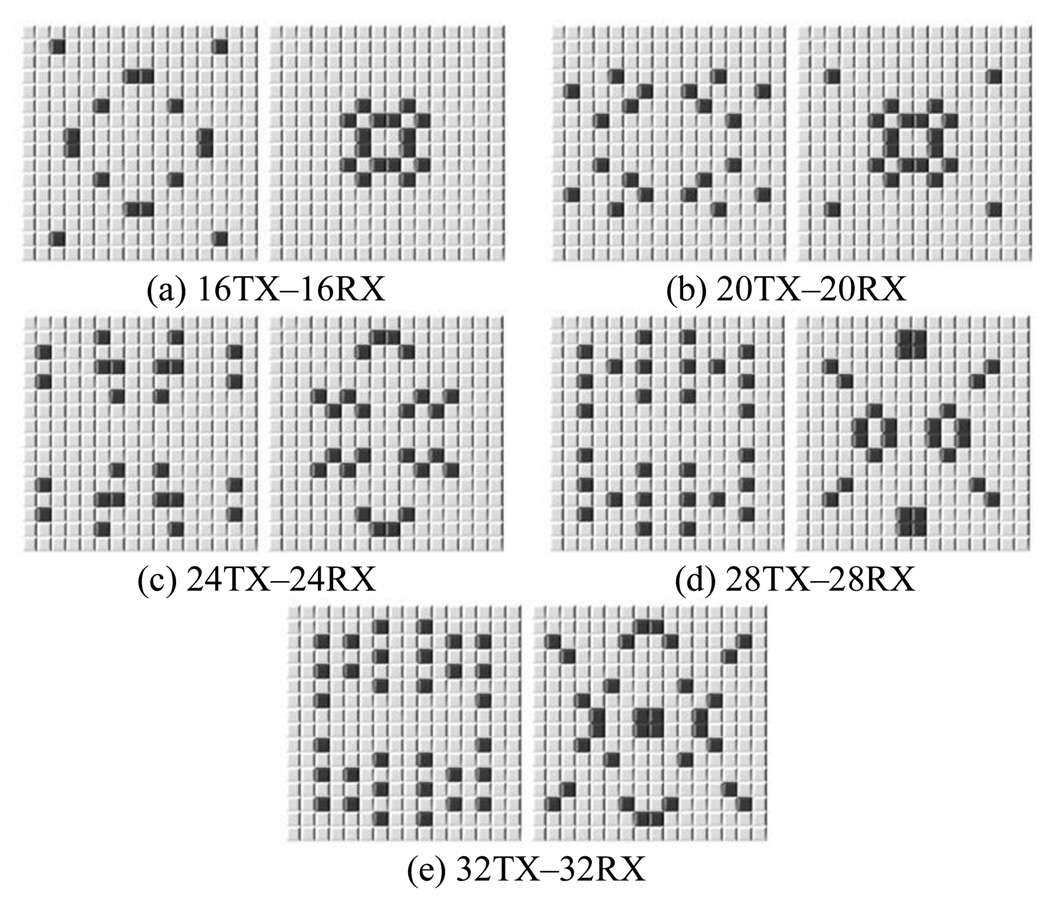
For the case of choosing 16 transmit and 16 receive elements out of 16×16 locations, the solution converges within 500 iterations (Fig. 2), with initial temperature of 1.0 and cooling factor of 0.99. The solution found in the first run of simulated annealing may not be, and usually is not, the best solution. However, it provides us a reasonably good solution in a short time, and this configuration can be used as a good starting point for another run of simulated annealing. We ran the optimization process multiple times for each problem, using the last solution as the initial configuration for the next run, and found that the solution does not improve after only a few runs. The optimal configurations found using this method are summarized in Fig. 3. It required 3 to 5 runs to reach each of these configurations. The energy ratios of these apertures are listed in Table II.
Figure 2.
Convergence of the solution. In a problem finding 16 transmit and 16 receive elements, it converges within 500 iterations.
Figure 3.
Optimal sparse array configurations (left: TX apertures, right: RX apertures) found by simulated annealing.
TABLE II.
Energy Ratio of the Optimal Sparse Arrays
| Aperture | Number of TX elements |
Number of RX elements |
Energy Ratio |
|---|---|---|---|
| 16TX–16RX | 16 | 16 | 0.4427 |
| 20TX–20RX | 20 | 20 | 0.3331 |
| 24TX–24RX | 24 | 24 | 0.2450 |
| 28TX–28RX | 28 | 28 | 0.2123 |
| 32TX–32RX | 32 | 32 | 0.1613 |
In Table III, the energy ratios of some other apertures introduced in [15] are shown for comparison. To make the comparison fair, the same synthetic phased array (SPA) imaging technique was used for all of these apertures. So, the full transmit and full receive (FT–FR) aperture here differs from the CPA or CSA in [15], using a different imaging technique. The apertures with –NC in their names are those with no common elements between the transmit and the receive apertures.
TABLE III.
Energy Ratio of the Apertures from [15]
| Aperture | Number of TX elements |
Number of RX elements |
Energy Ratio |
|---|---|---|---|
| FT–FR | 256 | 256 | 0.0563 |
| FT–XR–NC | 224 | 32 | 0.0955 |
| XT–BR | 32 | 60 | 0.1712 |
| XT–BR–NC | 28 | 60 | 0.1870 |
| XT–PR | 32 | 60 | 0.2117 |
| XT–PR–NC | 32 | 56 | 0.3113 |
| BRT–BCR | 32 | 32 | 0.3252 |
| BRT–BCR–NC | 28 | 32 | 0.3736 |
–NC: No common element between TX and RX
IV. IMAGING SIMULATIONS
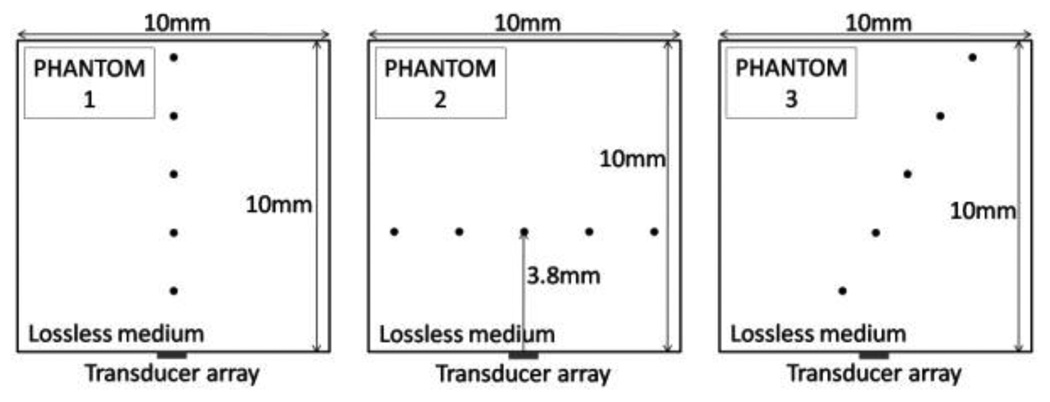
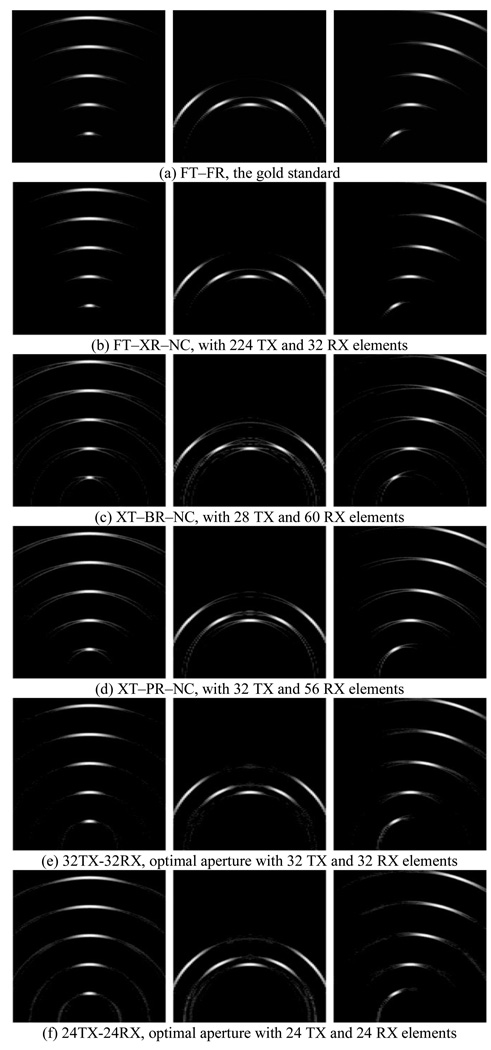
Using Field II program, we simulated imaging with the optimal sparse array configurations found by our method. Three phantoms (Fig. 4), each with 5 point targets in a lossless medium, were used to see the imaging capability of these apertures for both on-axis and off-axis targets. For comparison, the same simulations were also done with the other apertures.
Figure 4.
Three phantoms used in imaging simulations.
The simulation results show that our optimal configurations have comparable imaging capability, in a noiseless environment, to the other apertures using more number of active elements. Some of the simulation results are presented in Fig. 5.
Figure 5.
Some of the imaging simulation results. (e) and (f) are the images obtained with the optimal configurations found by simulated annealing, and (a)–(d) are from the other apertures. The display dynamic range is 40 dB.
V. CONCLUSIONS AND FUTURE WORKS
Using the method of simulated annealing, we implemented an optimization algorithm for choosing the locations of a limited number of active elements to obtain beam profiles that are comparable to those of other configurations that use a larger number of transducers. The optimal sparse array configurations were found for the cases of choosing 16, 20, 24, 28, and 32 transmit and receive elements from a 16×16-element 2-D array, and their imaging capability was examined by Field II simulations. The imaging simulation results showed that, in a noiseless environment we can achieve acceptable image quality while using only a small number of transducers.
Although sparse arrays and synthetic beamforming techniques help with the frame rate and hardware complexity, it is well known that they suffer from low SNR. One way of improving the SNR is using coded excitation [24], [25]. Currently, we are extending the presented approach to an overall system optimization for 2-D sparse arrays by including element apodization and coded excitation into consideration.
ACKNOWLEDGMENT
This work was supported by the National Institutes of Health (NIH) under grant 5R01CA134720.
REFERENCES
- 1.Oralkan O, Ergun AS, Cheng CH, Johnson JA, Karaman M, Lee TH, Khuri-Yakub BT. Volumetric ultrasound imaging using 2-D CMUT arrays. IEEE Trans. Ultrasonics Ferroelectrics and Frequency Control. 2003 Nov.vol. 50(no. 11):1581–1594. doi: 10.1109/tuffc.2003.1251142. [DOI] [PubMed] [Google Scholar]
- 2.Wygant IO, Zhuang X, Yeh DT, Vaithilingam S, Nikoozadeh A, Oralkan O, Ergun AS, Karaman M, Khuri-Yakub BT. An endoscopic imaging system based on a two-dimensional cMUT array: real-time imaging results; Proc. IEEE Ultrason. Symp., Rotterdam, Netherlands; 2005. Sept., pp. 792–795. [Google Scholar]
- 3.Brunner E. How ultrasound system considerations influence front-end component choice. Analog Dialogue. 2002 May–Jul.vol. 36(no. 3):1–4. [Google Scholar]
- 4.Turnbull DH, Foster FS. Beam steering with pulsed two-dimensional transducer arrays. IEEE Trans. Ultrasonics, Ferroelectrics and Frequency Control. 1991;vol. 38(no. 4):320–333. doi: 10.1109/58.84270. [DOI] [PubMed] [Google Scholar]
- 5.Turnbull DH, Lum PK, Kerr AT, Foster FS. Simulation of B-scan images from two-dimensional transducer arrays: Part I — Methods and quantitative contrast measurements. Ultrasonic Imaging. 1992 Oct.vol. 14:323–343. doi: 10.1177/016173469201400401. [DOI] [PubMed] [Google Scholar]
- 6.Davidsen RE, Jensen JA, Smith SW. Two-dimensional random arrays for real-time volumetric imaging. Ultrasonic Imaging. 1994;vol. 16:143–163. doi: 10.1177/016173469401600301. [DOI] [PubMed] [Google Scholar]
- 7.Weber PK, Schmitt RM, Tylkowski BD, Steck J. Optimization of random sparse 2-D transducer arrays for 3-D electronic beam steering and focusing; Proc. IEEE Ultrason. Symp; 1994. pp. 1503–1506. [Google Scholar]
- 8.Austeng A, Holm S, Weber P, Aakvaag N, Iranpour K. 1D and 2D algorithmically optimized sparse arrays; Proc. IEEE Ultrason. Symp; 1997. pp. 1683–1686. [Google Scholar]
- 9.Weber PK, Austeng A, Holm S, Aakvaag ND. 1D and 2D sparse array optimization. Instrumentation Sci. & Technol. 1999 Aug.vol. 27:235–246. [Google Scholar]
- 10.Holm S, Austeng A, Iranpour K, Hopperstad J-F. Sparse sampling in array processing, ch. 19. In: Marvasti F, editor. Sampling Theory and Practice. New York: Plenum; 2001. [Google Scholar]
- 11.Holm S, Elgetun B, Dahl G. Weight- and Layout-Optimized Sparse Arrays; Proc. Int. Workshop Sampling Theory Appl; 1997. Jun., pp. 97–102. [Google Scholar]
- 12.Lockwood GR, Li P-C, O’Donnell M, Foster FS. Optimizing the radiation pattern of sparse periodic linear arrays. IEEE Trans. Ultrasonics, Ferroelectrics and Frequency Control. 1996 Jan.vol. 43:7–14. [Google Scholar]
- 13.Lockwood GR, Foster FS. Optimizing the radiation pattern of sparse periodic two-dimensional arrays. IEEE Trans. Ultrasonics, Ferroelectrics and Frequency Control. 1996 Jan.vol. 43:15–19. [Google Scholar]
- 14.Austeng A, Holm S. Sparse 2-D arrays for 3-D phased array imaging—Design methods. IEEE Trans. Ultrasonics, Ferroelectrics and Frequency Control. 2002 Aug.vol. 49(no. 8):1073–1086. doi: 10.1109/tuffc.2002.1026019. [DOI] [PubMed] [Google Scholar]
- 15.Karamen M, Wygant IO, Oralkan O, Khuri-Yakub BT. Minimally redundant 2-D array designs for 3-D medical ultrasound imaging. IEEE Trans. Medical Imaging. 2009 Jul.vol. 28(no. 7):1051–1061. doi: 10.1109/TMI.2008.2010936. [DOI] [PubMed] [Google Scholar]
- 16.Kirkpatrick S, Gellatt CD, Jr., Vecchi MP. Optimization by simulated annealing. Science. 1983;vol. 220(no. 4598):671–680. doi: 10.1126/science.220.4598.671. [DOI] [PubMed] [Google Scholar]
- 17.Murino V, Trucco A, Regazzoni CS. Synthesis of unequally spaced arrays by simulated annealing. IEEE Trans. Signal Processing. 1996 Jan.vol. 44:119–123. [Google Scholar]
- 18.Trucco A, Repetto F. A stochastic approach to optimizing the aperture and the number of elements of an aperiodic array; Proc. OCEANS ’96; 1996. Sept., pp. 1510–1515. [Google Scholar]
- 19.Trucco A. Thinning and weighting of large planar arrays by simulated annealing. IEEE Trans. Ultrasonics, Ferroelectrics and Frequency Control. 1999 Mar.vol. 46(no. 2):374–355. doi: 10.1109/58.753023. [DOI] [PubMed] [Google Scholar]
- 20.Hopperstad JF, Holm S. Optimization of sparse arrays by an improved simulated annealing algorithm; Proc. Int. Workshop on Sampling Theory and Applications, Loen, Norway; 1999. Aug., pp. 91–95. [Google Scholar]
- 21.Nikolov M, Behar V. Analysis and optimization of synthetic aperture ultrasound imaging using the effective aperture approach. International Journal “Information Theories & Applications,”. 2005;vol. 12:257–265. [Google Scholar]
- 22.Jensen JA. Field: A Program for Simulating Ultrasound Systems; the 10th Nordic-Baltic Conference on Biomedical Imaging Published in Medical & Biological Engineering & Computing; 1996. pp. 351–353. [Google Scholar]
- 23.Jensen JA, Svendsen NB. Calculation of pressure fields from arbitrarily shaped, apodized, and excited ultrasound transducers. IEEE IEEE Trans. Ultrasonics, Ferroelectrics and Frequency Control. 1992;vol. 39:262–267. doi: 10.1109/58.139123. [DOI] [PubMed] [Google Scholar]
- 24.Chiao RY, Thomas LJ, Silverstein SD. Sparse array imaging with spatially-encoded transmits; Proc. IEEE Ultrason. Symp; 1997. Oct., pp. 1679–1682. [Google Scholar]
- 25.Misaridis TX, Jensen JA. Space–time encoding for high frame rate ultrasound imaging. Ultrasonics. 2002 May;vol. 40(no. 1):593–597. doi: 10.1016/s0041-624x(02)00179-8. [DOI] [PubMed] [Google Scholar]


