

Abstract
Background
Hypertension is common in hemodialysis patients; however, the relationship between interdialytic weight gain (IDWG) and blood pressure (BP) is incompletely characterized. This study seeks to define the relationship between IDWG and BP in prevalent hemodialysis subjects.
Study Design, Setting, & Participants
This study used data from 32,295 dialysis sessions in 442 subjects followed up for 6 months in the Crit-Line Intradialytic Monitoring Benefit (CLIMB) Study.
Outcomes & Measurements
Mixed linear regression was used to analyze the relationship between percentage of IDWG (IDWG [%] = [current predialysis weight – previous postdialysis weight]/dry weight * 100) as the independent variable and systolic BP (SBP) and predialysis – postdialysis SBP (ΔSBP) as dependent variables.
Results
In unadjusted analyses, every 1% increase in percentage of IDWG was associated with a 1.00 mm Hg (95% confidence interval [CI], ± 0.24) increase in predialysis SBP (P < 0.0001), 0.65 mm Hg (95% CI, ±0.24) decrease in postdialysis SBP (P < 0.0001), and 1.66 mm Hg (95% CI, ±0.25) increase in ΔSBP (P < 0.0001). After controlling for other significant predictors of SBP, every 1% increase in percentage of IDWG was associated with a 1.00 mm Hg (95% CI, ±0.24) increase in predialysis SBP (P < 0.0001) and a 1.08 mm Hg (95% CI, ±0.22) increase in ΔSBP with hemodialysis (P < 0.0001). However, in subjects with diabetes as the cause of end-stage renal disease, subjects with lower creatinine levels, and older subjects, the magnitude of the association between percentage of IDWG and predialysis SBP was less pronounced. The magnitude of percentage of IDWG on ΔSBP was less pronounced in younger subjects and subjects with lower dry weights. Results were similar with diastolic BP.
Limitations
Hemodialysis BP measurements are imprecise estimates of BP and true hemodynamic burden in dialysis subjects.
Conclusions
In prevalent hemodialysis subjects, increasing percentage of IDWG is associated with increases in predialysis BP and BP changes with hemodialysis; however, the magnitude of the relationship is modest and modified by other clinical factors. Thus, although overall volume status may impact on BP to a greater extent, day-to-day variations in weight gain have a modest role in BP increases in prevalent subjects with end-stage renal disease.
INDEX WORDS: Interdialytic weight gain, blood pressure, hemodialysis
Hypertension is common and often difficult to manage in patients with end-stage renal disease (ESRD) treated with hemodialysis.1 The cause of hypertension in patients with ESRD is multifactorial,2 but the direct relationship between volume status and blood pressure (BP) has long been recognized.3,4 However, the extent to which day-to-day volume affects BP in patients with ESRD remains controversial.
Although both interdialytic weight gain (IDWG) and BP were linked to all-cause mortality, 5-12 the nature of the relationship between these parameters remains uncertain.2,10,13-20 Although total body volume overload likely has a significant role in hypertension in patients with ESRD, the association between day-to-day volume intake (reflected by IDWG) and BP is less clear. Whereas the available epidemiological evidence suggested that moderate hypertension likely was well tolerated in hemodialysis patients,5,9,11,12,21 the relationship between BP and outcomes is confounded by such factors as day-to-day variations in fluid intake that are associated with nutritional status and subsequent clinical outcomes. 10,21-25 Thus, defining the independent relationship between IDWG and BP has important clinical implications.
Herein, we undertook a secondary analysis of the Crit-Line Intradialytic Monitoring Benefit (CLIMB) Study to define the independent association between percentage of IDWG and BP while controlling for nutritional and demographic characteristics previously shown to affect BP. We also sought to identify clinical or demographic characteristics that modify this association in an attempt to find a clinical cohort in whom BP is less intimately linked with day-to-day volume changes.
METHODS
Patient Population
Subjects available for this analysis included 443 hemodialysis patients enrolled in the CLIMB Study.26 Methods, baseline characteristics, and results of the CLIMB Study were reported previously.26 Entry criteria included age between 18 and 85 years, ESRD duration for 2 months or longer, and treatment with in-center hemodialysis 3 times weekly. Exclusion criteria included BP not measurable by means of standard techniques, active gastrointestinal bleed, severe malnutrition (albumin level < 2.6 g/dL [<26 g/L]), active hematologic disease, patient expected to be unavailable because of moving or living donor renal transplantation, malignancy requiring chemotherapy, and inability to provide informed consent. The institutional review board at each of the 6 participating centers approved the original study protocol, and the Duke University Institutional Review Board approved this analysis.
Study Overview and Measurements
The purpose of the CLIMB Study was to determine whether use of a blood volume monitoring device (Crit-Line; Hema Metrics Inc [formerly In-Line Diagnostics], Kaysville, UT) could decrease hospitalization rates compared with usual care. Before randomization, Crit-Line was added to the hemodialysis circuit of all enrolled patients to generate an intradialytic intravascular volume profile based on change in hematocrit. Patients subsequently were randomly assigned to conventional clinical care or clinical care with the use of Crit-Line to help guide ultrafiltration. However, the device is an open-loop system and any interventions or changes to the care of the patient were left to the discretion of the treating nephrologists or nurse. Management of BP was independent of the blood volume monitor and not an aspect of the trial. During the course of the 6-month trial, there were no differences between groups in predialysis or postdialysis BP measurements, IDWG, estimated dry weight, intradialytic complications, or antihypertensive therapy.
The following parameters were recorded at baseline and are available for this analysis: demographics (race, age, and sex), duration of dialysis (defined as dialysis therapy for <1 or ≥1 year), tobacco use (ongoing or use in the past 10 years versus quit >10 years ago or never used), use of erythropoietin, and past medical history, including cause of ESRD (diabetes or other), as well as history of diabetes mellitus, hypertension, bilateral nephrectomy, peripheral vascular disease, chronic obstructive pulmonary disease, coronary artery disease, congestive heart failure, cerebrovascular disease, arrhythmia, malignancy, and left ventricular hypertrophy.
Antihypertensive medication use and routine laboratory data were collected at baseline and monthly intervals. Subjects were not instructed to change the timing of their antihypertensive medications, and some subjects may have routinely used their BP medications before or after hemodialysis. Subjects were seen thrice weekly during routine hemodialysis, and the following values were recorded and available for this analysis: predialysis and postdialysis sitting BP, predialysis and postdialysis weight, and target dry weight (determined by the treating nephrologists). BP parameters were obtained after the subject was at rest for 5 minutes by dialysis nurses trained at each individual dialysis unit. BP was obtained using an automatic device in the nonaccess upper arm of the subject per usual care.
Outcomes and Definitions
Primary outcome variables of interest are predialysis systolic BP (SBP) and change in (Δ) SBP. Secondary measures include predialysis diastolic BP (DBP) and ΔDBP. The following definitions were used for this analysis. ΔSBP and ΔDBP are predialysis BP – postdialysis BP. Percentage of IDWG = ([current predialysis weight (kg) – previous postdialysis weight (kg)/target dry weight (kg)]) * 100.6,7,10
Statistical Analysis
A total of 32,425 individual dialysis sessions in the 443 study participants during the 6-month study period were available for these analyses. Because of missing data for either IDWG (n = 117) or predialysis or postdialysis SBP (n = 14), 32,295 dialysis sessions from 442 individuals were used. One subject was removed because of lack of available information after enrollment.
Associations between percentage of IDWG and BP parameters were estimated by using generalized linear regression (SAS PROC Mixed; SAS Institute, Cary, NC) with a compound symmetry covariance structure.27 This method allows for variables to change over time within an individual while still controlling for patient effect. To minimize bias associated with erroneous covariance structure choice, SEs (and confidence intervals [CIs]) were generated empirically, rather than model based.
Initially, bivariate analyses were performed to independently identify variables associated with SBP, ΔSBP, DBP, and ΔDBP. Factors significant in bivariate analysis with P less than 0.10 or deemed clinically relevant were entered into a multivariable model to describe the relationship between percentage of IDWG and BP for each dialysis session while clustering on individuals and controlling for clinical and demographic characteristics. BP parameters, percentage of IDWG, laboratory variables, and dry weight were allowed to change within an individual in these analyses. For time-dependent variables, we used the baseline (current) value and carried it forward until a new value was generated (laboratory variables changed monthly, weight gain and BP changed with every dialysis session). Treatment group, age, and cause of ESRD were forced into all models. Backward selection was used with P greater than 0.10 as exclusion criteria for the final model.
Interactions between percentage of IDWG and clinical parameters (age, race, dry weight, SBP, diabetes mellitus as cause of ESRD, and serum creatinine level) were individually added to the main-effects model to determine whether the effect of percentage of IDWG on BP was modified by other clinical characteristics. Additional analyses were performed stratifying on values of variables that interacted significantly with percentage of IDWG and incorporating all variables associated with the predictor variable from the main-effects model. For categorical variables, the relationship between percentage of IDWG and the predictor variable was stratified based on the presence or absence of the condition. For continuous variables (such as age), the relationship between percentage of IDWG and the predictor variable was stratified among quartiles of the variable of interest.
Before model development, we verified Gaussian distributions of continuous variables and transformed non–normally distributed variables into categorical variables. To verify model assumptions, we performed routine regression diagnostics that assessed normality, linearity, homogeneity of variance, and influence. Model results are summarized by using parameter estimates and 95% CIs. All P reported are 2 sided, and statistical significance is defined as P less than 0.05. All statistical analyses were performed using SAS (version 9.1).
RESULTS
Baseline Characteristics
Four hundred forty-two subjects who underwent 32,295 dialysis sessions were included in this analysis. Overall, study subjects had a mean age of 59.1 years, 51% were men, 35% were black, 59% were white, and 45% had diabetes mellitus (Table 1).
Table 1.
Clinical and Demographic Characteristics of Prevalent Hemodialysis Subjects at Baseline
| Variable | N = 442 |
| Age (y) | 59.1 ± 15.7 |
| Sex (% men) | 51.1 |
| Race (%) | |
| White | 59.1 |
| Black | 34.8 |
| Other | 6.1 |
| Hispanic ethnicity (v non-Hispanic) (%) | 2.7 |
| Tobacco use (v nonuse) (%) | 31.2 |
| Diabetes mellitus (v no diabetes) (%) | 44.9 |
| Diabetes as cause of ESRD (v other) (%) | 30.5 |
| Hypertension (%) | 89.2 |
| Arrhythmia (%) | 18.0 |
| Coronary artery disease (%) | 30.0 |
| Congestive heart disease (%) | 20.9 |
| Left ventricular hypertrophy (%) | 41.1 |
| Peripheral vascular disease (%) | 19.7 |
| Cerebrovascular disease (%) | 18.2 |
| Chronic obstructive pulmonary disease (%) | 12.6 |
| Malignancy (%) | 8.6 |
| Blood pressure (mm Hg)* | |
| Predialysis | |
| Systolic | 148.8 ± 25.1 |
| Diastolic | 78.6 ± 15.7 |
| Postdialysis | |
| Systolic | 137.8 ± 25.6 |
| Diastolic | 73.0 ± 14.3 |
| Change in systolic blood pressure | 10.9 ± 25.0 |
| Interdialytic weight gain (%) | 3.8 ± 1.7 |
| Dry weight (kg) | 76.8 ± 20.2 |
| Baseline laboratory data | |
| Albumin (g/dL) | 3.7 ± 0.5 |
| Creatinine (mg/dL) | 9.2 ± 3.2 |
| Antihypertensive medications (v no antihypertensive use) (%) | 76.1 |
| No. of antihypertensive medications | 1.5 ± 1.1 |
| Antihypertensive class (% use) | |
| ACE inhibitors | 30.0 |
| α-Blocker | 5.0 |
| β-Blocker | 34.3 |
| Calcium channel blocker | 39.3 |
| Diuretic | 3.9 |
| Nitrate | 15.5 |
| Vasodilator | 18.9 |
| Epoetin use (v nonuse) (%) | 89.6 |
| Duration of dialysis (y) | 2.1 (0.3-10.3) |
| Access type (%) | |
| Arteriovenous fistula | 34.3 |
| Arteriovenous graft | 43.6 |
| Catheter | 22.1 |
| Treatment group (v usual care) (%) | 51.3 |
Note: Values expressed as mean ± SD, percent, or median (5% to 95% interquartile range). To convert serum albumin in g/dL to g/L, multiply by 10; creatinine in mg/dL to mmol/L, multiply by 88.4.
Abbreviations: ACE, angiotensin-converting enzyme; ESRD, end-stage renal disease.
Obtained as an average of blood pressure recordings from 4 dialysis sessions during enrollment.
Systolic Blood Pressure
Relationship Between Percentage of IDWG and SBP Parameters
In bivariate analysis, percentage of IDWG was associated significantly with various BP parameters. Increased percentage of IDWG (per 1% as an independent variable) was associated with increased predialysis SBP (1.0 mm Hg; 95% CI, 0.76 to 1.24; P < 0.0001; Table 2; Fig 1), decreased postdialysis SBP (−0.65 mm Hg; 95% CI, −0.41 to −0.89; P < 0.0001), and increased ΔSBP (1.66 mm Hg; 95% CI, 1.41 to 1.91; P < 0.0001; Table 3; Fig 2). However, the magnitude of the effect of percentage of IDWG on BP, based on the slope of change, was most pronounced for ΔSBP. For example, every 1% increase in percentage of IDWG was associated with a 1.66 mm Hg increase in ΔSBP (ie, a greater decrease in SBP from predialysis to postdialysis). Relationships between percentage of IDWG and SBP and ΔSBP are visualized by means of a scatter plot in Figs 1 and 2, respectively.
Table 2.
Bivariate and Multivariable Predictors of Predialysis Systolic Blood Pressure in Prevalent Hemodialysis Patients
| Variable | Bivariate Parameter Estimate of Slope (mm Hg) | P | Multivariable Parameter Estimate of Slope (mm Hg) | P |
|---|---|---|---|---|
| %IDWG (/1% increase) | 1.00 ± 0.24 | <0.0001 | 1.00 ± 0.24 | <0.0001 |
| Dry weight (/1 kg increase) | 0.29 ± 0.12 | <0.0001 | 0.26 ± 0.12 | <0.0001 |
| Left ventricular hypertrophy | 8.2 ± 3.4 | <0.0001 | 8.9 ± 1.8 | <0.0001 |
| Hypertension | 11.7 ± 6.6 | 0.0005 | 7.2 ± 6.0 | 0.02 |
| Diabetes as cause of ESRD | 6.9 ± 3.7 | 0.0003 | 2.7 ± 3.7 | 0.2 |
| Erythropoietin use | 10.1 ± 6.1 | 0.001 | 7.7 ± 5.5 | 0.006 |
| DM | 5.1 ± 3.5 | 0.004 | * | Not significant |
| Black race (v nonblack) | 5.2 ± 3.4 | 0.004 | 3.7 ± 4.0 | 0.08 |
| Hispanic ethnicity | 11.1 ± 8.8 | 0.01 | 11.5 ± 6.6 | 0.0007 |
| Arrhythmia | −7.9 ± 4.9 | 0.002 | −6.9 ± 5.0 | 0.008 |
| Creatinine (/1 mg/dL increase) | −0.4 ± 0.41 | 0.06 | −0.46 ± 0.43 | 0.04 |
| Age (/1 y increase) | −0.05 ± 0.12 | 0.5 | 0.03 ± 0.12 | 0.6 |
| Treatment group | 2.0 ± 3.5 | 0.3 | 1.4 ± 3.4 | 0.4 |
| Interaction terms | ||||
| %IDWG * DM as cause of ESRD | 0.04 | |||
| %IDWG * creatinine | 0.0002 | |||
| %IDWG * age | 0.04 | |||
| %IDWG * dry weight | 0.6 | |||
| %IDWG * black race | 0.3 |
Note: Values expressed as number ± 95% confidence interval. Nonsignificant predictors of systolic blood pressure in bivariate analyses included sex; duration of dialysis therapy; tobacco use; antihypertensive class (angiotensin-converting enzyme inhibitor, β-blocker, calcium channel blocker); history of bilateral nephrectomy, coronary artery disease, congestive heart disease, cerebrovascular disease, chronic obstructive pulmonary disease, or peripheral vascular disease; serum albumin level; or a history of medical noncompliance. Because of missing data, 408 patients and 28,803 dialysis sessions are included in the multivariate analysis.
Abbreviations: %IDWG, percentage of interdialytic weight gain; DM, diabetes mellitus; ESRD, end-stage renal disease.
Removed from the final multivariate model with P > 0.10. Treatment group, DM as cause of ESRD, and age were forced into all final models.
Figure 1.
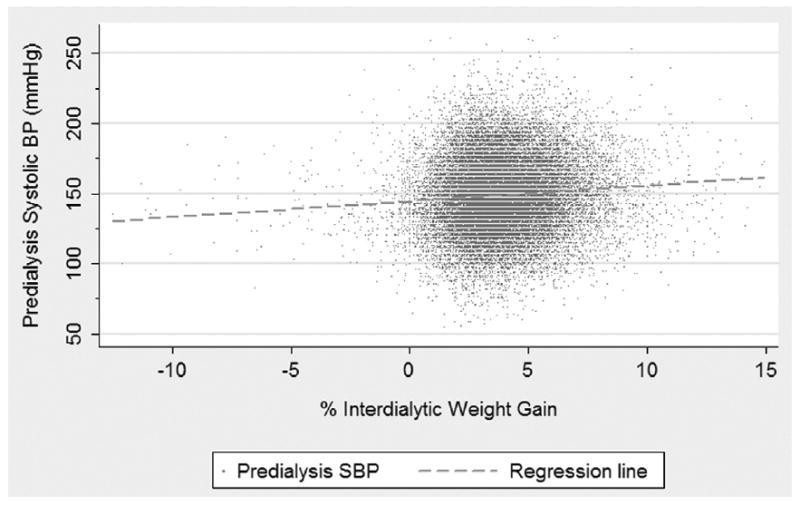
Scatter plot and regression line of the relationship between percentage of interdialytic weight gain (%IDWG) and predialysis systolic (SBP) blood pressure; [Predialysis SBP = Intercept + 1.00 (±0.24) * %IDWG].
Table 3.
Bivariate and Multivariable Predictors of Change in SBP in Prevalent Hemodialysis Patients
| Variable | Bivariate Slope Parameter Estimate (mm Hg) | P | Multivariable Slope Parameter Estimate (mm Hg) | P |
|---|---|---|---|---|
| IDWG (/1% increase) | 1.66 ± 0.25 | <0.0001 | 1.08 ± 0.22 | <0.0001 |
| Predialysis SBP (/1 mm Hg increase) | 0.70 ± 0.02 | <0.0001 | 0.70 ± 0.022 | <0.0001 |
| Dry weight (/1 kg increase) | 0.13 ± 0.07 | 0.0005 | −0.08 ± 0.09 | 0.07 |
| Creatinine (/1 mg/dL increase) | 0.45 ± 0.25 | 0.003 | 0.58 ± 0.33 | 0.001 |
| Diabetes as cause ESRD | 4.7 ± 2.9 | 0.002 | 1.51 ± 3.0 | 0.3 |
| Left ventricular hypertrophy | 4.2 ± 2.6 | 0.002 | * | Not significant |
| Hispanic ethnicity | 11.8 ± 8.3 | 0.006 | * | Not significant |
| DM | 2.9 ± 2.6 | 0.03 | * | Not significant |
| Black race (v nonblack) | 3.04 ± 2.7 | 0.03 | −3.60 ± 3.1 | 0.02 |
| Albumin (/1 g/dL increase) | 2.6 ± 2.2 | 0.02 | 2.27 ± 2.2 | 0.05 |
| Age (/1 y increase) | −0.19 ± 0.08 | <0.0001 | −0.13 ± 0.09 | 0.007 |
| Treatment group | 0.74 ± 2.5 | 0.6 | −0.73 ± 2.7 | 0.5 |
| Coronary artery disease | 2.4 ± 2.9 | 0.1 | * | Not significant |
| Interaction terms | ||||
| %IDWG * age | 0.008 | |||
| %IDWG * dry weight | 0.05 | |||
| %IDWG * DM as cause of ESRD | 0.2 | |||
| %IDWG * predialysis SBP | 0.5 | |||
| %IDWG * black race | 0.9 | |||
| %IDWG * serum creatinine | 0.6 |
Note: Values expressed as number ± 95% confidence interval. Nonsignificant predictors of change in SBP in bivariate analyses included sex; duration of dialysis therapy; tobacco use; antihypertensive class (angiotensin-converting enzyme inhibitor, β-blocker, calcium channel blocker); history of bilateral nephrectomy, arrhythmia, chronic obstructive pulmonary disease, congestive heart disease, cerebrovascular disease, hypertension, or peripheral vascular disease; erythropoietin use; or a history of medical noncompliance. Because of missing data, 418 patients and 29,369 dialysis sessions are included in this model.
Abbreviations: %IDWG, percentage of interdialytic weight gain; SBP, systolic blood pressure; DM, diabetes mellitus; ESRD, end-stage renal disease.
Removed from the final multivariate model with P > 0.10. Treatment group, DM as cause of ESRD, and age were forced into the final models.
Figure 2.
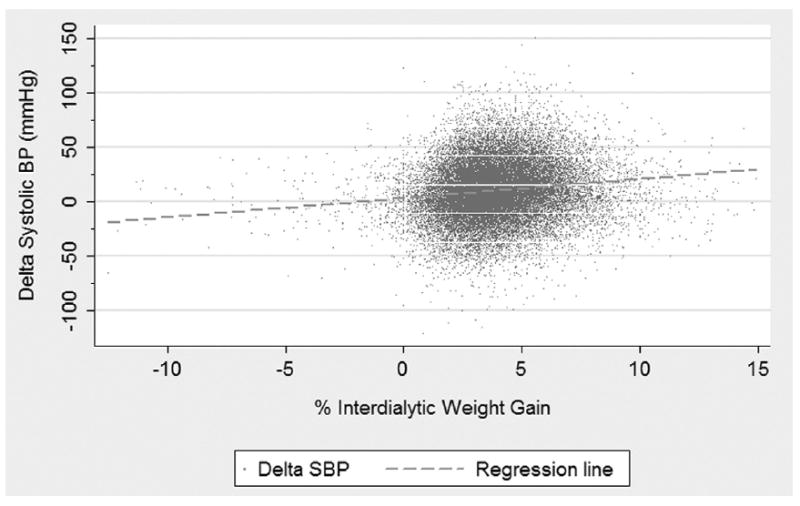
Scatter plot and regression line of the relationship between percentage of interdialytic weight gain (%IDWG) and Δ systolic (SBP) blood pressure; [ΔSBP = Intercept + 1.66 (±0.25) * %IDWG].
Associations Between Clinical Parameters and Predialysis SBP
In bivariate analysis, other factors associated with increased predialysis SBP included greater dry weight, left ventricular hypertrophy, hypertension, diabetes as cause of ESRD, erythropoietin use, diabetes mellitus, black race, and Hispanic ethnicity. Increased creatinine level and history of arrhythmia were associated with lower predialysis SBP (Table 2).
In multivariable analysis, percentage of IDWG remained a significant predictor of predialysis SBP (Table 2). Other significant predictors included increasing dry weight, left ventricular hypertrophy, hypertension, erythropoietin use, and Hispanic ethnicity. Greater creatinine level and history of arrhythmia remained significant predictors of lower predialysis SBP.
In multivariable analyses of predictors of predialysis SBP, there were significant interactions between percentage of IDWG and diabetes as cause of ESRD (P = 0.04), serum creatinine level (P = 0.0002), and age (P = 0.04). No interaction was present between percentage of IDWG and dry weight (P = 0.6) or black race (P = 0.3).
After stratifying based on parameters with significant interactions with percentage of IDWG, the relationship between percentage of IDWG and SBP was still significant in all groups. However, the magnitude of the relationship was modified by these clinical parameters (Table 4). For example, in patients with diabetes as cause of ESRD, the association of increased percentage of IDWG with predialysis SBP was less pronounced compared with subjects with ESRD from other causes (such that predialysis SBP increased 0.65 mm Hg for every 1% increase in percentage of IDWG in patients with diabetes mellitus compared with 1.20 mm Hg in patients without diabetes mellitus as cause of ESRD). In subjects stratified by quartiles of age, subjects younger than 48 years had the greatest increase in predialysis SBP with increasing percentage of IDWG, nearly 2-fold that of older subjects. In addition, in quartiles of creatinine, subjects with creatinine levels greater than 11.5 mg/dL (>1017 μmol/L) appeared to have the greatest increase in predialysis SBP associated with increased percentage of IDWG (1.19 mm Hg increase in SBP for every 1% increase in percentage of IDWG).
Table 4.
Effect of Percentage of IDWG on Predialysis Systolic Blood Pressure in Subgroups of Patients According to Clinical or Laboratory Characteristics
| Variable | Slope Parameter Estimate for %IDWG as Predictor of Systolic Blood Pressure (mm Hg) | P |
|---|---|---|
| Cause of ESRD* | ||
| Diabetes | 0.65 ± 0.41 | 0.002 |
| Other† | 1.20 ± 0.29 | <0.0001 |
| Age (y)‡ | ||
| <48 | 1.50 ± 0.47 | <0.0001 |
| 48-60 | 0.51 ± 0.41 | 0.02 |
| 61-73 | 1.07 ± 0.43 | 0.0001 |
| >73 | 0.81 ± 0.41 | <0.0001 |
| Creatinine (mg/dL)§ | ||
| <7.3 | 0.63 ± 0.37 | 0.001 |
| 7.3-9.09 | 0.95 ± 0.35 | <0.0001 |
| 9.1-11.5 | 1.16 ± 0.33 | <0.0001 |
| >11.5 | 1.19 ± 0.41 | <0.0001 |
Note: Values expressed as number ± 95% confidence interval. To convert creatinine in mg/dL to μmol/L, multiply by 88.4.
Abbreviations: %IDWG, percentage of interdialytic weight gain; ESRD, end-stage renal disease.
Parameter estimates generated from a multivariable model with predialysis systolic blood pressure as the dependent variable and the following predictor variables: percentage of IDWG if diabetes as cause of ESRD, percentage of IDWG if other cause of ESRD, diabetes as cause of ESRD, age, dry weight, black race, Hispanic ethnicity, hypertension, left ventricular hypertrophy, arrhythmia, creatinine level, erythropoietin use, and treatment group.
Includes glomerulonephritis, secondary glomerular nephritis, vasculitis, interstitial nephritis, pyelonephritis, hypertensive nephropathy, neoplasms, cystic disease, and hereditary and congenital disease.
Parameter estimates generated from a multivariable model with predialysis systolic blood pressure as the dependent variable and the following predictor variables: percentage of IDWG if older than 48 years, percentage of IDWG if aged 48 to 60 years, percentage of IDWG if aged 61 to 73 years, percentage of IDWG if older than 73 years, age, diabetes as cause of ESRD, dry weight, black race, Hispanic ethnicity, hypertension, left ventricular hypertrophy, arrhythmia, creatinine, erythropoietin use, and treatment group.
Parameter estimates generated from a multivariable model with predialysis systolic blood pressure as the dependent variable and the following predictor variables: percentage of IDWG if creatinine level less than 7.3 mg/dL, percentage of IDWG if creatinine level 7.3 to 9.09 mg/dL, percentage of IDWG if creatinine level 9.1 to 11.5 mg/dL, percentage of IDWG if creatinine level greater than 11.5 mg/dL, creatinine level, age, diabetes as cause of ESRD, dry weight, black race, Hispanic ethnicity, hypertension, left ventricular hypertrophy, arrhythmia, erythropoietin use, and treatment group.
Associations Between Clinical Parameters and ΔSBP
In bivariate analysis, variables associated with a greater ΔSBP (ie, greater decrease in SBP with hemodialysis) included greater predialysis SBP, increasing percentage of IDWG, greater dry weight, greater creatinine level, diabetes mellitus as cause of ESRD, left ventricular hypertrophy, Hispanic ethnicity, diabetes mellitus, black race, and greater serum albumin level (Table 3). Increasing age was associated with a lower or negative ΔSBP (ie, a smaller decrease in SBP with hemodialysis).
In the final multivariable model, factors associated with increased ΔSBP included greater predialysis SBP, increasing percentage of IDWG, greater creatinine level, and greater serum albumin level (Table 3). Factors associated with decreased or negative ΔSBP included older age and black race.
In multivariable analyses of predictors of ΔSBP, percentage of IDWG interacted with age (P = 0.008) and marginally with dry weight (P = 0.05); but percentage of IDWG did not interact with diabetes as cause of ESRD (P = 0.2), predialysis SBP (P = 0.5), black race (P = 0.9), or serum creatinine level (P = 0.6).
After stratifying based on parameters with significant interactions with percentage of IDWG, the relationship between percentage of IDWG and ΔSBP remained significant, but varied by patient characteristics (Table 5). In subjects stratified by quartiles of age, subjects younger than 48 years tended to have the lowest increase in ΔSBP (0.65 mm Hg) associated with every 1% increase in IDWG, whereas subjects older than 73 years had the largest ΔSBP (1.35 mm Hg) with every 1% increase in IDWG. Finally, among quartiles of dry weight, subjects with increasing dry weight had the greatest ΔSBP associated with increased percentage of IDWG.
Table 5.
Effect of percentage of IDWG on ΔSBP in Subgroups of Patients According to Clinical Characteristics
| Variable | Slope Parameter Estimates of Percentage of IDWG as Predictor of ΔSBP (mm Hg) | P |
|---|---|---|
| Age (y)* | ||
| <48 | 0.65 ± 0.37 | 0.0008 |
| 48-60 | 1.16 ± 0.43 | <0.0001 |
| 61-72 | 1.30 ± 0.43 | <0.0001 |
| >73 | 1.35 ± 0.41 | <0.0001 |
| Dry weight (kg)† | ||
| <63.5 | 0.92 ± 0.35 | <0.0001 |
| 63.5-74.2 | 1.16 ± 0.33 | <0.0001 |
| 74.3-88.2 | 1.01 ± 0.37 | <0.0001 |
| >88.2 | 1.36 ± 0.43 | <0.0001 |
Note: Values expressed as number ± 95% confidence interval.
Abbreviations: ΔSBP, change in systolic blood pressure; IDWG, interdialytic weight gain.
Parameter estimates generated from a multivariable model with ΔSBP as the dependent variable and the following predictor variables: percentage of IDWG if younger than 48 years, percentage of IDWG if aged 48 to 60 years, percentage of IDWG if aged 61 to 73 years, percentage of IDWG if older than 73 years, age, predialysis SBP, creatinine level, albumin level, diabetes mellitus as cause of end-stage renal disease, dry weight, black race, and treatment group.
Parameter estimates generated from a multivariable model with ΔSBP as the dependent variable and the following predictor variables: percentage of IDWG if dry weight less than 63.5 kg, percentage of IDWG if dry weight 63.5 to 74.2 kg, percentage of IDWG if dry weight 74.3 to 88.2 kg, percentage of IDWG if dry weight greater than 88.2 kg, dry weight, age, predialysis SBP, creatinine level, albumin level, diabetes mellitus as cause of end-stage renal disease, black race, and treatment group.
Diastolic Blood Pressure
Relationships between percentage of IDWG and DBP and ΔDBP were tested, and results are similar to those reported with SBP. For details of this analysis, please see Supplementary Data posted with this article at www.ajkd.org.
DISCUSSION
Increased percentage of IDWG is associated strongly with greater predialysis BP and a greater decrease in BP with hemodialysis in a cohort of prevalent subjects with ESRD. Although percentage of IDWG is associated independently with BP and change in BP with dialysis in all subjects, the magnitude of the relationship is modest and modified by other clinical factors. Thus, for most subjects, day-to-day variations in fluid intake have a conservative role in the significant increases in BP seen in these patients.
Prior studies found that volume status impacted on interdialytic BP,10,13,15,16,20 whereas others failed to show such a relationship.14,17,18 In our investigation, every 1% increase in percentage of IDWG (~0.7 kg in a 70-kg man) was associated with a 1.00 mm Hg increase in predialysis SBP and 1.08 mm Hg increase in ΔSBP in adjusted analyses, similar to that observed in previous analyses.19,20 Prior analyses that failed to show associations between IDWG and BP were limited by small sample size or small variations in IDWG.14,17,18
The lack of association between IDWG and BP in previous small studies suggests that individual factors may have a role in differential BP responses to volume challenges. Although likely underpowered to identify these patient characteristics, 2 small studies emphasized the potential presence of individual responses to volume in hemodialysis patients.19,28 In a study by Luik et al28 including 10 maintenance dialysis patients, only 3 patients experienced a significant increase in SBP with a 3-L fluid challenge. Similarly, Sherman et al19 noted that 5 of 19 nondiabetic hemodialysis patients showed a large increase in predialysis SBP with excessive IDWG.
To our knowledge, this is the first investigation to delineate individual patient characteristics that may modify the relationship between percentage of IDWG and BP. In this investigation, the magnitude of associations between percentage of IDWG and predialysis SBP and DBP was less pronounced in subjects with diabetes as cause of ESRD compared with subjects with ESRD from other causes, such as hypertension. This may be caused by increased aortic stiffness and enhanced volume sensitivity in subjects with long-standing hypertension as the cause of ESRD29 or such volume-independent mechanisms for BP changes as enhanced renin dependence in subjects with diabetes mellitus.30
Our investigation also found that although younger subjects (<48 years) experienced the greatest increases in predialysis SBP and DBP in association with increased percentage of IDWG, they also had more modest decrements in SBP and DBP with hemodialysis associated with percentage of IDWG. However, older subjects (>73 years) appeared to have the most pronounced ΔSBP and ΔDBP with hemodialysis associated with percentage of IDWG. The enhanced BP response to volume removal associated with hemodialysis in older individuals may be related to autonomic instability, arterial vascular stiffening, or an increased prevalence of cardiac failure and subsequent hemodynamic instability in the elderly.31,32
The relationship between percentage of IDWG and BP also was modified by nutritional parameters. Whereas subjects with greater serum creatinine levels showed greater increases in predialysis SBP and DBP with percentage of IDWG, serum creatinine level did not appear to modify relationships between percentage of IDWG and ΔSBP or ΔDBP. Greater dry weight, although not associated with greater predialysis SBP or ΔDBP in response to percentage of IDWG, was associated modestly with a more pronounced ΔSBP with percentage of IDWG. The reason behind the differential responses is unclear. One possible explanation is that the ability to retain fluid intravascularly may result in greater BP increases and changes associated with percentage of IDWG in subjects with improved nutritional status and greater muscle mass (such as those with greater weights and creatinine levels).33
Interestingly, although this analysis shows that individual patient characteristics can modify the relationship between IDWG and BP, this relationship was not modified by antihypertensive class. Thus, our analyses suggest that the choice of a particular class of antihypertensive agent (such as angiotensin-converting enzyme inhibitors or β-blockers) does not influence the BP response a patient may have associated with interdialytic fluid intake. However, because not all classes of agents were tested and the dose and timing of antihypertensive medications were not standardized or recorded, this relationship should be interpreted with caution.
The clinical importance of both interdialytic weight gain and BP in hemodialysis patients cannot be overemphasized. Prior studies found significant relationships between various BP parameters and clinical outcomes; however, many epidemiological investigations failed to show an association between moderate hypertension and detrimental outcomes in hemodialysis patients. 5,8,9,12,21 In addition, although retrospective analyses suggested that a large percentage of IDWG was associated with increased risk of mortality,6,7 recent investigations noted an increased percentage of IDWG to be associated with improved nutritional parameters and improved mortality.10,22-24 Thus, some postulated that the lack of relationship between moderate hypertension and outcomes may be caused by the benefit of additional volume and caloric intake, which can increase BP parameters. However, in our investigation, the impact of day-to-day volume intake on BP was modest, suggesting that intake volume may not have a significant role in the lack of association between moderate hypertension and clinical outcomes.
Although this analysis shows positive associations between percentage of IDWG and various BP parameters, there are a few limitations. Although data used in this study were collected as a part of a randomized controlled trial, this secondary analysis was an observational design, and, as a result, no conclusions regarding cause and effect can be made. In addition, patients who elect to enroll in a randomized controlled trial may not be reflective of the general US dialysis population. Mortality in subjects in CLIMB was less than that in the US Renal Data System (USRDS); however, baseline characteristics of subjects in CLIMB were similar to patients in the USRDS.26 Despite differences in clinical outcomes between the CLIMB cohort and USRDS population, this selection bias should not impact largely on associations between percentage of IDWG and BP. Second, variations in weight gain exist during interdialytic sessions during 2- compared with 3-day intervals. However, the purpose of this study is to determine the association between weight gain and BP parameters in actual practice, and our analytic method appropriately clustered on individual subjects, which should maximize our ability to detect average associations for each study participant. Third, BP parameters used for this analysis were not standardized and were obtained as part of routine clinical care by trained nurses; however, discrepancies in BP estimates should bias toward the null and should not largely impact on our results. Fourth, this analysis did not test the relationship between all available BP parameters, such as pulse pressure or mean arterial BP, because most epidemiological data found SBP to be associated most strongly with clinical outcomes. Finally, all studies that rely on BP measurements obtained at hemodialysis may not truly reflect a patient’s actual hemodynamic burden. Ambulatory BP34 and central BP measurements may be more reflective of a patient’s true hemodynamic burden. However, these methods are more difficult and burdensome to obtain. Nonetheless, most clinicians use hemodialysis BP measurements to guide antihypertensive therapy and adjust dry weight, which makes this analysis practical and relevant for practicing nephrologists.
In summary, increasing percentage of IDWG is associated with greater predialysis BP and greater decrease in BP associated with hemodialysis in a cohort of prevalent patients with ESRD. Although the relationship between percentage of IDWG and various BP parameters was statistically significant in almost all subjects, the magnitude of the relationship was modest and appeared to be modified by individual patient characteristics. Thus, whereas large deviations from dry weight may clinically impact on BP to a greater extent, day-to-day weight gain variations have only a moderate role in BP increases in prevalent patients with ESRD.35
Supplementary Material
Acknowledgments
Support: J.K.I. was supported by National Institutes of Health grant K12 RR-017630.
Footnotes
Financial Disclosure: None.
References
- 1.Agarwal R, Nissenson AR, Batlle D, Coyne DW, Trout JR, Warnock DG. Prevalence, treatment, and control of hypertension in chronic hemodialysis patients in the United States. Am J Med. 2003;115:291–297. doi: 10.1016/s0002-9343(03)00366-8. [DOI] [PubMed] [Google Scholar]
- 2.Horl MP, Horl WH. Hemodialysis-associated hypertension: Pathophysiology and therapy. Am J Kidney Dis. 2002;39:227–244. doi: 10.1053/ajkd.2002.30542. [DOI] [PubMed] [Google Scholar]
- 3.Vertes V, Cangiano JL, Berman LB, Gould A. Hypertension in end stage renal disease. N Engl J Med. 1969;280:978–981. doi: 10.1056/NEJM196905012801802. [DOI] [PubMed] [Google Scholar]
- 4.Charra B, Laurent G, Chazot C. Clinical assessment of dry weight. Nephrol Dial Transplant. 1996;11(suppl 2):S16–S19. doi: 10.1093/ndt/11.supp2.16. [DOI] [PubMed] [Google Scholar]
- 5.Stidley CA, Hunt WC, Tentori F, et al. Changing relationship of blood pressure with mortality over time among hemodialysis patients. J Am Soc Nephrol. 2006;17:513–520. doi: 10.1681/ASN.2004110921. [DOI] [PubMed] [Google Scholar]
- 6.Szczech LA, Reddan DN, Klassen PS, et al. Interactions between dialysis-related volume exposures, nutritional surrogates and mortality among ESRD patients. Nephrol Dial Transplant. 2003;18:1585–1591. doi: 10.1093/ndt/gfg225. [DOI] [PubMed] [Google Scholar]
- 7.Kimmel PL, Varela MP, Peterson RA, et al. Interdialytic weight gain and survival in hemodialysis patients: Effects of duration of ESRD and diabetes mellitus. Kidney Int. 2000;57:1141–1151. doi: 10.1046/j.1523-1755.2000.00941.x. [DOI] [PubMed] [Google Scholar]
- 8.Klassen PS, Lowrie EG, Reddan DN, et al. Association between pulse pressure and mortality in patients undergoing maintenance hemodialysis. JAMA. 2002;287:1548–55. doi: 10.1001/jama.287.12.1548. [DOI] [PubMed] [Google Scholar]
- 9.Foley RN, Herzog CA, Collins AJ. Blood pressure and long-term mortality in US hemodialysis patients: USRDS Waves 3 and 4 Study. Kidney Int. 2002;62:1784–1790. doi: 10.1046/j.1523-1755.2002.00636.x. [DOI] [PubMed] [Google Scholar]
- 10.Lopez-Gomez JM, Villaverde M, Jofre R, Rodriguez-Benitez P, Perez-Garcia R. Interdialytic weight gain as a marker of blood pressure, nutrition, and survival in hemodialysis patients. Kidney Int Suppl. 2005;93:S63–S68. doi: 10.1111/j.1523-1755.2005.09314.x. [DOI] [PubMed] [Google Scholar]
- 11.Port FK, Hulbert-Shearon TE, Wolfe RA, et al. Predialysis blood pressure and mortality risk in a national sample of maintenance hemodialysis patients. Am J Kidney Dis. 1999;33:507–517. doi: 10.1016/s0272-6386(99)70188-5. [DOI] [PubMed] [Google Scholar]
- 12.Zager PG, Nikolic J, Brown RH, et al. U Curve association of blood pressure and mortality in hemodialysis patients. Kidney Int. 1998;54:561–569. doi: 10.1046/j.1523-1755.1998.00005.x. [DOI] [PubMed] [Google Scholar]
- 13.Rahman M, Fu P, Sehgal AR, Smith MC. Interdialytic weight gain, compliance with dialysis regimen, and age are independent predictors of blood pressure in hemodialysis patients. Am J Kidney Dis. 2000;35:257–265. doi: 10.1016/s0272-6386(00)70335-0. [DOI] [PubMed] [Google Scholar]
- 14.Cheigh JS, Milite C, Sullivan JF, Rubin AL, Stenzel KH. Hypertension is not adequately controlled in hemodialysis patients. Am J Kidney Dis. 1992;19:453–459. doi: 10.1016/s0272-6386(12)80954-1. [DOI] [PubMed] [Google Scholar]
- 15.Rahman M, Dixit A, Donley V, et al. Factors associated with inadequate blood pressure control in hypertensive hemodialysis patients. Am J Kidney Dis. 1999;33:498–506. doi: 10.1016/s0272-6386(99)70187-3. [DOI] [PubMed] [Google Scholar]
- 16.Dionisio P, Valenti M, Bergia R, et al. Influence of the hydration state on blood pressure values in a group of patients on regular maintenance hemodialysis. Blood Purif. 1997;15:25–33. doi: 10.1159/000170314. [DOI] [PubMed] [Google Scholar]
- 17.Chazot C, Charra B, Laurent G, et al. Interdialysis blood pressure control by long haemodialysis sessions. Nephrol Dial Transplant. 1995;10:831–837. [PubMed] [Google Scholar]
- 18.Savage T, Fabbian F, Giles M, Tomson CR, Raine AE. Interdialytic weight gain and 48-h blood pressure in haemodialysis patients. Nephrol Dial Transplant. 1997;12:2308–2311. doi: 10.1093/ndt/12.11.2308. [DOI] [PubMed] [Google Scholar]
- 19.Sherman RA, Daniel A, Cody RP. The effect of interdialytic weight gain on predialysis blood pressure. Artif Organs. 1993;17:770–774. doi: 10.1111/j.1525-1594.1993.tb00629.x. [DOI] [PubMed] [Google Scholar]
- 20.Leypoldt JK, Cheung AK, Delmez JA, et al. Relationship between volume status and blood pressure during chronic hemodialysis. Kidney Int. 2002;61:266–275. doi: 10.1046/j.1523-1755.2002.00099.x. [DOI] [PubMed] [Google Scholar]
- 21.Kalantar-Zadeh K, Kilpatrick RD, McAllister CJ, Greenland S, Kopple JD. Reverse Epidemiology of Hypertension and Cardiovascular Death in the Hemodialysis Population: The 58th Annual Fall Conference and Scientific Sessions. Hypertension. 2005;45:811–817. doi: 10.1161/01.HYP.0000154895.18269.67. [DOI] [PubMed] [Google Scholar]
- 22.Ifudu O, Uribarri J, Rajwani I, et al. Relation between interdialytic weight gain, body weight and nutrition in hemodialysis patients. Am J Nephrol. 2002;22:363–368. doi: 10.1159/000065228. [DOI] [PubMed] [Google Scholar]
- 23.Sezer S, Ozdemir FN, Arat Z, Perim O, Turan M, Haberal M. The association of interdialytic weight gain with nutritional parameters and mortality risk in hemodialysis patients. Ren Fail. 2002;24:37–48. doi: 10.1081/jdi-120002659. [DOI] [PubMed] [Google Scholar]
- 24.Testa A, Beaud JM. The other side of the coin: Interdialytic weight gain as an index of good nutrition. Am J Kidney Dis. 1998;31:830–834. doi: 10.1016/s0272-6386(98)70052-6. [DOI] [PubMed] [Google Scholar]
- 25.Sherman RA, Cody RP, Rogers ME, Solanchick JC. Interdialytic weight gain and nutritional parameters in chronic hemodialysis patients. Am J Kidney Dis. 1995;25:579–583. doi: 10.1016/0272-6386(95)90126-4. [DOI] [PubMed] [Google Scholar]
- 26.Reddan DN, Szczech LA, Hasselblad V, et al. Intradialytic blood volume monitoring in ambulatory hemodialysis patients: A randomized trial. J Am Soc Nephrol. 2005;16:2162–2169. doi: 10.1681/ASN.2004121053. [DOI] [PubMed] [Google Scholar]
- 27.Singer JD. Using SAS PROC MIXED to fit multi-level models, hierarchical models and individual growth models. J Educ Behav Stat. 1998;23:323–355. [Google Scholar]
- 28.Luik AJ, Gladziwa U, Kooman JP, et al. Influence of interdialytic weight gain on blood pressure in hemodialysis patients. Blood Purif. 1994;12:259–266. doi: 10.1159/000170172. [DOI] [PubMed] [Google Scholar]
- 29.Ventura JE, Sposito M. Volume sensitivity of blood pressure in end-stage renal disease. Nephrol Dial Transplant. 1997;12:485–491. doi: 10.1093/ndt/12.3.485. [DOI] [PubMed] [Google Scholar]
- 30.Kornerup HJ, Schmitz O, Danielsen H, Pedersen EB, Giese J. Significance of the renin-angiotensin system for blood pressure regulation in end-stage renal disease. Contrib Nephrol. 1984;41:123–127. doi: 10.1159/000429274. [DOI] [PubMed] [Google Scholar]
- 31.Chen CH, Nakayama M, Nevo E, Fetics BJ, Maughan WL, Kass DA. Coupled systolic-ventricular and vascular stiffening with age: Implications for pressure regulation and cardiac reserve in the elderly. J Am Coll Cardiol. 1998;32:1221–1227. doi: 10.1016/s0735-1097(98)00374-x. [DOI] [PubMed] [Google Scholar]
- 32.Van der Sande FM, Mulder AW, Hoorntje SJ, et al. The hemodynamic effect of different ultrafiltration rate in patients with cardiac failure and patients without cardiac failure: Comparison between isolated ultrafiltration and ultrafiltration with dialysis. Clin Nephrol. 1998;50:301–308. [PubMed] [Google Scholar]
- 33.Beddhu S, Samore MH, Roberts MS, Stoddard GJ, Pappas LM, Cheung AK. Creatinine production, nutrition, and glomerular filtration rate estimation. J Am Soc Nephrol. 2003;14:1000–1005. doi: 10.1097/01.asn.0000057856.88335.dd. [DOI] [PubMed] [Google Scholar]
- 34.Agarwal R, Peixoto AJ, Santos SFF, Zoccali C. Preand postdialysis blood pressures are imprecise estimates of interdialytic ambulatory blood pressure. Clin J Am Soc Nephrol. 2006;1:389–398. doi: 10.2215/CJN.01891105. [DOI] [PubMed] [Google Scholar]
- 35.National Kidney Foundation. K/DOQI Clinical Practice Guidelines on Hypertension and Antihypertensive Agents in Chronic Kidney Disease. [February 10, 2007]; Available at: http://www.kidney.org/professionals/kdoqi/guidelines. [PubMed]
Associated Data
This section collects any data citations, data availability statements, or supplementary materials included in this article.