Abstract
Network structures formed by actin filaments are present in many kinds of fluorescence microscopy images. In order to quantify the conformations and dynamics of such actin filaments, we propose a fully automated method to extract actin networks from images and analyze network topology. The method handles well intersecting filaments and, to some extent, overlapping filaments. First we automatically initialize a large number of Stretching Open Active Contours (SOACs) from ridge points detected by searching for plus-to-minus sign changes in the gradient map of the image. These initial SOACs then elongate simultaneously along the bright center-lines of filaments by minimizing an energy function. During their evolution, they may merge or stop growing, thus forming a network that represents the topology of the filament ensemble. We further detect junction points in the network and break the SOACs at junctions to obtain “SOAC segments”. These segments are then re-grouped using a graph-cut spectral clustering method to represent the configuration of actin filaments. The proposed approach is generally applicable to extracting intersecting curvilinear structures in noisy images. We demonstrate its potential using two kinds of data: (1) actin filaments imaged by Total Internal Reflection Fluorescence Microscopy (TIRFM) in vitro; (2) actin cytoskeleton networks in fission yeast imaged by spinning disk confocal microscopy.
Index Terms: Actin Filament, Network Structures, Active Contour Models, Normalized Cuts
1. INTRODUCTION
All eukaryotic cells have actin proteins. Actin proteins can self-assemble into long polymers to build networks and bundles of filaments that provide cellular mechanical integrity, generate forces for cell movement, and act as tracks for intracellular transport by motor proteins. Fluorescence microscopy is widely used to study the kinetics of single actin filament growth in vitro [1, 2, 3], the assembly mechanism of the contractile ring during cytokinesis [4], and the 3-D structure of microtubules [5]. Systematic analysis of the topology and properties of cytoskeletal structures in such images can provide significant insights into their conformations and dynamics. Fig. 1 demonstrates several kinds of microscopic images in which actin networks or intersecting actin filaments are present. Fluorescently-labeled actin filaments imaged by Total Internal Reflection Fluorescence Microscopy (TIRFM) grow parallel to a glass slide, and some long filaments intersect with each other in the last several frames of the TIRFM time-lapse sequence (Fig. 1(a)). In the radial projection of 3D confocal microscopy images, actin filament bundles manifest themselves as a meshwork during mitosis (Fig. 1(b)). Actin cables inside a cell imaged by spinning-disk confocal microscopy also form a cytoskeleton network (Fig. 1(c)). To analyze these network structures, an important step is to accurately extract them from the microscopy images.
Fig. 1.
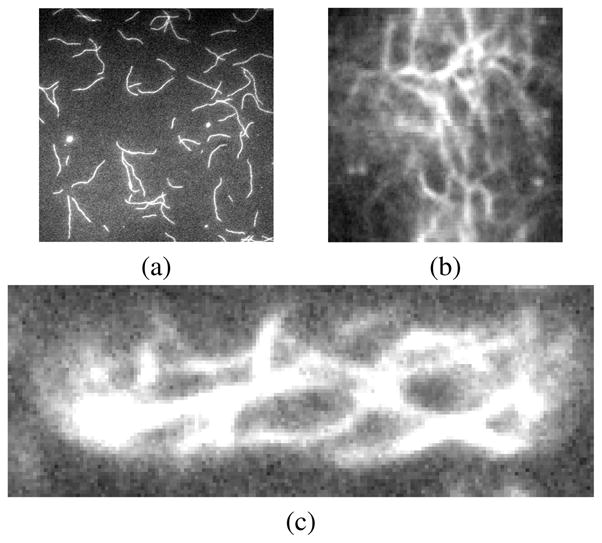
(a) Intersecting filaments in a TIRFM experiment. (b) Actin meshwork in a 2D radial projection of a 3D confocal microscopy volume of a dividing cdc25–22 fission yeast cell labeled by GFP-CHD. Vertical axis is arc length [4]. (c) One 2D confocal actin cables slice of a fission yeast cell labeled by GFP-CHD. The cell radius is 1.73 μm.
Parametric active contour models (snakes) [6] have been reported as an effective method to segment curvilinear structures such as actin filaments, actin cables in fission yeast, and microtubules. Li et al. [7, 8, 9] used Stretching Open Active Contours (SOACs) to segment and track individual filaments in a TIRFM image sequence. Smith et al. [10] further applied this method to quantify the conformations and dynamics of actin cables in 3D confocal microscopy images. Related methods have also been utilized to trace microtubules. Nurgaliev et al. [11] employed active contour models and Monte Carlo simulations to locate microtubules in 3D electron tomography images. Hadjidemetriou et al. [12] tracked microtubule tips automatically using consecutive level sets methods. Sargin et al. [13] traced microtubule bodies using second order derivatives of Gaussian filters and iterative calculation of geodesic paths. Saban et al. [14] automatically located microtubule tips in the first frame and tracked tips by searching for the closest match in subsequent frames.
These methods, however, do not explicitly model the topology of intersecting filaments and filament meshworks. Furthermore, although SOACs demonstrate successful application to single filament segmentation and tracking [7, 8, 9, 10], they are not directly applicable to extracting filament meshworks or segmenting multiple intersecting filaments simultaneously. The reason is that manual initialization is required for each filament and the behavior between different SOACs is not explicitly regulated.
While other methods often segment individual actin filaments one by one, our automated method simultaneously extracts and segments all the filaments in a full-field image. Then the topology of the network structure can be further analyzed and the relationship among filaments can also be retrieved. Previous studies have addressed the network morphology and distribution of intermediate filaments [18, 19, 20]. Here, we introduce a different approach in which a large number of SOACs [7] evolve simultaneously. Furthermore, we explicitly regulate their behavior when they meet, cross, and overlap with each other. When the evolution is converged, we dissect each SOAC at the junctions of the extracted network and re-group these dissected “SOAC segments” to obtain the configuration of actin filaments.
The main contributions of the paper are: (1) A fully automated method for initializing multiple SOACs along intensity ridges in the image; (2) A complete set of mechanisms for regulating SOACs’ behavior during their simultaneous evolution, so that a neat network can be extracted efficiently from noisy images; (3) Re-organization of SOAC segments using Normalized Cuts [17] so that the newly grouped SOACs correspond to physical actin filaments.
2. METHODOLOGY
2.1. Automatic Initialization of Multiple SOACs
Since noise can induce many false positives in detected ridge points, we first obtain the smoothed image IG by Gaussian filtering with σ equal to the typical filament width (2–3 pixels). Though more sophisticated methods, such as Hessian-based vessel enhancement filtering [15], enhance the appearance of filaments, Gaussian filtering is adequate as suggested by our experiments.
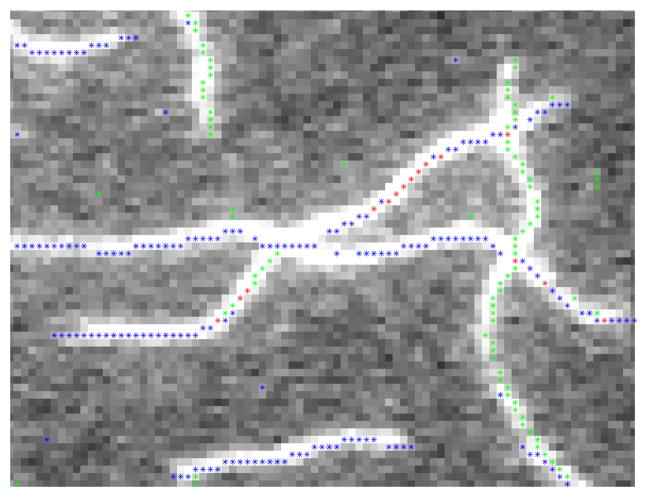
Candidate points for multiple SOAC initialization are then detected. They are ridge points with locally maximum intensity along a certain direction. Since any direction in 2D can be decomposed into x and y components, a ridge point can be found by inspecting the plus-to-minus sign change in the gradient field G = [Gx, Gy] of IG along x and y directions independently [16]. A pixel at location (i, j) is a vertical ridge point if Gx(i, j − 1) > 0 and Gx(i, j) < 0; likewise, it is a horizontal ridge point if Gy(i, j − 1) > 0 and Gy(i, j) < 0. In other words, the sign of Gx (or Gy) changes from positive to negative at a ridge point. If centered difference is used to estimate G, the ridge points detected may lie next to the pixels with locally maximum intensity. However, this does not incur any problem since SOACs can automatically move to the centerline of a filament during their evolution. Unlike [16], we do not detect other patterns of sign changes in G because +− sign changes already give enough candidate points (Fig. 2).
Fig. 2.
Ridge points detected along x or y directions are labeled green or blue, respectively; the ones detected in both directions are labeled red.
Finally we initialize each SOAC from locally connected vertical/horizontal ridge points using 8-connected-component analysis. Vertical and horizontal ridge points are used separately so that the order to form a SOAC can be determined conveniently. For example, from a connected component of horizontal ridge points, we can initialize a horizontal SOAC starting from the point with minimum x coordinate, up to the one with maximum x coordinate. This automatic initialization generates short vertical (in green) and horizontal (in blue) SOACs (Fig. 3).
Fig. 3.

Initial SOACs initialized from ridge points. Green and blue ones are initialized from vertical and horizontal ridge points, respectively.
2.2. Simultaneous Evolution of Multiple SOACs
2.2.1. Dynamic Deformation with Stretching Energy
In the continuous domain, a stretching open active contour model can be represented as a parametric curve, r(s) = (x(s), y(s)), s ∈ [0,1]. A SOAC evolves by minimizing the contour energy E, where E = Eint + Eext. Eint is an internal energy term, which maintains the continuity and smoothness of the contour; Eext is an external energy term, which pushes the contour towards salient image features, such as bright ridges. The internal energy Eint is defined as:
| (1) |
where α(s) and β(s) are the relative weights between the first-order and second-order terms. The external energy Eext is also composed of two terms: an image term Eimg = IG and a stretching term Estr. The definition of the external energy is:
| (2) |
where k is a constant balancing the internal and external energy.
To make a SOAC grow along the filament, we add stretching forces to its ends [7]. The force direction is along the tangential direction at the ends and its magnitude is proportional to the image intensity IG (r (s)) at a SOAC point. The gradient of the stretching term is defined by:
| (3) |
where kstr is the coefficient balancing image and stretching term. So the external force field is:
| (4) |
Combining all terms, minimizing the contour energy E makes SOACs grow along the bright ridges while keeping their continuity and smoothness. Summing up all terms and deriving the EulerLagrange equation, a SOAC at iteration i are computed from the one at iteration i − 1 as follows:
| (5a) |
| (5b) |
where A is the pentadiagonal banded matrix containing the internal continuity and smoothness constraints defined by (1), I is the identity matrix and γ is the step size [6]. All SOACs need to be re-sampled after each iteration to keep the distance between adjacent SOAC points. The contour energy E is minimized at each iteration. When the internal forces and external forces are balanced, the system enters a state of equilibrium. If a certain SOAC’s length and position does not change after a predefined number of iterations, it is considered converged and it stops evolving. After all SOACs are converged, SOACs that are too short to be a filament are deleted. The length threshold is set to 10 pixels.
2.2.2. Merging, Deletion and Growth Termination of Multiple SOACs
Because several initial SOACs may lie on the same filament, they will partly or fully overlap as they elongate. Furthermore, a SOAC may elongate erroneously to another filament at intersections, leading to incorrect segmentation. To solve this problem arising from simultaneous evolution, SOACs are merged, deleted or stopped elongating, to obtain a clear topology of the filament ensemble. Merging and deletion also greatly reduces the number of SOACs in action, making the evolution more efficient.
Let us denote the set of SOACs by S, and its cardinality by |S|. At each iteration, we do pairwise calculation on a pair of SOACs ri and rj, i, j ∈ [1, |S|]. For each end point ri(t), t = 0, 1 of ri, we locate the last point ri(p) close to rj counting from ri(t), and the closest point rj(q) to ri(p) on rj. The L2-norm distance threshold Dthresh for measuring closeness is set to 1 pixel.
Case I: SOAC merging
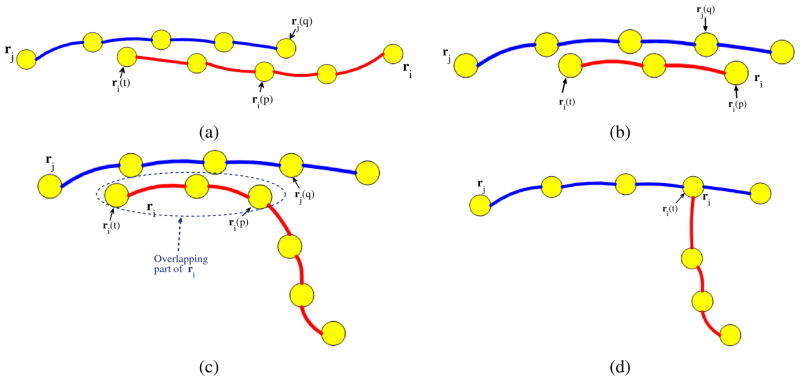
If q = 0,1 and the angle θ between the two tangential vectors at ri(t) and rj(q) is sufficiently close to π and greater than θthresh, we merge ri with rj by concatenating the non-overlapping part of ri to rj and then deleting ri (Fig. 4(a)). We set θthresh = 2π/3.
Fig. 4.
Illustration of cases for SOAC merging, deletion, and growth termination. (a) ri merges with rj. (b) ri is deleted. (c) & (d) ri stops growing at ri(t). We attach ri(t) to rj(q) when the overlapping region exceeds a predefined threshold Othresh.
Case II: SOAC deletion
If t = 0, p = 1 or t = 1, p = 0, indicating that ri is completely covered by rj, we delete ri (Fig. 4(b)).
Case III: SOAC growth termination
If 0 < q < 1 and the length of the overlapping part of ri exceeds a predefined threshold Othresh (Fig. 4(c)), we delete the overlapping part and attach the end of ri(t) to rj(q) (Fig. 4(d)). When an end is fixed, we also set the stretching coefficient kstr at that end to zero.
Other than the above three cases, we do not interrupt the SOACs’ evolution.
2.3. Dissecting SOACs and Re-Grouping SOAC Segments
2.3.1. Dissecting SOACs
Even though we regulate SOACs’ behavior in the evolution process, we still cannot guarantee that each converged SOAC corresponds to an actual filament. This is because a SOAC may evolve to represent different filaments, or one filament is represented by several different SOACs. This situation is illustrated in Fig. 5, where green and blue indicate different SOACs.
Fig. 5.

(top) Three intersecting filaments. (bottom) Converged SOACs do not correspond to the actual filaments. Green and blue ones are different SOACs.
To analyze the topology of the extracted filament network represented by the SOACs, we first dissect each SOAC at junction points into “SOAC segments”. Junction points are those SOAC points having one or more neighboring SOAC points that belong to another SOAC. Fig. 6(a) shows an example of detected junctions in the network.
Fig. 6.

(top) Detected junctions shown in red points. (bottom) SOAC segment grouping results; the segments covering the same filament are in the same color; the blue arrow indicates an overlapping common segment that is grouped to both the green and red groups.
2.3.2. Grouping the SOAC Segments
After obtaining the SOAC segments, we can examine which SOAC segments correspond to the same actin filament. Before grouping, we need to detect “common segments” in all the SOAC segments. A common segment is a segment where two or more filaments overlap. The observation for detecting a common segment is that its two ends are both junctions and its average intensity is the highest among all the segments sharing these two junctions. After that, we can form “grouping subsets” of SOAC segments: a grouping subset consists of SOAC segments sharing a junction or sharing a common segment. We then use Normalized Cuts [17] to group segments in each grouping subset. Normalized Cuts is a graph partitioning algorithm for data clustering. It minimizes the global criterion which measures both the total dissimilarity between different subgroups of a graph as well as the total similarity within the subgroups.
Under the graph partitioning framework, a grouping subset can be represented as a small complete weighted undirected graph Gk = (Vk, Ek), k = 1, …, K, where K is the number of grouping subsets. Each SOAC segment in the grouping subset Gk is a node in Vk and the edge weight wij specifies the junction continuity, which is defined by the local orientations at the end points of segments. Because the actin filaments are smooth linear structures, two segments sharing a junction are more likely to belong to the same filament if they are continuous and smooth across the junction. So we use this prior information to construct the affinity matrix W = {wij}, which is an N × N symmetric matrix and N is the number of segments in the grouping subset (i.e. number of nodes in the subset’s graph Gk). Usually N equals 3 or 4. To compute wij, we use the normalized angle between every two tangential vectors at the end points of the segments. According to the results of filament curvature distribution analysis [10], we use a sample distance of 20 pixels to estimate the direction of tangent vectors at end points.
We specify the number of groups as 2 for a grouping subset if N = 3, 4. Occasionally N can be 5 or 6, in which case we let the number of groups be 3.
At the final step, we successively merge the resulting groups if they share segments until all the groups are disjoint. Fig. 6(b) illustrates an example of grouping results. Note that the common segment belongs to both groups adjoining it.
3. APPLICATION TO EXPERIMENTAL DATA
3.1. Experimental Image Data
We use TIRFM image sequences from [3] for validation. In the experiment, polymerization of muscle Mg-ADP-actin is monitored in the presence of inorganic phosphate (Pi) and actin monomers. The pixel size is 0.17 μm. To evaluate our method, we use the last frames of the sequences where the filaments are more crowded and have more intersections than previous frames. A test image is shown in Fig. 1(a). Note that its non-uniform illumination makes the magnitude of stretching force inconsistent across the image. We correct this problem by subtracting the non-uniform background estimated by a gray-scale opening morphological operation.
We also tested our method using a 2D radial projection of a 3D confocal microscopy image of actin in a dividing fission yeast labeled by GFP-CHD [4] (Fig. 1(b)) as well as one 2D confocal slice showing actin cables (Fig. 1(c)). Radial projections are obtained from stacks of images of cells expressing GFP-CHD by radially projecting image data onto a 2D strip which corresponds to the membrane unfolded longitudinally from the middle of the cell. These images of cdc25–22 fission yeast cells reveal an intricate dynamic actin meshwork establishing connections among myosin nodes.
3.2. Segmentation Examples and Evaluation
We select 55 filaments from one of the last frames of TIRFM sequences to measure the segmentation error of our method. For each filament, a SOAC generated by [10] and subsequently modified by a human expert serves as the ground truth. The body distance d(rc, rt) between our computed SOAC rc and the corresponding ground truth SOAC rt is defined as:
| (6) |
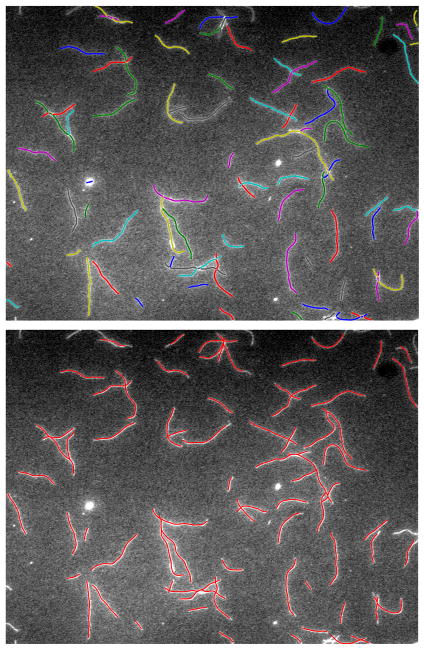
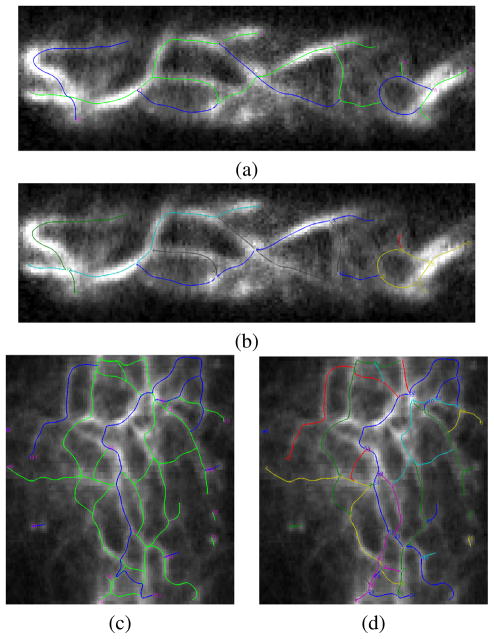
where rc(i) and rt(j) is the ith and jth points of SOAC rc and rt respectively. Since the tip location is important, we also compute the L2 distance between locations of the two end points of our computed SOAC and those of the ground truth SOAC. Fig. 7 shows the segmentation results of our method, compared with the ground truth. Table 1 shows the segmentation error statistics of our method. Fig. 8 illustrates a typical case in which the SOAC segments whose orientations are more consistent are grouped together into one filament during the Normalized Cuts grouping step. Application to confocal microscopy images are shown in Fig. 9.
Fig. 7.
(top) Segmentation results. (bottom) Ground truth.
Table 1.
Body and tip segmentation error statistics of 55 filaments. (Unit: pixel)
| Mean | Maximum | Standard Deviation | |
|---|---|---|---|
| Body | 2.7312 | 8.3775 | 2.0266 |
| Tip1 | 2.3645 | 11.2704 | 2.2668 |
| Tip2 | 2.1377 | 8.3775 | 1.7210 |
Fig. 8.
(left) Two converged SOACs. (right) Re-grouped SOAC segments at that junction. The top part of the left filament (left) is correctly re-grouped with the right filament (right) based on local orientation continuity using Normalized Cuts.
Fig. 9.
Filament network extraction in confocal microscopy images (see Fig. 1) (a) and (c) are converged SOACs; (b) and (d) are re-grouping results giving the filaments.
4. CONCLUSION
In this paper, we proposed an automated method to simultaneously segment intersecting filaments that form a network structure. We further analyze the topology of the filament network and re-organize the SOACs to represent the physical actin filaments. Experimental and validation results demonstrate the performance of this method. One advantage of our method is that it can overcome the disconnectivity problems induced by intensity gaps or faint filaments in the image when extracting actin networks by thinning. One limitation of our current method is that it cannot distinguish a filament from an overlapping filament if the two filaments overlapping part covers an end point of one of the filaments. In the future we plan to employ SOAC width and intensity information to better identify overlapping parts of filaments.
Acknowledgments
We thank Jian-Qiu Wu and Ikuko Fujiwara for providing images. This work was supported by NIH grant R21GM083928.
References
- 1.Fujiwara I, Takahashi S, Tadakuma H, Funatsu T, Ishiwata S. Microscopic analysis of polymerization dynamics with individual actin filaments. Nat Cell Biol. 2002;4:666–673. doi: 10.1038/ncb841. [DOI] [PubMed] [Google Scholar]
- 2.Kuhn JR, Pollard TD. Real-time measurements of actin filament polymerization by total internal reflection fluorescence microscopy. Biophys J. 2005;88:1387–1402. doi: 10.1529/biophysj.104.047399. [DOI] [PMC free article] [PubMed] [Google Scholar]
- 3.Fujiwara I, Vavylonis D, Pollard TD. Polymerization kinetics of ADP- and ADP-Pi-actin determined by fluorescence microscopy. Proc Natl Acad Sci USA. 2007;104:8827–8832. doi: 10.1073/pnas.0702510104. [DOI] [PMC free article] [PubMed] [Google Scholar]
- 4.Vavylonis D, Wu JQ, Hao S, O’Shaughnessy B, Pollard TD. Assembly mechanism of the contractile ring for cytokinesis by fission yeast. Science. 2008;319:97–100. doi: 10.1126/science.1151086. [DOI] [PubMed] [Google Scholar]
- 5.Yang Q, Karpikov A, Toomre D, Duncan J. Estimation of 3D gemometry of microtubules using multi-angle total internal reflection fluorescence microscopy. MICCAI’10. 2010:538–545. doi: 10.1007/978-3-642-15745-5_66. [DOI] [PubMed] [Google Scholar]
- 6.Kass M, Witkin A, Terzopoulos D. Snakes: Active contour models. IJCV. 1987;1:321–331. [Google Scholar]
- 7.Li H, Shen T, Smith MB, Fujiwara I, Vavylonis D, Huang X. Automated actin filament segmentation, tracking and tip elongation measurements based on open active contour models. ISBI’09. 2009:1302–1305. doi: 10.1109/ISBI.2009.5193303. [DOI] [PMC free article] [PubMed] [Google Scholar]
- 8.Li H, Shen T, Vavylonis D, Huang X. Actin filments tracking based on particle filters and stretching open active contour models. MICCAI’09. 2009;12:673–681. doi: 10.1007/978-3-642-04271-3_82. [DOI] [PMC free article] [PubMed] [Google Scholar]
- 9.Li H, Shen T, Vavylonis D, Huang X. Actin filament segmentation using spatiotemporal active-surface and active-contour models. MICCAI’10. 2010:86–94. doi: 10.1007/978-3-642-15705-9_11. [DOI] [PMC free article] [PubMed] [Google Scholar]
- 10.Smith MB, Li H, Shen T, Huang X, Yusuf E, Vavylonis D. Segmentation and tracking of cytoskeletal filaments using open active contours. Cytoskeleton. 2010;67:693–705. doi: 10.1002/cm.20481. [DOI] [PMC free article] [PubMed] [Google Scholar]
- 11.Nurgaliev D, Gatanov T, Needleman DJ. Automated Identification of Microtubules in cellular electron tomography. Methods in cell biology. 2010;97:475–495. doi: 10.1016/S0091-679X(10)97025-8. [DOI] [PubMed] [Google Scholar]
- 12.Hadjidemetriou S, Toomre D, Duncan J. Motion tracking of the outer tips of microtublules. Medical Image Analysis. 2008;12:689–702. doi: 10.1016/j.media.2008.04.004. [DOI] [PubMed] [Google Scholar]
- 13.Sargin ME, Altinok A, Kiris E, Feinstein SC, Wilson L, Rose K, Manjunath BS. Tracing microtubules in live cell images. ISBI’07. 2007:296–299. doi: 10.1186/1471-2121-8-S1-S4. [DOI] [PMC free article] [PubMed] [Google Scholar]
- 14.Saban M, Altinok A, Peck A, Kenney C, Feinstein S, Wilson L, Rose K, Manjunath BS. Automated tracking and modeling of microtubule dynamics. ISBI’06. 2006:1032–1035. [Google Scholar]
- 15.Frangi AF, Niessen WJ, Vincken KL, Viergever MA. Multiscale vessel enhancement filtering. MICCAI’98. 1998;1496:130–137. [Google Scholar]
- 16.Chang S, Kulikowski CA, Dunn SM, Levy S. Biomedical Image Skeletonization: A novel method applied to fibrin network structures. MedInfo. 2001:901–906. [PubMed] [Google Scholar]
- 17.Shi J, Malik J. Normalized Cuts and Image Segmentation. TPAMI. 2000;22:888–905. [Google Scholar]
- 18.Helmke BP, Thakker DB, Goldman RD, Davies PF. Spatiotemporal analysis of flow-induced intermediate filament displacement in living endothelial cells. Biophys J. 2001;80:184–194. doi: 10.1016/S0006-3495(01)76006-7. [DOI] [PMC free article] [PubMed] [Google Scholar]
- 19.Mickel W, Munster S, Jawerth LM, Vader DA, Weitz DA, Sheppard AP, Mecke K, Fabry B, Schroder-Turk GE. Robust pore size analysis of filamentous networks from three-dimensional confocal microscopy. Biophys J. 2008;95:6072–80. doi: 10.1529/biophysj.108.135939. [DOI] [PMC free article] [PubMed] [Google Scholar]
- 20.Luck S, Sailer M, Schmidt V, Walther P. Three-dimensional analysis of intermediate filament networks using SEM tomography. J Microsc. 2010;239:1–16. doi: 10.1111/j.1365-2818.2009.03348.x. [DOI] [PubMed] [Google Scholar]


