Abstract
During the last decade, the convergence of medical imaging and computational modeling technologies has enabled tremendous progress in the development and application of image-based computational fluid dynamics modeling of patient-specific blood flows. These techniques have been used for studying the basic mechanisms involved in the initiation and progression of vascular diseases, for studying possible ways to improve the diagnosis and evaluation of patients by incorporating hemodynamics information to the anatomical data typically available, and for the development of computational tools that can be used to improve surgical and endovascular treatment planning. However, before these technologies can have a significant impact on the routine clinical practice, it is still necessary to demonstrate the connection between the extra information provided by the models and the natural progression of vascular diseases and the outcome of interventions. This paper summarizes some of our contributions in this direction, focusing in particular on cerebral aneurysms.
Keywords: Cerebral aneurysms, hemodynamics, computational fluid dynamics, rupture, stenting
1. INTRODUCTION
The majority of cerebral hemorrhages are caused by the rupture of an intracranial aneurysm, a pathological dilatation of the cerebral arteries usually located near the circle of Willis [1, 2]. Advances in imaging techniques have resulted in increased detection of incidental unruptured aneurysms. These aneurysms generally carry a relatively low rupture risk [3]. Therefore, their management requires not only careful rupture risk assessment to determine which aneurysms need treatment, but also low risk minimally invasive treatments. Recently, there has been increased interest in the use of flow divertion endovascular devices such as stents [4-6]. The goal of these devices is to deviate the blood flow away from the aneurysm and promote its thrombosis and exclusion from the circulation. Patient-specific computational fluid dynamics modeling of the hemodynamics in stented cerebral aneurysms is therefore important for designing new flow diverting devices, for evaluating the relative performance of different devices in order to select the most appropriate one for a given aneurysm, and for personalizing the planning of minimally invasive endovascular interventions. This paper summarizes our research in the development and application of image-based computational fluid dynamics (CFD) modeling of cerebral aneurysms with the goal of better understanding the mechanisms responsible for their pathogenesis, progression and rupture, and improving patient evaluation and treatment.
2. PATIENT-SPECIFIC CFD MODELING
2.1. Computational Modeling Pipeline
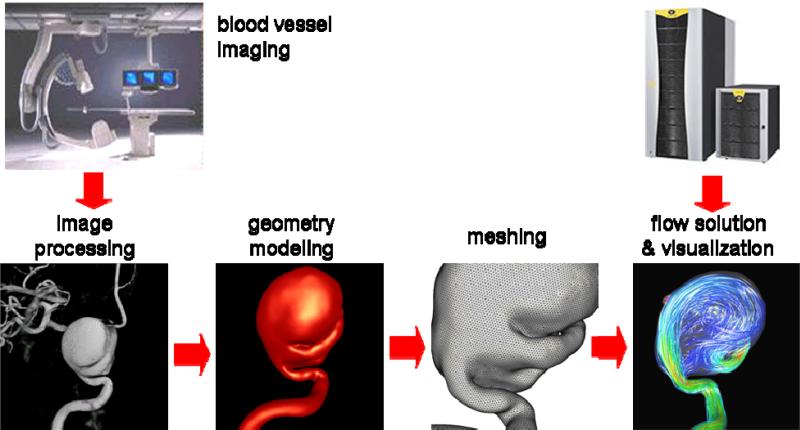
The set of steps followed to construct patient-specific computational fluid dynamics models of blood flows in cerebral aneurysms from medical images is called a computational modeling pipeline or chain [7]. This pipeline is composed of the following main steps: a) vascular modeling, b) blood flow modeling, and c) flow visualization. The fundamental steps of this modeling chain are illustrated schematically in Figure 1.
Figure 1.
Image-based CFD modeling pipeline.
2.2. Vascular Modeling
The first part of the modeling process is to construct a geometrical model of the patient-specific vascular anatomy from 3D medical images. This process consists in the following steps: a) image acquisition, b) image filtering, c) image segmentation, d) iso-surface extraction, e) surface deformable model, f) surface optimization, and g) tetrahedral volume meshing.
The preferred imaging modality is 3D rotational angiography (3DRA) because it has the highest resolution and contrast between the vessels and surrounding tissue. These images are acquired by taking a sequence of X-ray images at different angles during an intra-arterial injection of contrast agent. The projection images are then used to reconstruct a volumetric image with isotropic voxels. Typically 120 projection images are obtained during a 4 seconds rotation of 180 degrees. Typical injection rates are 4 cc/s for a total of 24 cc in order to completely fill the vessels during the rotational imaging. The reconstructed 3D images usually consists of 2563 isotropic voxels with a resolution of approximately 0.2 mm. Although this imaging modality is invasive it is the gold standard for quantifying the vascular anatomy and is routinely used for diagnosis and treatment of cerebral aneurysms. Other less invasive imaging modalities such as computed tomography angiography (CTA) and magnetic resonance angiography (MRA) can also be used. Different modalities have different resolutions, noise levels, and artifacts. They also depict non-vascular structures with different intensities, and are typically reconstructed into different numbers of anisotropic voxels, etc. Therefore each modality requires slightly different processing approaches. In what follows we focus on 3DRA images.
In order to construct a patient-specific vascular model, the 3D images are first filtered in order to reduce the noise and increase the contrast between the vessels and surrounding tissues. This is done by applying a set of filters such as sharpening [8], Gaussian blurring [9], anisotropic diffusion [10], or vessel enhancement filters [11]. These techniques aim at smoothing out nonvascular structures and at the same time increase the vessel contrast while preserving their boundaries. The second step is to segment the vessels, which consists in classifying the image voxels into vascular and non-vascular structures. This is carried out with a seeded region growing algorithm that masks all the voxels topologically connected to the selected seed voxel and with intensity in a specified range [8]. The intensity range or thresholds are selected by trial and error. A few region growing steps can be applied to mark all the voxels necessary to obtain a topologically correct vascular model. Once the image has been segmented, an iso-intensity surface is extracted using a marching tetrahedra algorithm [8]. This initial surface is used as a deformable model that is allowed to deform under the influence of internal elastic forces and external forces from the image intensity gradient [12]. This process tends to place the surface nodes at the vessel boundaries detected in the 3D images, thus achieving sub-voxel accuracy and making the vascular model independent from the thresholds selected to segment the images. The vascular model is then smoothed with a non-shrinking algorithm [13], optimized via edge collapses and diagonal swaps [8], and the vessels are then cut perpendicularly to their axes. Finally, a volumetric grid is generated using an advancing front method that first re-triangulates the surface with the desired element size distribution and then fills the volume with tetrahedral elements [7, 14, 15].
2.3. Blood Flow Modeling
Blood is mathematically modeled as a continuous incompressible fluid. The governing equations are the unsteady 3D Navier-Stokes equations, which can be written as:
| (1) |
| (2) |
where u is the velocity field, ρ the density, p the pressure, τ the deviatoric stress tensor, and F represents any externally applied body forces such as gravity. For Newtonian fluids the deviatoric stress tensor can be written as:
| (3) |
where μ is the viscosity, and the strain rate tensor is defined as:
| (4) |
Typical values for blood are ρ=1.0 g/cm3 and μ=0.04 dyne s/cm. The non-Newtonian model of Casson [16] has been used to approximate the rheologic behavior of blood. In this case, the relationship between the shear stress and strain rate is given by:
| (5) |
where τ0 is the yield stress and μ0 the asymptotic Newtonian viscosity. Typical values used for these constants that fit empirical data for blood are: τ0=0.04 dyne/cm2 and μ0=0.04 dyne s/cm. The values of these constants depend on the Hematocrit which is the volume fraction of red blood cells. The strain rate is computed from the second invariant of the strain rate tensor [17], which for incompressible fluids takes the form:
| (6) |
The apparent viscosity can be written as:
| (7) |
Since the apparent viscosity grows indefinitely as the strain rate is reduced, alternative expressions have been used for numerical simulations. One such formula is [18]:
| (8) |
with values of m>100 reported to produce satisfactory results [19]. Arguably, the blood flow in large arteries is reasonably approximated by a Newtonian model because of the relatively large shear rates. Conversely, non-Newtonian effects are expected to become more important in cases with slow flows such as in some aneurysms or aneurysms that have been treated with flow diverting devices that tend to slow the flow even more. However, the relative importance of these effects is still not well understood and deserves further research.
The numerical solution of the governing equations is obtained by writing a fully implicit scheme for the flow equations and solving an equivalent steady state problem at each time-step using an LU-SGS scheme to advance the equations in pseudo-time [7, 20]. The space discretization is performed using finite elements on unstructured tetrahedral grids. This approach allows arbitrary time step sizes. Typically 100-200 timesteps are taken per cardiac cycle and the simulations are run for at least two cardiac cycles.
Recently, a method for finding the numerical solution of the incompressible flow equations efficiently has been developed [21]. The idea of the method is based on two observations: a) hemodynamics application typically involve flows in tubular branching structures, and b) a one dimensional model of blood flow yields the exact solution of the incompressible flow in a straight tube. In incompressible flows, the pressure field is established instantaneously:
| (9) |
Solving this equation requires propagating information back and forth between the inlet and the outlets of the computational domain, and constitutes the most time consuming step of incompressible flow solvers. Discretization of this pressure equation results in a symmetric positive definite algebraic system of the form:
| (10) |
The preferred solution method for this algebraic system is the Conjugate Gradients (CG) algorithm, which minimizes a functional of the form:
| (11) |
by generating A-orthogonal search directions
| (12) |
where βk are calculated from:
| (13) |
The error bound of the CG algorithm is given by
| (14) |
where κ = λmax / λmin is the spectral condition number of A, the ratio of the largest to the smallest eigenvalue of A. It has been shown that when the extreme eigenvalues are discovered, they can be “removed” from κ and the convergence rate speeds-up. This is the aim of the Deflated Conjugate Gradients (DCG) algorithm. The basic idea is that given a subspace W ⊂ Rn, the search space can be divided into Rn = W ⊗ W⊥ and the CG algorithm can be restricted to W⊥ by enforcing extra conjugacy conditions:
| (15) |
where βk are calculated from equation (13) and ck from the conjugacy between dk+1 and W:
| (16) |
In tubular or elongated domains, the lowest eigenmodes of the Laplace operator are oriented along the longest direction. Thus, if we construct deflation subdomains by agglomerating nodes along the vessel axis, we can eliminate the lowest eigenmodes first and accelerate the convergence. The matrix W is then constructed by associating each subdomain with a matrix column and assigning to its coefficients a value of 1 if the node belongs to the subdomain and 0 otherwise. Then, the solution of the system of equations (16) is obtained with a direct solver since it is relatively small (the dimension of W is the number of subdomains). It has been shown that this approach yields exactly the same solution as the traditional CG algorithm but with a significant reduction in the computing time [22].
2.4. Boundary conditions
Pulsatile physiologic flow conditions are prescribed at the inlet boundaries. Flow rate waveforms derived from phase-contrast magnetic resonance images obtained on normal subjects are scaled with the inflow vessel area in order to achieve a 15 dyne/cm2 wall shear stress at the inlet [23]. Fully developed Womersley velocity profiles are used to impose the flow boundary conditions at the inlets [24]. Vessel walls are assumed rigid and no-slip boundary conditions are applied at the walls.
3. HEMODYNAMICS AND CLINICAL EVENTS
3.1. Hemodynamics and Rupture
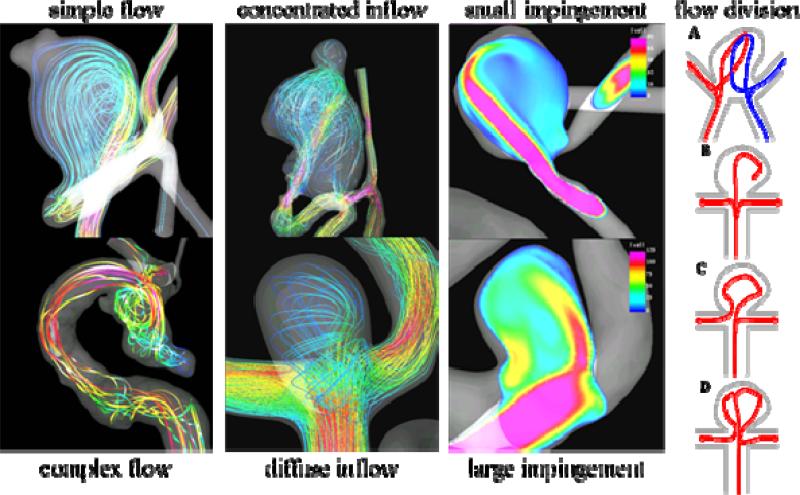
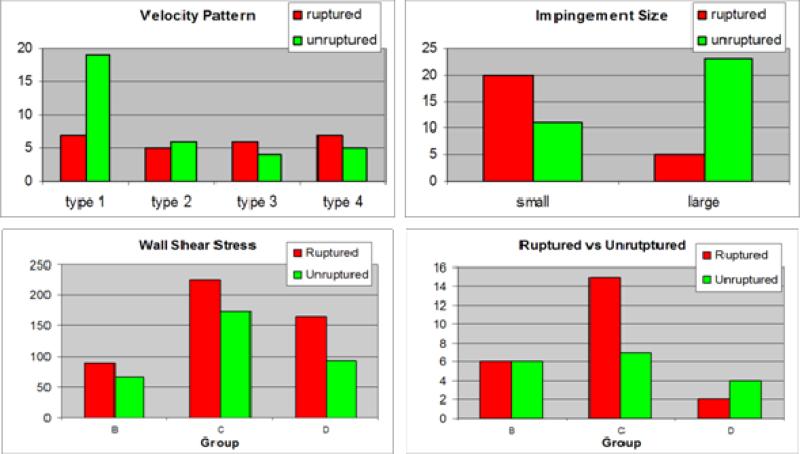
Using the computational modeling pipeline described earlier, patient-specific models of cerebral aneurysms were constructed from 3D rotational angiography images and the hemodynamic characteristics observed in ruptured and unruptured aneurysms were compared. In one study, the blood flow patterns in 61 aneurysms were analyzed [25]. In this study, visualizations of the intra-aneurysmal velocity field were inspected and the flow patterns were classified as simple or complex, stable or unstable. Additionally, the inflow jet was classified as concentrated (thin) or diffuse (thick), and the flow impingement region as small or large compared to the size of the aneurysm (Figure 2). It was found that ruptured aneurysms tend to have complex and or unstable flow patterns, concentrated inflow jets and small impingement regions. Conversely, unruptured aneurysms were more likely to have simple stable flow patterns, broad or diffuse inflow jets and large impaction zones (Figure 3 – top row).
Figure 2.
Aneurysm flow characteristics.
Figure 3.
Hemodynamic characteristics in ruptured and unruptured cerebral aneurysms.
Since this study was based on 3DRA images, it excluded aneurysms in the anterior communicating artery (ACom) because not all avenues of flow were properly depicted as only a single injection in one of the internal carotid arteries was typically used to image these aneurysms. For this reason, the methodology was extended to construct models of aneurysms in the ACom from bilateral 3DRA images [26]. Then, using this methodology, the flow dynamics in 26 models of ACom aneurysms was analyzed [27]. This study found that the majority of aneurysms had complex flow structures, that aneurysms with small impaction zones were more likely to have ruptured than those with large impaction zones, and that on average ruptured aneurysms had maximum wall shear stress larger (by a factor of 2) than unruptured aneurysms. In addition, the flow patterns were classified according to how the flow streams splits from the parent artery into the aneurysm and the efferent or daughter vessels (Figure 2 – rightmost column). It was found that the majority of ruptured aneurysms had asymmetric flow division patterns (type C of Figure 2).
In a subsequent study, the flow structures in 42 aneurysms of the terminal morphological type were analyzed [28]. The findings of this study were in agreement with the previous results obtained for ACom aneurysms, namely, aneurysms with asymmetric flow divisions and high maximum wall shear stress were more likely to be associated with previous history of rupture (Figure 3 – bottom row).
3.2. Case Studies: Hemodynamics Prior to Rupture
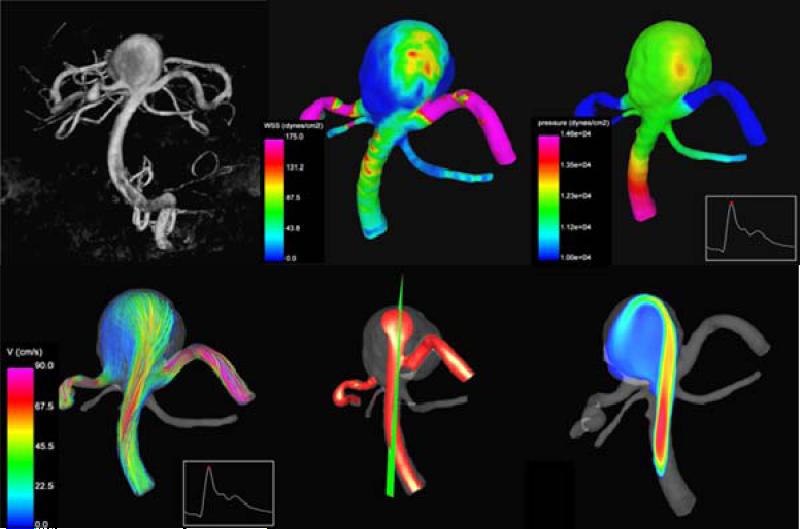
The studies described before identified certain flow characteristics as more likely to occur in ruptured than unruptured aneurysms. Thus, they could perhaps be used to better stratify or assess the rupture risk of cerebral aneurysms. Recently, two case studies of unruptured aneurysms that were imaged, left untreated, and subsequently ruptured within a few hours. These cases provide the rare opportunity to investigate the hemodynamic characteristics in aneurysms right before their rupture. In the first study the hemodynamics in a fusiform aneurysm of the basilar artery was analyzed [29]. It was found that the aneurysm had a concentrated inflow jet that impacted on a small region of the dome of the aneurysm and created a complex unstable flow pattern (Figure 4).
Figure 4.
Hemodynamics in a fusiform aneurysm of the basilar artery prior to its rupture.
In the second study, the blood flow dynamics in a terminal saccular aneurysm at the tip of the basilar artery was analyzed [30]. In this case it was also found that the aneurysm had a concentrated inflow jet, small impaction zone on the body (side wall) of the aneurysm, elevated wall shear stress, as well as an asymmetric flow division from the parent artery (Figure 5).
Figure 5.
Hemodynamic characteristics of a terminal aneurysm at the tip of the basilar artery right before its rupture.
These two case studies show that the hemodynamics characteristics observed in these aneurysms right before their rupture are consistent with previous studies connecting aneurysm rupture and hemodynamic patterns in saccular and terminal aneurysms. These studies then support the notion that hemodynamic information may be used to help stratify the rupture risk of cerebral aneurysms.
3.3. Hemodynamics and Wall Motion
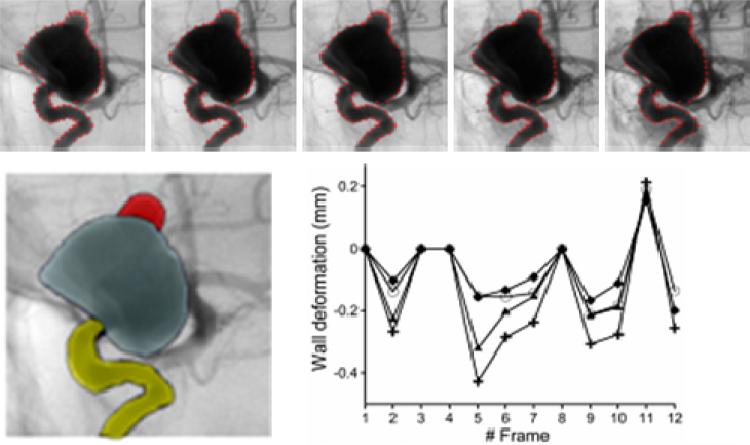
Previous studies suggest that elevated wall shear stress caused by the impaction of a concentrated inflow jet may have a damaging effect on the arterial wall. A recent study of the relationship between wall shear stress and aneurysm formation in animal models showed that elevated wall shear stress gradients tend to damage the arterial wall promoting aneurysm formation [31]. Another study of the motion of the arterial wall of cerebral aneurysms based on dynamic digital subtraction angiography (DSA) showed that the bleb of an aneurysm had a larger deformation amplitude (by a factor of about two) than the rest of the aneurysm sac [32]. In that study, the wall motion was quantified from high frame rate biplane angiography images obtained during an 8 sec contrast injection. Non-rigid image registration algorithms, which establish correspondences between points in two different images, were used to track landmark points selected on the aneurysm and vessel walls [32, 33]. An example is presented in Figure 6. The top row shows the propagation of landmark points between different frames of the dynamic image sequence. The left panel of bottom row shows the regions selected to quantify the motion in the bleb, the aneurysm and the parent artery. The right panel of the bottom row shows the deformation amplitude of each of the regions during the acquisition time. In these curves, the amplitude of the pulsation of the bleb is larger than that of the aneurysm and the parent artery. Similar observations were reported in a study of wall motion based on dynamic computed tomography angiography (CTA) [34].
Figure 6.
Estimation of aneurysm wall motion from dynamic biplane angiography.
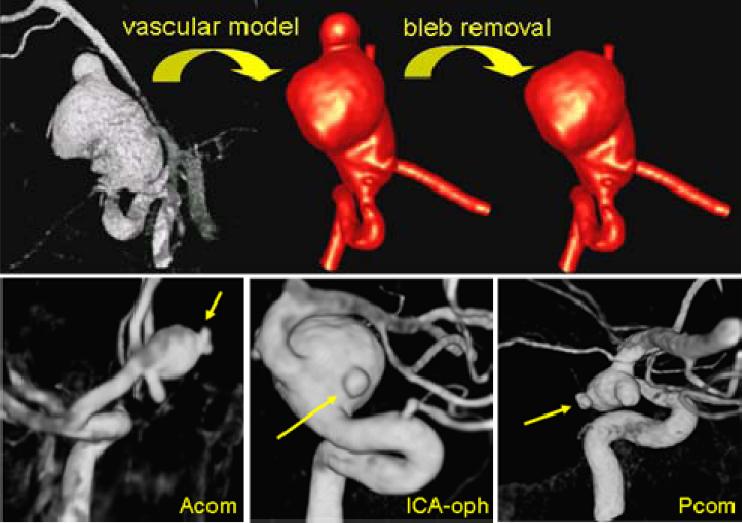
The previous observations suggest that blebs deform at a larger rate perhaps because of a locally weaker aneurysm wall. Therefore, a focalized injury of the arterial wall is likely the reason of the formation of the bleb. So the question is: what caused this focalized injury to the arterial wall? Our hypothesis is that mechanobiological processes induced by elevated wall shear stress caused by the impaction of the inflow jet on the aneurysm wall are responsible for this local damage and thus for the formation of a bleb [35]. In order to investigate this hypothesis, 20 aneurysm harboring 30 well defined blebs were studied [36]. For each aneurysm, two models were constructed, one representing the aneurysm before the bleb was formed and another the aneurysm with the bleb already formed. The former model was created by smoothing out the bleb from the vascular model obtained from the 3DRA image (Figure 7). Then, the aneurysmal hemodynamics before and after bleb development were simulated.
Figure 7.
Modeling aneurysms before and after bleb formation (top row) and examples of aneurysms with well defined blebs (bottom row).
In this study, it was found that most blebs (80%) occurred at or adjacent to the aneurysm region with the highest WSS before bleb formation, and near the flow impaction zone. Most blebs (83%) were found in regions of the aneurysm previously subjected to high or moderate WSS, and progressed to low WSS states after the blebs were formed. Most blebs (77%) were aligned or adjacent to the inflow jet, while 17% were aligned with the outflow jet, and only 6% were not aligned with the flow direction. Additionally, 90% of the aneurysms had maximum WSS higher than or similar to the WSS in the parent artery. This study then seems to indicate that the development of blebs results in a lower WSS state with formation of a counter current vortex (Figure 8). These findings imply that locally elevated WSS could contribute to the focalized wall damage that formed these structures.
Figure 8.
Wall shear stress distribution (top row) and flow patterns (bottom row) in three cerebral aneurysms before and after bleb formation.
4. HEMODYNAMICS AND ENDOVASCULAR TREATMENT
4.1. Virtual Stenting Pipeline
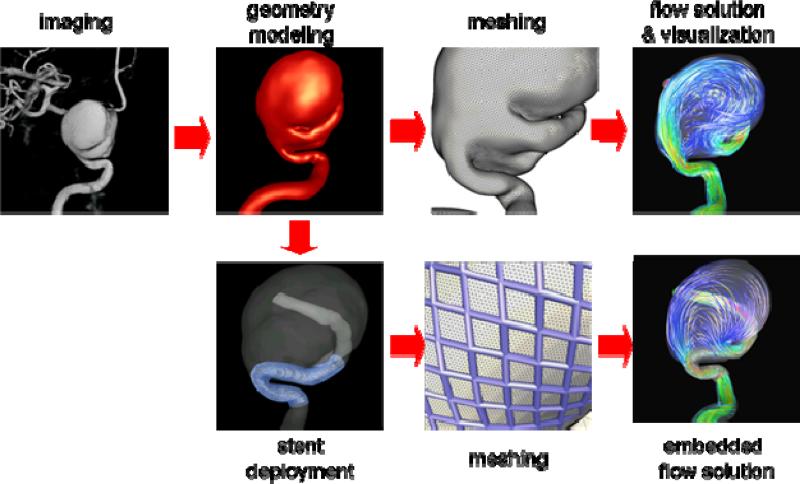
The computational modeling pipeline described before has been extended in order to model the hemodynamics in stented aneurysms [20]. Starting from the anatomical model of the aneurysm and parent artery, the stented aneurysm modeling chain consists of the following steps: i) stent deployment, ii) meshing, and iii) embedded grid flow solution and visualization. The components of the computational modeling pipeline are schematically represented in Figure 9. In what follows a brief description of each stage is presented.
Figure 9.
Virtual stenting pipeline.
4.2. Stent Deployment
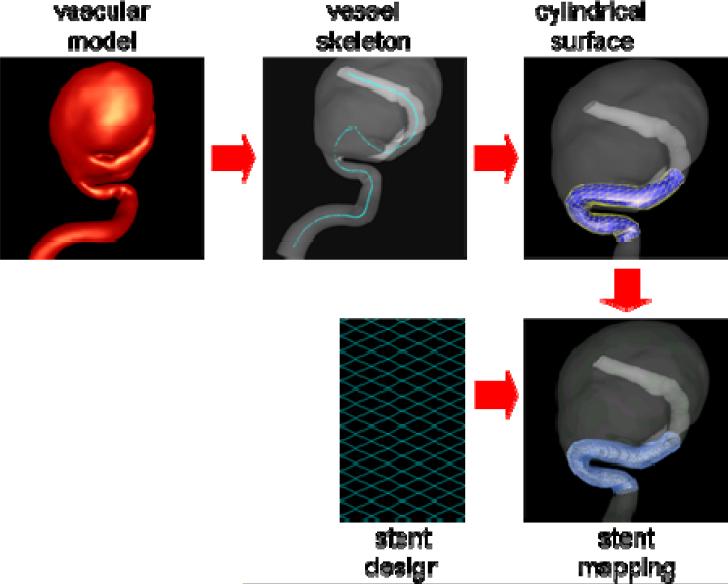
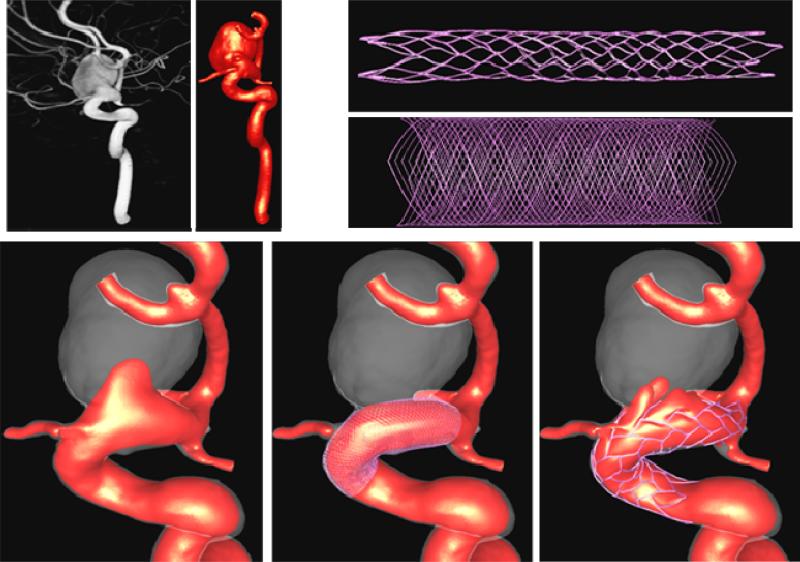
The methodology for deployment of stents into patient-specific vascular geometries consists of the following steps: a) construction of the vessel skeleton, b) creation and deformation of a cylindrical support surface, c) specification of the stent design, and d) mapping the stent design [37]. The methodology is schematically presented in Figure 10. The extraction of the vessel's skeleton is done by a minimal cost path construction algorithm [38]. The basic idea is to connect the two endpoints of the skeleton (manually selected) by the minimum arclength path that travels along the local maxima of the distance map. A discrete cylindrical surface is then generated along the centerline of the parent vessel. This surface is then deformed to improve the fitting quality to the vessel wall. This is carried out by a combination of external and internal smoothing forces. The external forces consist of an inflating force (or radial force) that is computed as the distance vector between the points in the cylindrical surface and the centerline. The internal smoothing forces are based on the classical smoothing Laplacian operator. The deformation process is performed interactively and stopped when most of the points of the cylindrical surface are on the vessel wall. The deformed cylindrical surface is used as a support surface to map different stent designs. The stent designs are drawn on a 2D rectangle as a collection of connected lines with appropriate thickness. This 2D rectangle is a discrete surface that matches the host cylinder in the number and distribution of triangular elements. The mapping process transforms points from triangles in the 2D surface to triangles in the cylindrical surface conforming to the vessel walls using local triangular coordinates.
Figure 10.
Virtual stent deployment.
4.3. Embedded Grids
In order to automate the meshing of vascular structures with implanted endovascular devices such as stents, an adaptive unstructured grid embedding technique has been developed [39]. The basic idea is to first mesh the vascular model with a body fitted unstructured grid as explained earlier. Then, the endovascular device is embedded into this grid. The edges of the grid elements cut by the device surface are identified. The elements containing these edges are adaptively refined in order to increase the mesh resolution around the device. This is repeated a number of times (typically 3 or 4 times). Then, new no-slip boundary conditions are added at the intersection between the grid edges and the device surface. This requires minimal modification of the finite element flow solver while allowing for complete automation of the modeling of the flow with the implanted device. This method provides a rough representation of the geometry of the device wires, as schematically shown in Figure 11. However, it has been shown that for the typical Reynolds numbers encountered in stented aneurysms 2-4 levels of refinement yield accurate results [39].
Figure 11.
Modeling stents with adaptive embedded unstructured grids.
4.4. Boundary Conditions
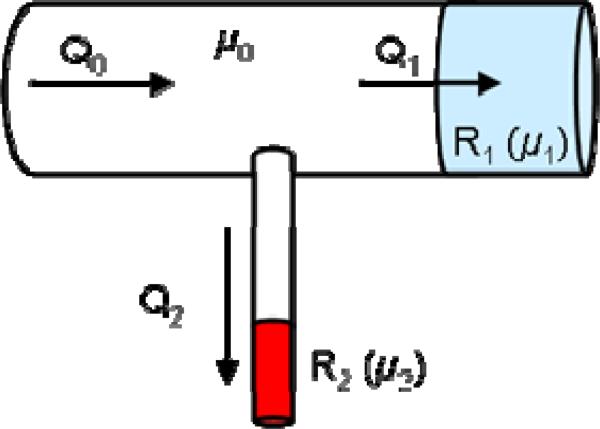
At the model outlets, resistive boundary conditions representing the flow resistance of the distal vascular beds are applied. For this purpose, a cylinder of approximately 3 vessel diameters in length is added at each outlet boundary. Then, the viscosity in these cylindrical tubes is adjusted to achieve the desired resistance value. Using Poiseuille's formula [40], the pressure drop in the tube can be written as:
| (17) |
where Δp is the pressure drop, Q the flow rate and R the resistance, given by:
| (18) |
where μ is the viscosity, L the length of the tube, and a its radius. This formula can be used to calculate the value of the viscosity needed to obtain the desired resistance at each outflow tube. The prescription of resistive boundary conditions using this approach is schematically illustrated in Figure 12.
Figure 12.
Imposing resistive boundary conditions with viscous tubular blocks.
The values of the resistances used for each outflow boundary are calculated in order to achieve a flow division that does not produce a substantial change in the wall shear stress from the value of the parent artery. This assumes that the arterial network is close to the optimal design point given by Murray's law based on the principle of minimal work [41]. After adjusting the resistance values in this way for the pre-stenting models, these values are kept constant for the post-stenting calculations. This assumes that the resistance values of the distal vascular beds remain the same after stenting.
4.5. Effect of Stent Design
The techniques described above were demonstrated by analyzing the effects of different stent designs on the flow pattern and inflow disruption in cerebral aneurysms [42]. For example, two stents were virtually deployed into a patient-specific CFD model of an aneurysm of the internal carotid artery and the corresponding blood flow fields were computed. The results (Figure 13) as expected showed that the denser stent had a larger effect, substantially reducing the inflow velocity, while the more porous stent only disrupted the inflow stream but did not significantly alter its speed. This example illustrates how image-based CFD models can be used in the design cycle of new flow diverting devices by performing “virtual testing” of the proposed designs on realistic arterial geometries.
Figure 13.
Modeling the flow alteration produced by the deployment of two different stent designs in a cerebral aneurysm of the internal carotid artery.
4.6. Flow Modification after Stenting
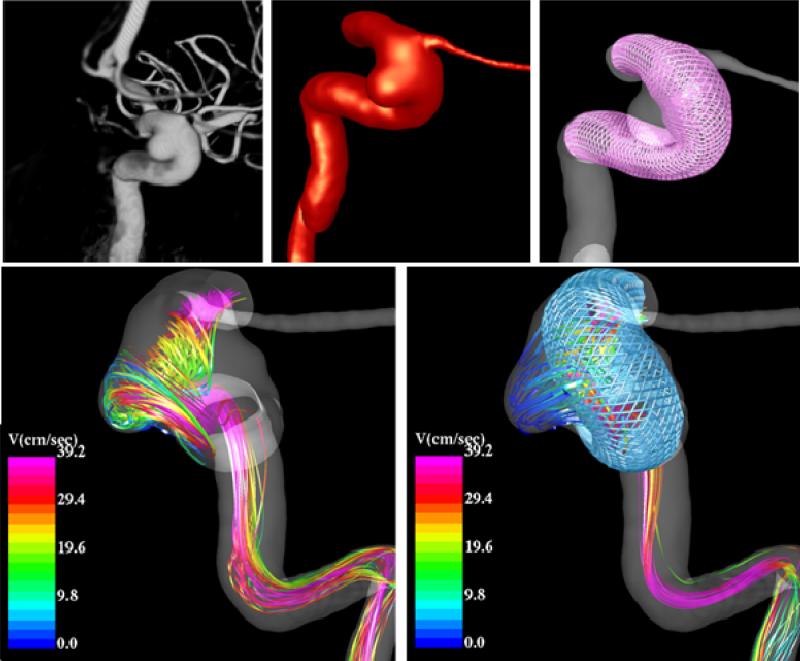
In addition to analyzing the possible effects of different stent designs image-based CFD models can be used to connect the changes in the hemodynamics after stenting and the outcome of the interventions. Preliminary results from a cerebral aneurysm in the internal carotid artery near the origin of the ophthalmic artery that was treated solely with a braided flow diverting stent are shown in Figure 14. It can be seen that after the stent has been deployed, the intra-aneurysmal flow pattern is simpler, smoother, has less swirling, is more organized, and has a lower velocity. These hemodynamic conditions are presumably favorable for thrombosis and occlusion of the aneurysm.
Figure 14.
Blood flow pattern in a cerebral aneurysm before and after treatment with a flow diverting stent.
Velocity iso-surfaces corresponding to a blood speed of 10 cm/s are presented in Figure 15 before (left) and after (right) stenting along with the 3D angiography images obtained just prior to treatment (left) and at a three months follow up exam (right). It can be seen that the stent blocks most of the flow into the aneurysm, leaving a small region of the inflow with velocity around 10 cm/s. Interestingly, in the follow up exam, the aneurysm seems to be almost completely thrombosed except for a small region in the inflow region where higher velocities were predicted by the CFD model. These preliminary results suggest that aneurysms can successfully be treated with flow diverting devices that create the right intra-aneurysmal hemodynamic conditions, namely low speed, organized, simple and smooth flow pattern.
Figure 15.
Visualization of velocity iso-surfaces before and after stenting and relationship to the 3D angiograms obtained right before stenting and at a follow up examination.
4.7. Flow in Jailed Arteries
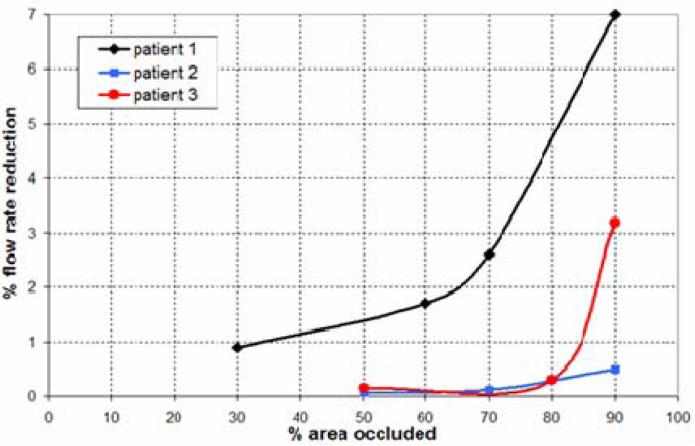
A recent study investigated the flow reduction in side arterial branches or perforators when crossed by a stent used to treat an intracranial aneurysm [43]. In this study, three image-based models were considered. In two of these aneurysms, the ophthalmic artery was jailed by the stent, while in the third a perforating artery was added to the vascular model opposite to the aneurysm neck. Resistive outflow boundary conditions were prescribed as explained before. The stent wire size was varied to achieve different levels of occlusion of the origin of the side branches, and the corresponding reduction in the flow rate through the jailed branch was recorded. The results of this study indicate that, because of the large resistance of the distal vascular beds which dominate the flow divisions among the different arterial branches, the flow reduction in the jailed side branches is quite small even when a large percentage of the inlet area of these branches has been blocked (Figure 16). This suggests that unless the side branch is completely occluded, it will likely maintain its blood flow rate at a normal level. Although this conclusion eases the concern of stenting intracranial aneurysms, a complete occlusion can still be caused depending on the conformability characteristics of the stents.
Figure 16.
Flow reduction in jailed arterial branches after cerebral artery stenting. The flow rate reduction is plotted against the percent of the area of the side branch occluded by the stent wires.
5. CONCLUSIONS AND OUTLOOK
Image-based computational modeling techniques are capable of realistically representing the patient-specific in vivo hemodynamic conditions in cerebral aneurysms. The two most interesting aspects of these patient-specific models of intracranial aneurysms are: a) they can be used to connect hemodynamic characteristics to clinical events and observations (such as aneurysmal growth or rupture) in order to better understand the mechanisms governing their progression and better assess the rupture risk, and b) they can be used to predict the effects produced by different treatments such as stenting and coiling, which is useful for improving current design of endovascular flow diverting devices and better plan the management of patients with cerebral aneurysms. It is our hope that the current convergence of medical imaging, numerical simulation, and computer hardware technologies will enable the use of patient-specific models in routine clinical practice in the near future and result in better patient management including diagnosis and treatment.
6. ACKNOWLEDGEMENTS
We thank Philips Medical Systems, Boston Scientific and the National Institutes of Health (grant # R01NS059063) for financial support.
Footnotes
Extended version of keynote paper presented at the ‘1st Int. Conf. on Computational and Mathematical Biomedical Engineering, Swansea, June 30 - July 1, 2009’
7. REFERENCES
- 1.Stehbens WE. Pathology of the Cerebral Blood Vessels. 1972. Intracranial aneurysms; pp. 351–470. [Google Scholar]
- 2.Weir B. Unruptured intracranial aneurysms: a review. Journal of Neurosurgery. 2002;96:3–42. doi: 10.3171/jns.2002.96.1.0003. [DOI] [PubMed] [Google Scholar]
- 3.Wiebers DO, Piepgras DG, Meyer FB, Kallmes DF, Meissner I. Pathogenesis, natural history, and treatment of unruptured intracranial aneurysms. Mayo Clinic Proc. 2004;79:1572–1583. doi: 10.4065/79.12.1572. [DOI] [PubMed] [Google Scholar]
- 4.Lylyk P, Ferrario A, Pasbon B, Miranda C, Doroszuk G. Buenos Aires experience with the Neuroform self-expanding stent for the treatment of intracranial aneurysms. Journal of Neurosurgery. 2005;102(2):235–241. doi: 10.3171/jns.2005.102.2.0235. [DOI] [PubMed] [Google Scholar]
- 5.Lövbald KO, Yilmaz H, Chouiter A, Ruiz D, Abdo G, Bijlenga P, Tribolet N, Rüfenacht DA. Intracranial aneurysm stenting: follow-up with MR angiography. J Mag Res Imaging. 2006;24:418–422. doi: 10.1002/jmri.20642. [DOI] [PubMed] [Google Scholar]
- 6.Szikora I, Berentei Z, Kulcsar Z, Barath K, Berez A, Bose A, Nyary I. Endovascular treatment of intracranial aneurysms with parent vessel reconstruction using balloon and self expandable stents. Acta Neurichirurgica. 2006;148:711–723. doi: 10.1007/s00701-006-0785-6. [DOI] [PubMed] [Google Scholar]
- 7.Cebral JR, Castro MA, Appanaboyina S, Putman CM, Millan D, Frangi AF. Efficient pipeline for image-based patient-specific analysis of cerebral aneurysm hemodynamics: Technique and sensitivity. IEEE Transactions in Medical Imaging. 2005;24(1):457–467. doi: 10.1109/tmi.2005.844159. [DOI] [PubMed] [Google Scholar]
- 8.Cebral JR, Löhner R. From medical images to anatomically accurate finite element grids. International Journal for Numerical Methods in Engineering. 2001;51:985–1008. [Google Scholar]
- 9.Beutel J, Sonka M. Handbook of medical imaging, Volume 2: Medical image processing and analysis. PM80. SPIE Press monograph; 2000. [Google Scholar]
- 10.Weickert J. Anisotropic diffusion in image processing. Teubner-Verlag; Stutgart, Germany: 1998. (ECMI Series). [Google Scholar]
- 11.Frangi AF. Multiscale vessel enhancement filtering. Lecture Notes in Computer Science. 1998;1496:130–137. [Google Scholar]
- 12.Yim PJ, Boudewijn G, Vasbinder B, Ho VB, Choyke PL. Isosurfaces as deformable models for magnetic resonance angiography. IEEE Trans on Medical Imaging. 2003;22(7):875–881. doi: 10.1109/TMI.2003.815056. [DOI] [PubMed] [Google Scholar]
- 13.Taubin G. A signal processing approach to fair surface design.. Proc. 22nd Annual Conference on Computer Graphics and Interactive Techniques (SIGGRAPH 1995).; Los Angeles, CA. Aug. 6-11.1995. [Google Scholar]
- 14.Löhner R. Regridding surface triangulations. Journal of Computational Physics. 1996;126:1–10. [Google Scholar]
- 15.Löhner R. Automatic unstructured grid generators. Finite Elements in Analysis and Design. 1997;25:111–134. [Google Scholar]
- 16.Casson M. Rheology of Dispersive Systems. Pergamon Press; New York: 1959. [Google Scholar]
- 17.Perktold K, Peter R, Resch M. Pulsatile non-Newtonian blood flow simulation through a bifurcation with an aneurysm. Biorheology. 1989;26(6):1011. doi: 10.3233/bir-1989-26605. [DOI] [PubMed] [Google Scholar]
- 18.Papanastasiou TC. Flow of materials with Yield. Journal of Rheology. 1987;31:385–404. [Google Scholar]
- 19.Neofitou P, Drikakis D. Non-Newtonian modeling effects on stenotic channel flows.. ECCOMAS CFD.; Swansea, Wales, U.K.. Sept. 4-7.2001. [Google Scholar]
- 20.Cebral JR, Löhner R. Efficient simulation of blood flow past complex endovascular devices using an adaptive embedding technique. IEEE Transactions in Medical Imaging. 2005;24(4):468–477. doi: 10.1109/tmi.2005.844172. [DOI] [PubMed] [Google Scholar]
- 21.Aubry R, Mut F, Löhner R, Cebral JR. Deflated preconditioned conjugate gradients solvers for the pressure Poisson equation. J Comp Phys. 2008;227(24):10196–10208. [Google Scholar]
- 22.Mut F, Aubry R, Löhner R, Cebral JR. Fast numerical solutions in patient-specific simulations of arterial models. Comm Num Meth Eng. 2009 doi: 10.1002/cnm.1235. DOI 10.1002/cnm.1235. [DOI] [PMC free article] [PubMed] [Google Scholar]
- 23.Cebral JR, Castro MA, Putman CM, Alperin N. Flow-area relationship in internal carotid and vertebral arteries. Physiol Meas. 2008;29:585–594. doi: 10.1088/0967-3334/29/5/005. [DOI] [PMC free article] [PubMed] [Google Scholar]
- 24.Taylor CA, Hughes TJR, Zarins CK. Finite element modeling of blood flow in arteries. Vol. 158. Computer Methods in Applied Mechanics and Engineering; 1998. pp. 155–196. [Google Scholar]
- 25.Cebral JR, Castro MA, Burgess JE, Pergolizzi R, Sheridan MJ, Putman CM. Characterization of cerebral aneurysm for assessing risk of rupture using patient-specific computational hemodynamics models. AJNR American Journal of Neuroradiology. 2005;26:2550–2559. [PMC free article] [PubMed] [Google Scholar]
- 26.Castro MA, Putman CM, Cebral JR. Patient-Specific Computational Modeling of Cerebral Aneurysms with Multiple Avenues of Flow from 3D Rotational Angiography Images. Academic Radiology. 2006;13(7):811–821. doi: 10.1016/j.acra.2006.03.011. [DOI] [PubMed] [Google Scholar]
- 27.Castro MA, Putman CM, Sheridan MJ, Cebral JR. Hemodynamic patterns of anterior communicating artery aneurysms: a possible association with rupture. AJNR American Journal of Neuroradiology. 2009;30(2):297–302. doi: 10.3174/ajnr.A1323. [DOI] [PMC free article] [PubMed] [Google Scholar]
- 28.Castro MA, Putman CM, Radaelli A, Frangi AF, Cebral JR. Hemodynamics and rupture of terminal cerebral aneurysms. Academic Radiology. 2009;16:1201–1207. doi: 10.1016/j.acra.2009.03.022. [DOI] [PubMed] [Google Scholar]
- 29.Cebral JR, Hendrickson S, Putman CM. Hemodynamics in a lethal basilar artery aneurysm just before its rupture. AJNR American Journal of Neuroradiology. 2009;30(1):95–98. doi: 10.3174/ajnr.A1312. [DOI] [PMC free article] [PubMed] [Google Scholar]
- 30.Sforza D, Putman CM, Scrivano E, Lylyk P, Cebral JR. Blood flow characteristics in a terminal basilar tip aneurysm prior to its fatal rupture. AJNR American Journal of Neuroradiology. 2009 doi: 10.3174/ajnr.A2021. in press. [DOI] [PMC free article] [PubMed] [Google Scholar]
- 31.Meng H, Swart DD, Wang Z, Hoi Y, Kolega J, Metaxa EM, Szymanski MP, Yamamoto J, Sauvageau E, Levy EI. A model system for mapping vascular responses to complex hemodynamics at arterial bifurcations in vivo. Neurosurgery. 2006;59(5):1094–1101. doi: 10.1227/01.NEU.0000245599.92322.53. [DOI] [PMC free article] [PubMed] [Google Scholar]
- 32.Dempere-Marco L, Oubel E, Castro MA, Putman CM, Frangi AF, Cebral JR. Estimation of wall motion in intracranial aneurysms and its effects on hemodynamic patterns. Lecture Notes in Computer Science. 2006;4191:438–445. [Google Scholar]
- 33.Oubel E, DeCraene M, Putman CM, Cebral JR, Frangi AF. Analysis of intracranial aneurysm wall motion and its effects on hemodynamic patterns.. SPIE Medical Imaging.; San Diego, CA. 2007. [Google Scholar]
- 34.Hayakawa M, Katada K, Anno H, Imizu S, Hayashi K, Irie K, Negoro M, Kato Y, Kanno T, Sano H. CT Angiography with electrocardiographically gated reconstruction for visualizing pulsation of intracranial aneurysms: identification of aneurysmal protuberance presumably associated with wall thinning. AJNR American Journal of Neuroradiology. 2005;26:1366–1369. [PMC free article] [PubMed] [Google Scholar]
- 35.Cebral JR, Radaelli A, Frangi AF, Putman CM. Hemodynamics before and after bleb formation in cerebral aneurysms.. SPIE Medical Imaging.; San Diego, CA. 2007. [Google Scholar]
- 36.Cebral JR, Sheridan MJ, Putman CM. Hemodynamics and Bleb Formation in Intracranial Aneurysms. AJNR American Journal of Neuroradiology. 2009 doi: 10.3174/ajnr.A1819. in press. [DOI] [PMC free article] [PubMed] [Google Scholar]
- 37.Mut F, Appanaboyina S, Cebral JR. Simulation of stent deployment in patient-specific cerebral aneurysm models for their hemodynamics analysis.. ASME Summer Bioengineering Conference.; Marco Island, Florida. June 25-29.2008. [Google Scholar]
- 38.Antiga L, Ene-Iordache B, Remuzzi A. Centerline computation and geometric analysis of branching tubular surfaces with application to blood vessel modeling. Visualization and Computer Vision. 2003 [Google Scholar]
- 39.Appanaboyina S, Mut F, Löhner R, Putman CM, Cebral JR. Computational Fluid Dynamics of Stented Intracranial Aneurysms using Adaptive Embedded Unstructured Grids. International Journal for Numerical Methods in Fluids. 2008;57:457–493. [Google Scholar]
- 40.Kundu PK, Cohen IM. Fluid mechanics. Elsevier; 2004. [Google Scholar]
- 41.Sherman TF. On connecting large vessels to small. The meaning of Murray's law. J Gen Physiol. 1981;78:431–453. doi: 10.1085/jgp.78.4.431. [DOI] [PMC free article] [PubMed] [Google Scholar]
- 42.Radaelli A, Ausburger L, Cebral JR, Ohta M, Rufenacht DA, Balossino R, Benndorf G, Hose DR, Marzo A, Metcalfe RW, Mortier P, Mut F, Reymond P, Socci L, Verhegghe B, Frangi AF. Reproducibility of haemodynamical simulations in a subject-specific stented aneurysm model--a report on the Virtual Intracranial Stenting Challenge 2007. J Biomech. 2008;41(10):2069–2081. doi: 10.1016/j.jbiomech.2008.04.035. [DOI] [PubMed] [Google Scholar]
- 43.Appanaboyina S, Mut F, Löhner R, Scrivano E, Miranda C, Lylyk P, Putman CM, Cebral JR. Computational modeling of blood flow in side arterial branches after stenting of intracranial aneurysms. Int J CFD. 2008;22(10):669–676. [Google Scholar]


