

Abstract
Defining cases and controls on the basis of biomarkers rather than clinical diagnosis may reduce sample sizes required for genetic studies. The aim of this study was to assess whether characterising case/control status on the basis of CSF profile would increase power to replicate known genetic associations for Alzheimer's disease (AD). Independent of clinical diagnosis, Alzheimer's disease Neuroimaging Initiative (ADNI) subjects with two CSF biomarkers for AD (Aβ1-42 <192pg/ml and 181-phosphorylated tau (p-tau) >23pg/ml, “CSF-positive”) were compared with those without CSF evidence for AD (Aβ1-42 >192pg/ml and p-tau <23pg/ml, “CSF-negative”). Minor allele frequency and odds-ratios between these two groups were calculated for seven SNPs of interest. 232 individuals were CSF-positive and 94 CSF-negative. There were no differences in age (74.7 ± 7.2 vs. 75.0 ± 6.5 years, p=0.7), but significant differences in MMSE (25.9 ± 2.6 vs. 28.2 ± 1.7, p<0.001) between the CSF-positive and CSF-negative groups. Significant differences in MAF (p<0.05, uncorrected) were seen for CR1 [rs1408077, OR=1.59, 95%CI=1.01-2.49], PICALM [rs541458, OR=0.68, 95%CI=0.47-0.98], TOMM40 [rs2075650, OR=4.30, 95%CI=2.61-7.06]; and possession of one or more APOE ε4 alleles [OR=9.84, 95%CI=5.48-17.67]. These results suggest that using biomarkers of AD pathology to define case and control status may increase power in genetic association studies.
Keywords: Alzheimer's disease, Genome Wide Association Studies, Cerebrospinal fluid
1. Introduction
Until recently, possession of an APOE ε4 allele was the only reliably reproducible genetic risk factor for sporadic Alzheimer's disease (AD). Several large genome wide association studies (GWAS) and confirmatory studies have recently demonstrated other risk loci, most notably PICALM (Harold et al., 2009; Corneveaux et al., 2010; Jun et al., 2010), CR1 (Lambert et al., 2009; Corneveaux et al., 2010; Jun et al., 2010) and CLU (Harold et al., 2009; Lambert et al., 2009; Jun et al., 2010; Corneveaux et al., 2010). Others including BIN1 have also been demonstrated in some studies (Biffi et al., 2010; Seshadri et al., 2010). Whilst none of these genes exerts as great a risk as possessing an APOE ε4 allele, improved understanding of factors leading to the development of AD may provide insights into disease pathogenesis and allow for identification of novel therapeutic targets. Traditional GWAS require case/control comparisons requiring many hundreds of individuals. Such individuals are typically distinguished on clinical grounds, with at most a proportion having pathological confirmation of diagnosis (Corneveaux et al., 2010; Jun et al., 2010; Carrasquillo et al., 2010). Given that 30-40% of individuals living to the tenth decade may develop AD, it is likely that a significant proportion of “healthy” controls have a genetic tendency to develop AD that has not manifested clinically. Similarly, even in the most experienced hands, a clinical diagnosis of AD is associated with a significant misdiagnosis rate. Cerebrospinal fluid measures of Aβ1-42 and p-tau are emerging as important biomarkers for AD, and are beginning to be utilised as quantitative traits for GWAS (Han et al., 2010; Cruchaga et al., 2010; Kim et al., 2011). The aim of this study was to test the hypothesis that basing case/control distinctions on CSF findings rather than clinical diagnosis would improve the power to confirm existing GWAS findings.
2. Methods
2.1 Subjects
All subjects were drawn from the Alzheimer's disease Neuroimaging Initiative (ADNI), a multi-centre public/private funded longitudinal study investigating adult subjects with AD, amnestic MCI, and normal cognition. Participants undergo baseline and periodic clinical and neuropsychometric assessments and serial MRI. ∼60% have CSF, and a subset PET imaging. Details are available at http://www.adni-info.org, with data downloadable from www.loni.ucla.edu/ADNI/). Written informed consent was obtained, as approved by the Institutional Review Board at each of the participating centres.
2.1 Cerebrospinal fluid (CSF)
Details of the CSF analysis and quality control measures have previously been published (Shaw et al., 2009). In brief, for all individuals with CSF available for analysis, measures of total tau, tau phosphorylated at threonine 181 (p-tau) and Aβ1-42 were performed centrally using the multiplex xMAP Luminex platform (Luminex Corp, Austin, TX) with Innogenetics (INNO-BIA AlzBio3; Ghent, Belgium;) immunoassay kit–based reagents.
2.2 Genetics
Details of the genotyping methods have previously been described (Saykin et al., 2010). Individual-level genotype data including APOE genotype were downloaded from the LONI ADNI database. Based on the results of prior GWAS analyses, data for seven SNPs of interest were extracted: rs3818361 and rs1408077 (CR1); rs11136000 (CLU); rs744373 (BIN1); rs3851179 and rs541458 (PICALM); and rs2075650 (TOMM40)
2.3 Statistical approach and patient selection
A previous CSF study from a group of patients with autopsy confirmed AD analysed using identical methodology to that employed in ADNI showed that a CSF Aβ1-42 cut-off of 192pg/ml had 96% sensitivity and 77% specificity for distinguishing AD from controls; and that a CSF p-tau cut-off of 23pg/ml had 68% sensitivity and 73% specificity (Shaw et al., 2009). This entire cohort irrespective of diagnosis at baseline was separated into three groups: (1) those with both low CSF Aβ1-42 (<192pg/ml) and high p-tau (>23pg/ml) – “CSF positive”; (2) those with both high CSF Aβ1-42 (>192pg/ml) and low p-tau (<23pg/ml) – “CSF negative”; (3) and those not fulfilling criteria for either “CSF positive” or “CSF negative”.
To enrich the study into those cases, only the groups most likely to have AD pathology (CSF positive) and those least likely to have AD pathology (CSF negative) were included in the genetic analysis, with the remainder being excluded. For each of these two groups minor allele frequency for each SNP was established and odds ratios comparing the CSF positive and CSF negative groups were calculated. All analyses were performed in Stata 10.
3. Results
A total of 412 subjects with CSF results were available for analysis. Of these, 114 were classified clinically as controls, 196 as MCI, and 102 as AD. On the basis of the pre-defined CSF cut-offs, 232 individuals were classified as CSF-positive, 94 as CSF-negative, with the remaining 86 being excluded from the analysis (Figure 1). 84/102 (82.4%) of the total AD group, 125/196 (63.8%) of the total MCI group and 23/114 (20.2%) of the control group were classified as CSF-positive; 4/102 (3.9%) of the total AD group, 38/196 (19.4%) of the total MCI group and 52/114 (45.6%) of the total control group were classified as CSF-negative.
Figure 1.
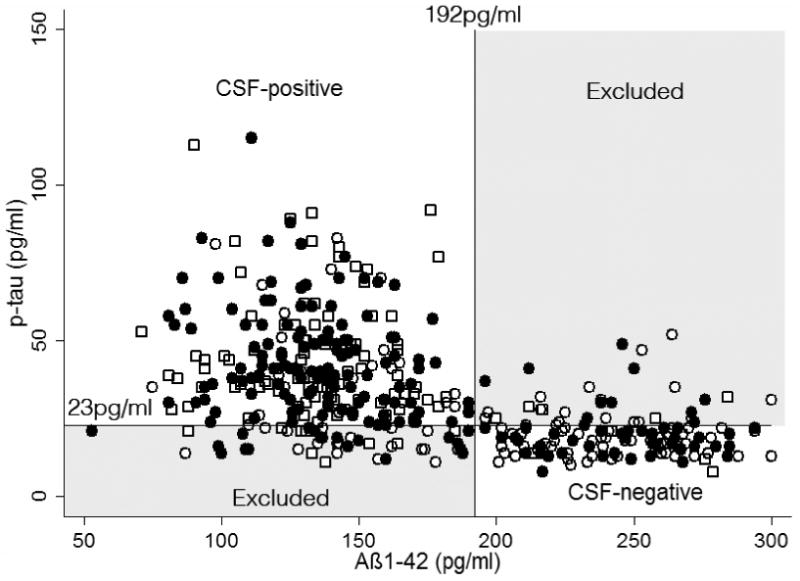
Baseline CSF Aß1-42 is plotted against baseline CSF p-tau. AD cut-offs for Aß1-42 (192pg/ml) and p-tau (23pg/ml) are shown. Individuals classified clinically as AD are shown as open squares; MCI as filled circles; and controls as open circles. CSF positive individuals are those in the upper left quadrant; CSF negative individuals in the lower right quadrant; and the remainder – excluded from the analysis – in the shaded upper right and lower left quadrants.
Demographic details of the groups classified as CSF-positive or CSF-negative and those excluded from the analysis are shown in Supplementary Table (1). The CSF-positive group comprised 9.9% classified clinically as controls, 53.9% as MCI, and 36.2% as AD. The CSF-negative group comprised 55.3% classified clinically as controls, 40.4% as MCI, and 4.3% as AD. Comparing the CSF-positive and CSF-negative groups there were no significant differences in age (74.7 ± 7.2 vs. 75.0 ± 6.3 years, p=0.7), but there were significant differences in MMSE (25.9 ± 2.6 vs. 28.2 ± 1.7, p<0.001).
Minor allele frequencies and odds-ratios for each SNP comparing the CSF-positive and CSF-negative groups are shown in Table 1, alongside previously reported odds-ratios from case/control studies.
Table 1.
Associations of SNP minor alleles and APOE4 are shown, comparing CSF-positive and CSF-negative groups. Previously reported case/control meta-analysis results are shown for comparison.
| SNP | Gene | p= | OR (95% CI) | CSF-positive | CSF-negative | Alzgene (Bertram et al., 2007) OR (95% CI) | Jun et al. (Jun et al., 2010)* OR (95% CI) | ||
|---|---|---|---|---|---|---|---|---|---|
| n= | % with minor allele | n= | % with minor allele | ||||||
| rs3818361 | CR1 | 0.12 | 1.41 (0.91 – 2.17) | 232 | 23.1 | 94 | 17.6 | 1.14 (1.08 – 1.20) | 1.14 (1.07 – 1.22) |
| rs1408077 | CR1 | 0.04 | 1.59 (1.01 – 2.49) | 225 | 22.4 | 94 | 15.4 | 1.13 (1.06 – 1.20) | 1.14 (1.07 – 1.22) |
| Rs11136000 | CLU | 0.87 | 0.97 (0.69 – 1.37) | 232 | 39.2 | 94 | 39.9 | 0.88 (0.86 – 0.91) | 0.91 (0.85 – 0.96) |
| rs744373 | BIN1 | 0.36 | 0.87 (0.60 – 1.26) | 229 | 28.6 | 92 | 31.5 | 1.15 (1.1 – 1.2) | - |
| rs3851179 | PICALM | 0.29 | 0.82 (0.58 – 1.18) | 232 | 30.8 | 94 | 35.1 | 0.88 (0.85 – 0.91) | 0.89 (0.84 – 0.94) |
| rs541458 | PICALM | 0.04 | 0.68 (0.47 – 0.98) | 232 | 26.1 | 94 | 34.4 | 0.88 (0.85 – 0.91) | 0.88 (0.83 – 0.93) |
| rs2075650 | TOMM40 | <0.001 | 4.30 (2.61 – 7.06) | 232 | 33.8 | 94 | 10.6 | 2.79 (2.38 – 3.27) | - |
| - | APOE E4 vs no E4 | <0.001 | 9.84 (5.48 – 17.67) | 232 | 42.2 | 94 | 6.9 | - | - |
| - | APOE E4 vs E3 | <0.001 | 8.32 (4.61 – 15.01) | 220 | 43.4 | 77 | 8.4 | 3.68 (3.30 – 4.11) | - |
unadjusted meta-analysis of 5935 cases and 7034 controls (includes 286 cases and 195 controls from ADNI)
Significant differences in minor allele frequency at the p<0.05 level (uncorrected) were seen for CR1 (rs1408077), PICALM (rs541458), TOMM40 (rs2075650), and APOE E4. Alternative SNPs for CR1 (rs3818361) and PICALM (rs3851179) showed directionally similar effects but failed to reach significance. For all SNPs tested bar rs744373, the direction of association was the same as has previously been reported in other GWAS studies.
4. Discussion
This study, assigning case or controls status on the basis of CSF biomarkers, provides further confirmatory evidence that CR1, PICALM, TOMM40, and APOE E4 are risk factors for the development of AD pathology. This was possible using just over 300 subjects, an order of magnitude fewer than used in traditional GWAS studies. These findings suggest that confirmatory or exploratory genetic analyses based on biomarker evidence of AD pathology may have increased power to detect case/control differences, and may therefore be possible using smaller sample sizes.
Whilst due to the small sample size confidence intervals were large, the minor alleles of CR1, PICALM, TOMM40 and APOE E4 were associated with greater odds ratios than have previously been suggested in many other GWAS, significantly so in the case of APOE E4. Thus odds ratios were for CR1 (rs1408077) 1.59, PICALM (rs541458) 0.68, TOMM40 (rs2075650) 4.29 and APOE E4 vs. E3 8.32, with meta-analyses of previous studies reporting odds ratios of 1.13, 0.88, 2.79 and 3.68 respectively (Bertram et al., 2007). A previous confirmatory GWAS study using 740 of the ADNI cohort and employing a logistic regression model across clinical diagnosis groups reported significant, but smaller effects of APOE E4 [OR=2.07] and CR1 (rs1408077) [OR=1.27], and no effect of PICALM (Biffi et al., 2010). These differences are likely to reflect the difficulties of relying on clinical diagnosis: in keeping with previous reports (De Meyer et al., 2010; Shaw et al., 2009) of all the controls available for analysis, ∼20% would have been classified as CSF-positive; and ∼19% of the MCI group and ∼4% of the AD group as CSF-negative. Basing the analysis on patients with a CSF AD profile and those without, independent of clinical diagnosis, might explain the larger odds ratios; and whilst considerable caution is required given the small numbers in the study and the wide confidence intervals, this suggests that these haplotypes may confer larger risk of developing AD pathology than has previously been described.
Compared to results from formal GWAS, there was a directionally similar but non-significant association for CLU. This is likely to an issue of insufficient power. Based on case/control minor allele frequencies from the Alzgene meta-analysis, 232 cases and 94 controls would have 99% and 85% power (5% level) to detect differences in APOE ε4 and TOMM40 respectively, but only 5-7% power for CLU, CR1, BIN1 or PICALM. Based on these estimates, the chance of detecting significance for CR1 and PICALM in this sample is <1/400, providing further support for the hypothesis that better group separation may be achievable by basing diagnosis on disease biomarkers than clinical diagnosis.
There are a number of important caveats that need to be considered in relation to this study. Assigning case/control status neither on the basis of cognition nor on evidence of neurodegeneration means that the genetic risks identified can only truly be associated with the development of CSF signatures of AD and not of AD itself. Nonetheless, these findings which accord closely with previous literature, suggest that employing endo-phenotypic traits may be a useful means of providing confirmatory and exploratory GWAS studies in neurodegenerative diseases. The use of any CSF cut-off is inevitably associated with a degree of inaccuracy, and standardisation of CSF measurement is important if similar, pre-defined cut-offs are to be used in other studies. This study is not a formal GWAS, but was designed as to replicate known genetic risk factors as a proof-of-concept for the use of an enrichment strategy. As such, and to allow comparisons with other such studies and the Alzgene meta-analytic data, uncorrected p-values are presented. Applying a strict Bonferonni correction results in an adjusted statistical significance level of p=0.00625, at which level only the TOMM40 and APOE genes remain significant. This is likely to reflect the much higher risk factor conferred by these two genes. Determination of genes with relatively small influences may however also aid in our understanding of the pathogenesis of neurodegenerative diseases, and whilst use of endophenotypes to enrich case/control studies may increase power to determine genetic associations, this does not negate the fact that large sample sizes will be required to determine small effects.
There is increasing realisation that a substantial proportion of apparently normal older individuals may be in the prodromal stage of AD (Schott et al., 2010). Presuming these individuals are also likely to harbour risk variants, GWAS studies assuming that do not take this into account risk missing potential genetic associations, or underestimating the effects of identified genes. Using biomarkers to define cases and controls, or as quantitative traits, may increase the power of studies to detect genetic influences: indeed during the revision of this paper, a formal GWAS study based on the CSF data from the ADNI cohort was published (Kim et al., 2011). The findings reported here require replication in larger cohorts of patients with CSF; and in subjects stratified on the basis of other biomarkers including amyloid PET imaging.
Supplementary Material
Acknowledgments
The author is grateful for assistance with data processing and image analysis from Dr Ian Malone, and Dr Matt Clarkson; and for helpful discussions with Dr Josephine Barnes and Professor Nick Fox. JMS is a HEFCE Clinical Senior Lecturer. This work was undertaken at UCLH/UCL who received a proportion of funding from the Department of Health's NIHR Biomedical Research Centres funding scheme The Dementia Research Centre is an Alzheimer's Research Trust Co-ordinating Centre and has also received equipment funded by the Alzheimer's Research Trust. Data collection and sharing for this project was funded by the Alzheimer's Disease Neuroimaging Initiative (ADNI) (National Institutes of Health Grant U01 AG024904). ADNI is funded by the National Institute on Aging, the National Institute of Biomedical Imaging and Bioengineering, and through generous contributions from the following: Abbott, AstraZeneca AB, Bayer Schering Pharma AG, Bristol-Myers Squibb, Eisai Global Clinical Development, Elan Corporation, Genentech, GE Healthcare, GlaxoSmithKline, Innogenetics, Johnson and Johnson, Eli Lilly and Co., Medpace, Inc., Merck and Co., Inc., Novartis AG, Pfizer Inc, F. Hoffman-La Roche, Schering-Plough, Synarc, Inc., as well as non-profit partners the Alzheimer's Association and Alzheimer's Drug Discovery Foundation, with participation from the U.S. Food and Drug Administration. Private sector contributions to ADNI are facilitated by the Foundation for the National Institutes of Health (http://www.fnih.org). The grantee organization is the Northern California Institute for Research and Education, and the study is coordinated by the Alzheimer's Disease Cooperative Study at the University of California, San Diego. ADNI data are disseminated by the Laboratory for Neuro Imaging at the University of California, Los Angeles. This research was also supported by NIH grants P30 AG010129, K01 AG030514, and the Dana Foundation
Footnotes
Data used in the preparation of this article were obtained from the Alzheimer's Disease Neuroimaging Initiative (ADNI) database (www.loni.ucla.edu\ADNI). As such, the investigators within the ADNI contributed to the design and implementation of ADNI and/or provided data but did not participate in analysis or writing of this report. A full list of ADNI investigators is available at: http://www.loni.ucla.edu/ADNI/Collaboration/ADNI_Manuscript_Citations.pdf
Disclosure: The author reports no conflicts of interest.
Publisher's Disclaimer: This is a PDF file of an unedited manuscript that has been accepted for publication. As a service to our customers we are providing this early version of the manuscript. The manuscript will undergo copyediting, typesetting, and review of the resulting proof before it is published in its final citable form. Please note that during the production process errors may be discovered which could affect the content, and all legal disclaimers that apply to the journal pertain.
References
- Bertram L, McQueen MB, Mullin K, Blacker D, Tanzi RE. Systematic meta-analyses of Alzheimer disease genetic association studies: the AlzGene database. Nat Genet. 2007;39(1):17–23. doi: 10.1038/ng1934. [DOI] [PubMed] [Google Scholar]
- Biffi A, Anderson CD, Desikan RS, Sabuncu M, Cortellini L, Schmansky N, Salat D, Rosand J. Genetic variation and neuroimaging measures in Alzheimer disease. Arch Neurol. 2010;67(6):677–85. doi: 10.1001/archneurol.2010.108. [DOI] [PMC free article] [PubMed] [Google Scholar]
- Carrasquillo MM, Belbin O, Hunter TA, Ma L, Bisceglio GD, Zou F, Crook JE, Pankratz VS, Dickson DW, Graff-Radford NR, Petersen RC, Morgan K, Younkin SG. Replication of CLU, CR1, and PICALM associations with alzheimer disease. Arch Neurol. 2010;67(8):961–4. doi: 10.1001/archneurol.2010.147. [DOI] [PMC free article] [PubMed] [Google Scholar]
- Corneveaux JJ, Myers AJ, Allen AN, Pruzin JJ, Ramirez M, Engel A, Nalls MA, Chen K, Lee W, Chewning K, Villa SE, Meechoovet HB, Gerber JD, Frost D, Benson HL, O'Reilly S, Chibnik LB, Shulman JM, Singleton AB, Craig DW, Keuren-Jensen KR, Dunckley T, Bennett DA, De Jager PL, Heward C, Hardy J, Reiman EM, Huentelman MJ. Association of CR1, CLU and PICALM with Alzheimer's disease in a cohort of clinically characterized and neuropathologically verified individuals. Hum Mol Genet. 2010;19(16):3295–301. doi: 10.1093/hmg/ddq221. [DOI] [PMC free article] [PubMed] [Google Scholar]
- Cruchaga C, Kauwe JS, Mayo K, Spiegel N, Bertelsen S, Nowotny P, Shah AR, Abraham R, Hollingworth P, Harold D, Owen MM, Williams J, Lovestone S, Peskind ER, Li G, Leverenz JB, Galasko D, Morris JC, Fagan AM, Holtzman DM, Goate AM. SNPs associated with cerebrospinal fluid phospho-tau levels influence rate of decline in Alzheimer's disease. PLoS Genet. 2010;6(9) doi: 10.1371/journal.pgen.1001101. [DOI] [PMC free article] [PubMed] [Google Scholar]
- De Meyer G, Shapiro F, Vanderstichele H, Vanmechelen E, Engelborghs S, De Deyn PP, Coart E, Hansson O, Minthon L, Zetterberg H, Blennow K, Shaw L, Trojanowski JQ. Diagnosis-independent Alzheimer disease biomarker signature in cognitively normal elderly people. Arch Neurol. 2010;67(8):949–56. doi: 10.1001/archneurol.2010.179. [DOI] [PMC free article] [PubMed] [Google Scholar]
- Han MR, Schellenberg GD, Wang LS. Genome-wide association reveals genetic effects on human Abeta42 and tau protein levels in cerebrospinal fluids: a case control study. BMC Neurol. 2010;10:90. doi: 10.1186/1471-2377-10-90. [DOI] [PMC free article] [PubMed] [Google Scholar]
- Harold D, Abraham R, Hollingworth P, Sims R, Gerrish A, Hamshere ML, Pahwa JS, Moskvina V, Dowzell K, Williams A, Jones N, Thomas C, Stretton A, Morgan AR, Lovestone S, Powell J, Proitsi P, Lupton MK, Brayne C, Rubinsztein DC, Gill M, Lawlor B, Lynch A, Morgan K, Brown KS, Passmore PA, Craig D, McGuinness B, Todd S, Holmes C, Mann D, Smith AD, Love S, Kehoe PG, Hardy J, Mead S, Fox N, Rossor M, Collinge J, Maier W, Jessen F, Schurmann B, van den BH, Heuser I, Kornhuber J, Wiltfang J, Dichgans M, Frolich L, Hampel H, Hull M, Rujescu D, Goate AM, Kauwe JS, Cruchaga C, Nowotny P, Morris JC, Mayo K, Sleegers K, Bettens K, Engelborghs S, De Deyn PP, Van Broeckhoven C, Livingston G, Bass NJ, Gurling H, McQuillin A, Gwilliam R, Deloukas P, Al Chalabi A, Shaw CE, Tsolaki M, Singleton AB, Guerreiro R, Muhleisen TW, Nothen MM, Moebus S, Jockel KH, Klopp N, Wichmann HE, Carrasquillo MM, Pankratz VS, Younkin SG, Holmans PA, O'Donovan M, Owen MJ, Williams J. Genome-wide association study identifies variants at CLU and PICALM associated with Alzheimer's disease. Nat Genet. 2009;41(10):1088–93. doi: 10.1038/ng.440. [DOI] [PMC free article] [PubMed] [Google Scholar]
- Jun G, Naj AC, Beecham GW, Wang LS, Buros J, Gallins PJ, Buxbaum JD, Ertekin-Taner N, Fallin MD, Friedland R, Inzelberg R, Kramer P, Rogaeva E, George-Hyslop P, Arnold SE, Baldwin CT, Barber R, Beach T, Bigio EH, Bird TD, Boxer A, Burke JR, Cairns N, Carroll SL, Chui HC, Clark DG, Cotman CW, Cummings JL, Decarli C, Diaz-Arrastia R, Dick M, Dickson DW, Ellis WG, Fallon KB, Farlow MR, Ferris S, Frosch MP, Galasko DR, Gearing M, Geschwind DH, Ghetti B, Gilman S, Giordani B, Glass J, Graff-Radford NR, Green RC, Growdon JH, Hamilton RL, Harrell LE, Head E, Honig LS, Hulette CM, Hyman BT, Jicha GA, Jin LW, Johnson N, Karlawish J, Karydas A, Kaye JA, Kim R, Koo EH, Kowall NW, Lah JJ, Levey AI, Lieberman A, Lopez OL, Mack WJ, Markesbery W, Marson DC, Martiniuk F, Masliah E, McKee AC, Mesulam M, Miller JW, Miller BL, Miller CA, Parisi JE, Perl DP, Peskind E, Petersen RC, Poon W, Quinn JF, Raskind M, Reisberg B, Ringman JM, Roberson ED, Rosenberg RN, Sano M, Schneider JA, Schneider LS, Seeley W, Shelanski ML, Smith CD, Spina S, Stern RA, Tanzi RE, Trojanowski JQ, Troncoso JC, Van Deerlin VM, Vinters HV, Vonsattel JP, Weintraub S, Welsh-Bohmer KA, Woltjer RL, Younkin SG, Cantwell LB, Dombroski BA, Saykin AJ, Reiman EM, Bennett DA, Morris JC, Lunetta KL, Martin ER, Montine TJ, Goate AM, Blacker D, Tsuang DW, Beekly D, Cupples LA, Hakonarson H, Kukull W, Foroud TM, Haines J, Mayeux R, Farrer LA, Pericak-Vance MA, Schellenberg GD, Arnold SE, Baldwin CT, Barber R, Beach T, Bigio EH, Bird TD, Boxer A, Burke JR, Cairns N, Carroll SL, Chui HC, Clark DG, Cotman CW, Cummings JL, Decarli C, Diaz-Arrastia R, Dick M, Dickson DW, Ellis WG, Fallon KB, Farlow MR, Ferris S, Frosch MP, Galasko DR, Gearing M, Geschwind DH, Ghetti B, Gilman S, Giordani B, Glass J, Graff-Radford NR, Green RC, Growdon JH, Hamilton RL, Harrell LE, Head E, Honig LS, Hulette CM, Hyman BT, Jicha GA, Jin LW, Johnson N, Karlawish J, Karydas A, Kaye JA, Kim R, Koo EH, Kowall NW, Lah JJ, Levey AI, Lieberman A, Lopez OL, Mack WJ, Markesbery W, Marson DC, Martiniuk F, Masliah E, McKee AC, Mesulam M, Miller JW, Miller BL, Miller CA, Parisi JE, Perl DP, Peskind E, Petersen RC, Poon W, Quinn JF, Raskind M, Reisberg B, Ringman JM, Roberson ED, Rosenberg RN, Sano M, Schneider JA, Schneider LS, Seeley W, Shelanski ML, Smith CD, Spina S, Stern RA, Tanzi RE, Trojanowski JQ, Troncoso JC, Van Deerlin VM, Vinters HV, Vonsattel JP, Weintraub S, Welsh-Bohmer KA, Woltjer RL, Younkin SG. Meta-analysis Confirms CR1, CLU, and PICALM as Alzheimer Disease Risk Loci and Reveals Interactions With APOE Genotypes. Arch Neurol. 2010;67(12):1473–84. doi: 10.1001/archneurol.2010.201. [DOI] [PMC free article] [PubMed] [Google Scholar]
- Kim S, Swaminathan S, Shen L, Risacher SL, Nho K, Foroud T, Shaw LM, Trojanowski JQ, Potkin SG, Huentelman MJ, Craig DW, Dechairo BM, Aisen PS, Petersen RC, Weiner MW, Saykin AJ. Genome-wide association study of CSF biomarkers A{beta}1-42, t-tau, and p-tau181p in the ADNI cohort. Neurology. 2011;76(1):69–79. doi: 10.1212/WNL.0b013e318204a397. [DOI] [PMC free article] [PubMed] [Google Scholar]
- Lambert JC, Heath S, Even G, Campion D, Sleegers K, Hiltunen M, Combarros O, Zelenika D, Bullido MJ, Tavernier B, Letenneur L, Bettens K, Berr C, Pasquier F, Fievet N, Barberger-Gateau P, Engelborghs S, De Deyn P, Mateo I, Franck A, Helisalmi S, Porcellini E, Hanon O, de Pancorbo MM, Lendon C, Dufouil C, Jaillard C, Leveillard T, Alvarez V, Bosco P, Mancuso M, Panza F, Nacmias B, Bossu P, Piccardi P, Annoni G, Seripa D, Galimberti D, Hannequin D, Licastro F, Soininen H, Ritchie K, Blanche H, Dartigues JF, Tzourio C, Gut I, Van Broeckhoven C, Alperovitch A, Lathrop M, Amouyel P. Genome-wide association study identifies variants at CLU and CR1 associated with Alzheimer's disease. Nat Genet. 2009;41(10):1094–9. doi: 10.1038/ng.439. [DOI] [PubMed] [Google Scholar]
- Saykin AJ, Shen L, Foroud TM, Potkin SG, Swaminathan S, Kim S, Risacher SL, Nho K, Huentelman MJ, Craig DW, Thompson PM, Stein JL, Moore JH, Farrer LA, Green RC, Bertram L, Jack CR, Jr, Weiner MW. Alzheimer's Disease Neuroimaging Initiative biomarkers as quantitative phenotypes: Genetics core aims, progress, and plans. Alzheimers Dement. 2010;6(3):265–73. doi: 10.1016/j.jalz.2010.03.013. [DOI] [PMC free article] [PubMed] [Google Scholar]
- Schott JM, Bartlett JW, Fox NC, Barnes J. Increased brain atrophy rates in cognitively normal older adults with low cerebrospinal fluid Abeta1-42. Ann Neurol. 2010:825–34. doi: 10.1002/ana.22315. [DOI] [PubMed] [Google Scholar]
- Seshadri S, Fitzpatrick AL, Ikram MA, DeStefano AL, Gudnason V, Boada M, Bis JC, Smith AV, Carassquillo MM, Lambert JC, Harold D, Schrijvers EM, Ramirez-Lorca R, Debette S, Longstreth WT, Jr, Janssens AC, Pankratz VS, Dartigues JF, Hollingworth P, Aspelund T, Hernandez I, Beiser A, Kuller LH, Koudstaal PJ, Dickson DW, Tzourio C, Abraham R, Antunez C, Du Y, Rotter JI, Aulchenko YS, Harris TB, Petersen RC, Berr C, Owen MJ, Lopez-Arrieta J, Varadarajan BN, Becker JT, Rivadeneira F, Nalls MA, Graff-Radford NR, Campion D, Auerbach S, Rice K, Hofman A, Jonsson PV, Schmidt H, Lathrop M, Mosley TH, Au R, Psaty BM, Uitterlinden AG, Farrer LA, Lumley T, Ruiz A, Williams J, Amouyel P, Younkin SG, Wolf PA, Launer LJ, Lopez OL, van Duijn CM, Breteler MM. Genome-wide analysis of genetic loci associated with Alzheimer disease. JAMA. 2010;303(18):1832–40. doi: 10.1001/jama.2010.574. [DOI] [PMC free article] [PubMed] [Google Scholar]
- Shaw LM, Vanderstichele H, Knapik-Czajka M, Clark CM, Aisen PS, Petersen RC, Blennow K, Soares H, Simon A, Lewczuk P, Dean R, Siemers E, Potter W, Lee VM, Trojanowski JQ. Cerebrospinal fluid biomarker signature in Alzheimer's disease neuroimaging initiative subjects. Ann Neurol. 2009;65(4):403–13. doi: 10.1002/ana.21610. [DOI] [PMC free article] [PubMed] [Google Scholar]
Associated Data
This section collects any data citations, data availability statements, or supplementary materials included in this article.