

Abstract
This paper provides a literature review of the use of magnetic resonance imaging in monitoring the treatment response of soft tissue sarcomas (STS). The basic classification and physiology of the soft tissue tumor is introduced. Then, the major treatment options for STS are summarized with brief coverage of possible responses and grading systems. Four major branches of MR imaging techniques are covered, including conventional T1- and T2-weighted imaging, contrast-enhanced MR imaging, MR diffusion and perfusion imaging, and MR spectroscopy, with a focus on the tumor microenvironment. Although this literature survey focuses on recent clinical developments using these MR techniques, research venues in pre-clinical studies, as well as in potential applications other than soft tissue sarcomas, are also included when comparable and/or mutually supporting. Examples from other less-discussed MR imaging modalities are also briefly covered, not only to complement but also to expand the scope and depth of information for various kinds of lesions.
Keywords: musculoskeletal, magnetic resonance imaging (MRI), treatment, soft tissue, tumor, response, sarcoma, therapy
Introduction
Soft tissue sarcomas (STS) are a heterogeneous group of disorders that pose significant diagnostic and therapeutic challenges for clinical care and medical research. The assessment of treatment response in STS following chemotherapy or radiation is one of the most important aspects of patient care, as therapeutic options and the timing of surgery may vary depending on the success of response. As a non-invasive technology with no ionizing radiation, magnetic resonance (MR) imaging offers unique contributions in determining and monitoring therapeutic response in STS. From an anatomic imaging perspective, MR offers higher contrast resolution compared to CT and ultrasound. From the perspective of imaging the tumor microenvironment, MR can provide an assessment of the tumor vasculature, and the potential to provide detailed information about the biochemical environment, tissue composition, and structure. Imaging of STS following therapy must take into account not only post-treatment changes in the tumors themselves, but also any changes in staging and characterization. This review will examine the recent developments in MR imaging, providing an understanding of the imaging techniques as they relate to the complex, evolving biochemical environment that exists during the treatment of STS.
1. Soft tissue tumor classification and physiology
1.1 Classification of soft tissue tumors
Although quite heterogeneous, soft tissue tumors can generally be grouped into nine categories according to their morphological features and cytogenetics, and include benign as well as malignant entities within each category: adipocytic; fibroblastic/myofibroblastic; fibrohistiocytic; smooth muscle; skeletal muscle; pericytic (perivascular); vascular; chondro-osseous; and those of uncertain differentiation [1]. Benign soft tissue tumors may be left untreated or managed with follow-up or surgery, depending on the nature of the lesion and its natural history. For malignant soft tissue tumors (STS), management includes surgery, along with the potential for chemotherapy or radiation, to be administered in the adjuvant or neoadjuvant setting. Central to deciding the optimal treatment in STS is accurate tumor grading. The National Cancer Institute and the French tumor grading system are three-grade systems based on histological type and subtype, tumor necrosis, and mitotic activity [2, 3]. The principle of this system is summarized in Table 1[2]. The classification offered in Table 1 is modified from the work of Guillou et al., after comparing the grading systems of the National Cancer Institute and the French Federation of Cancer Center Sarcoma Group[4]. Generally, the higher the grade of the tumor, the less resemblance it has to normal tissue, with higher mitotic activity and more necrosis. This grading system correlates with prognosis, as it has been reported to be a predictor of local tumor recurrence [5, 6].
Table 1.
FNCLCC grading system: definition of parameters
| Tumor differentiation | |
| Score 1 | Sarcomas closely resembling normal adult mesenchymal tissue (e.g., well-differentiated liposarcoma) |
| Score 2 | Sarcomas for which histologic typing is certain (e.g., myxoid liposarcoma) |
| Score 3 | Embryonal and undifferentiated sarcomas, sarcomas of doubtful type, synovial sarcomas, osteosarcomas, PNET |
| Mitotic count | |
| Score 1: | 0-9 mitoses per 10 HPF+ |
| Score 2: | 10-19 mitoses per 10 HPF |
| Score 3: | ≥20 mitoses per 10 HPF |
| Tumor necrosis | |
| Score 0: | No necrosis |
| Score 1: | <50% tumor necrosis |
| Score 2: | ≥50% tumor necrosis |
| Histologic grade | |
| Grade 1: | Total score 2, 3 |
| Grade 2: | Total score 4, 5 |
| Grade 3: | Total score 6, 7, 8 |
A high-power field (HPF) measures 0.1734 mm2.
The diagnosis of an STS is established with imaging (to characterize extent and enable accurate staging) and percutaneous image-guided biopsy (to establish the histologic type and grade) [7]. Characterizing the grade of an STS is paramount to the treatment plan, as high-grade STS are generally treated with neoadjuvant therapy, and low-grade STS are generally not. While the percutaneous biopsy of an STS is considered the standard of care, an initial work-up with biopsy can occasionally miss the high-grade components of an STS, and only after surgery is the true histological grade discovered, creating a missed opportunity for neoadjuvant chemotherapy or radiation[8].
1.2 Physiology of soft tissue sarcomas
While more common in pediatric population, soft tissue sarcomas in adults are rare[9]. The biology of adult and pediatric sarcomas is not identical, as one of the more common sarcoma types in the pediatric population is rhabdomyosarcoma, whereas the most common type of sarcoma in adults is a malignant fibrous histiocytoma/fibrosarcoma. STS, nevertheless, share some common microenvironmental features with benign tumors, growing centrifugally in the soft tissues. Typically, when a benign tumor begins to differentiate from the host, a reactive fibrovascular tissue-limiting capsule forms around it. Aggressive lesions, on the other hand, form tumoral foci (called satellite lesions) inside this reactive pseudocapsule. In fact, these foci can exist at locations far beyond the reactive zone in highly aggressive lesions [10].
During the growth of malignant tumor, certain histological characteristics appear. Aggressive tumor tissue is highly cellular and the intact cell membrane will restrict the diffusion of water molecules, a feature that can be exploited with diffusion-weighted imaging (described below).
Other important features of the microenvironment of STS are the metabolic abnormalities that accompany changes in acidity, oxygen levels, and various metabolites within a tumor. First, an elevation of glycolysis, called the Warburg effect, produces high levels of lactic acid [11, 12]. Studies using 31P magnetic resonance spectroscopy (MRS) have revealed a neutral or alkaline tumor intracellular environment where the extracellular space contained an acidic environment relative to normal tissue [13-15]. Combined with tissue water T2 relaxation, the intracellular pH measured by 31P MRS was also thought to be predictive of therapeutic response with a 90% sensitivity and an 80% specificity [16].
Second, hypoxia is believed to be the result of poor blood perfusion and its importance is that it makes tumor cells more resistant to radiotherapy. Utilizing preoperative radiation and hyperthermia for high grade STS, earlier studies showed that patients with hypoxic tumors were found to have clearly lower disease-free survival rates than those with well-oxygenated tumor environments [17]. The latter findings echo the notion that hypoxic tumor cells are three to five times more resistant to radiation therapy[18]. Thus, tumor oxygenation is considered a strong prognostic indicator in therapeutic planning. Generally, tumor hypoxia and acidosis are accompanied by poor perfusion and elevated metabolism.
Third, certain metabolites can serve as biomarkers of malignancy in the musculoskeletal system. A well-known biomarker is total choline or tCho. Biologically, choline is involved in cell membrane phospholipid metabolism, including phosphatidylcholine (PtdCho) biosynthesis and oxidation into betaine in the mitochondria. The PtdCho is very important in cell membrane viability and the cell life cycle. Early studies showed that the metabolism of phospholipids is altered with major tumor malignancy growth factors [19, 20]. Total choline is the sum of phosphocholine (PCho), glycerophosphocholine (GPC), and choline (Cho), and can be measured with clinical MR spectroscopy [21-25]. When membrane choline phospholipid metabolism was studied during the transformation from normal to malignant phenotypes, total choline was shown to be a biomarker of malignant disease in the preclinical and clinical studies from other body locations [26-31].
2. Treatment options and imaging needs in STS therapy response
2.1 Summary of STS therapeutic options
The major treatment modalities for STS include surgery, radiation, chemotherapy, and immunotherapy. In general, surgery alone can be used for small, low-grade tumors. For larger tumors, local or global radiotherapy may be used, and may also reduce the incidence of recurrence. Chemotherapy can play a role in diminishing lesion size and preventing post-operative recurrences[9]. The most often used chemotherapy agents are doxorubicin and ifosfamide, with gemcitabine gaining increasing usage [9]. In addition, methotrexate and Cis-diamminedichloroplatinum(II) have been used in some STS, although more commonly in osteosarcomas. Other prominent chemotherapy agents include mitomycin C for hypoxic solid tumors and paclitaxel for angiosarcoma[32]. Thermotherapy is also employed to treat STS. Cryotherapy is an emerging minimal invasive adjunctive therapy in certain cases, as an adjunct to surgical removal [33] and chemotherapy. Cryosurgery technique has evolved from the initial method of pouring of liquid nitrogen onto a tumor bed [34] to the more recent argon-based system. The latter allows controlled formation of an ice-ball surrounding a metallic probe inserted in to the tumor under CT or US guidance. The advantage of using image guidance is to evaluate the formation of the ice ball and the effect of surrounding tissue. On the other hand, heat is used to produce tissue necrosis and/or protein denaturation. Radiofrequency ablation (RFA) induces tissue necrosis in the target area via deployment of the RF probe into the tumor site and using the ionic interaction between the tissue and RF to create heat, which is monitoerd using CT and/or MR. The desired temperature is from 50-100° C for least 4 to 6 minutes, resulting in tumor destruction. In addition, a newer non-invasive method is being explored for thermotherapy is high intensity focused ultrasound to ablate tumors[35-39].
The primary purpose of imaging subsequent to chemotherapy or radiation in STS is to assess whether an STS has responded to treatment. If so, surgery will continue as planned; if treatment response is inadequate, chemotherapeutic regimens may be changed and this will affect the timing of surgery. The imaging assessment of an STS following neoadjuvant therapy typically includes macroscopic measurements, such as tumor volumetric information, signal characteristics, the degree of heterogeneity on various MR sequences, the degree of contrast enhancement, and the relationship of the tumor to surrounding vital structures. However, following neoadjuvant therapy prior to surgery, there are three general scenarios that are encountered: 1) due to non-response, the mass may remain stable or enlarge in size; 2) due to treatment-related necrosis, the mass may become smaller or stay the same size; or 3) due to hemorrhage, the mass may enlarge [21]. Hence, many macroscopic features of a tumor after treatment are not reliable predictors of whether neoadjuvant therapy has had an effect on the tumor. Even when macroscopic features abate, microscopic foci of malignancy can persist [40]. Thus, further quantitative metrics, including the assessment of perfusion, water diffusion, and metabolic changes with advanced MR techniques, have been advocated for the assessment of treatment response in a tumor. It is these metrics that may prove most useful in the future for determining treatment response.
2.2 Classification of STS therapy response
Originally, the Salzer-Kuntschik tumor response grading system was used to assess chemotherapy-induced morphological regression [41]. In this system, the chemotherapy response is graded from I (no viable tumor cells remaining) to VI (no effect of treatment identified) [42], utilizing the histological assessment of tumor necrosis. From as early as 2000, Response Evaluation Criteria for Solid Tumors (RECIST) became the most widely used tumor treatment assessment system for soft tissue tumors, and used morphologic size as the major quantitative metric [43, 44]. However, the RECIST criteria, although in common clinical use currently, have been recently challenged [45, 46]. The reason that the RECIST criteria are in question is that they do not incorporate tumor volumetric measurements, changes in density, metabolism, perfusion, or water diffusion, which are available with advanced technologies like PET and MR imaging. One improvement on the RECIST criteria was the Choi criteria which were recently introduced and incorporated density and intensity changes by CT and MR imaging, in addition to changes in size[47].
Finally, to address the inadequacies of the RECIST and Choi criteria, the use of a standardized uptake value (SUV) obtained by PET was incorporated into response criteria to better assess tumor metabolism [48]. Thus, the revised RECIST 1.1 criteria endorsed the functional assessment of tumors following treatment as complementary to anatomic evaluations [49]. Hence, advanced techniques providing functional information, with MR, CT and PET, have emerged for the assessment of treatment response such as PET Response Criteria in Solid Tumors (PERCIST)[50].
3. MR imaging techniques in the assessment of STS
MR imaging is an integral part of the multi-modality approach to the assessment of STS diagnosis and treatment. A comprehensive MR protocol will include a variety of non-contrast sequences (standard T1- and T2-weighted sequences, diffusion-weighted imaging, MR spectroscopy) and post-contrast sequences (to assess perfusion and vascular heterogeneity along with delayed enhancement). Using these MR imaging techniques, a morphological assessment of a tumor can be made, as well as an assessment of tissue perfusion, diffusion, and biochemical composition, which will provide information about tumor progression and treatment efficacy. This section will summarize conventional and advanced MR imaging techniques and their applications.
3.1 Conventional T1- and T2-weighted imaging
Tumor size and occasionally histologic classification are the most salient pieces of information provided by MR imaging. Compared with healthy muscle, fat, and bone marrow, pathologic tissues have altered T1 and T2 relaxation times [51-53]. Thus, a comparison of T1- and T2-weighted images (T1WI and T2WI) often provides the ability to not only identify the size and borders of the tumor, but also the potential to characterize lesion composition [54].
The most commonly used T1WI pulse sequences include the spin echo sequence and the gradient echo pulse. T2WI are generally used with fat suppression to identify fluid in the image, although short tau inversion recovery (STIR) is also used to null the lipid signal (Figure 1.A, 1.B, 1.C). In addition, fast spin echo, turbo spin echo, and rapid acquisition with relaxation enhancement (RARE) are sequences that can achieve a faster scan time.
Figure 1.

A. Pretreatment scan in a 14-year-old girl with Ewing’s sarcoma of the left thigh. Axial T1-weighted image (SE, TR/TE 545/11)of the left thigh shows a slightly heterogeneous intramuscular mass of intermediate signal intensity in the medial left thigh. B. Pretreatment scan in a 14-year-old girl with Ewing’s sarcoma of the left thigh. Axial fat-suppressed T2-weighted image (FSE, TR/TE 0950/05)of the left thigh shows a slightly heterogeneous intramuscular mass of intermediate to high signal. C. Pretreatment scan in a 14-year-old girl with Ewing’s sarcoma of the left thigh. Axial post-contrast fat-suppressed T1-weighted image (VIBE, TR/TE 502/4.92) of the left thigh shows marked solid enhancement of the mass. D. Post-treatment axial T1-weighted image (SE TR/TE 500/14)of the left thigh obtained following chemotherapy shows enlargement of the mass compared with pre-chemotherapy imaging, although size changes are not reliable measures of response. E. Axial fat-suppressed T2-weighted (FSE, TR/TE 3000/47) image of the left thigh obtained following chemotherapy shows enlargement of the mass and slightly heterogeneous increased signal. Signal changes on non-contrast T1- and T2-weighted images are not reliable measures of treatment response. F. Post-treatment, axial post-contrast T1-weighted image of the left thigh following chemotherapy shows persistent contrast enhancement in the mass. Following surgical resection, only 25% necrosis was found histologically, indicating a poor prognosis, and the patient died within two years. In this case, contrast enhancement persistence indicates poor treatment response, although static contrast-enhanced images are not reliable indicators of the degree of necrosis or response.
Both T1- and T2-weighted images offer valuable morphological information about tumor treatment effects [38]. As a typical example, decreased T1 signal intensity and increased T2 signal were shown to represent marrow edema due to thermal osteonecrosis, which occurred in a tumor following curettage and cryotherapy [55]. In addition to signal intensity changes caused by biological changes, the anatomic size of a mass can be compared to the original pre-treatment scan to detect any increase or decrease lesion region. However, T1 and T2 imaging in the post-treatment setting must be interpreted with caution. A mass may change in size, but the degree of necrosis is difficult to determine without the administration of contrast (Figure 1.D, 1.E, 1.F). In addition, signal characteristics may be altered after neoadjuvant therapy, possibly due to necrosis and shrinking of the lesion and associated edema, but the presence of interval hemorrhage may also be responsible for changes in signal intensity. Early degradation into methemoglobin after acute bleeding will show a hyperintense T1 signal [56], as well as alterations on T2 and STIR. Vanel et al. concluded that the true value of T2-weighted images was that the lack of T2 hyperintensity highly suggested the absence of active tumor in the post-treatment setting [57]. For T1-weighted imaging, changes in muscle texture patterns were shown to correlate with tumor presence [58], but morphologic changes seen by T1- and T2-weighted sequences are otherwise generally of limited use in the assessment of treatment response.
3.2 Contrast-enhanced MR
Contrast agents are one way to improve the specificity of T1- and T2-weighted imaging for the assessment of treatment response. Two common contrast agents are paramagnetic complexes and superparamagnetic particles [59]. When injected as contrast agents, paramagnetic agents, such as a gadolinium-based chelate, can reduce the T1 relaxation time to a much greater degree than the T2 relaxation time of blood within the tissue vasculature, and thus, are used with T1-weighted imaging. The superparamagnetic agents generally reduce T2 time more significantly and are thus best used with T2-weighted scans. Superparamagnetic iron oxide (SPIO) nanoparticles and Ultra SPIO (USPIO) have been utilized in abdominal and pelvic malignancies, but not in STS, to date [60, 61]. Gadolinium chelates are widely used. Please see Figure 1.F.
Following gadolinium administration, T1-weighted images may be acquired in a static fashion or as a dynamic study [40, 57, 62]. For the latter examination, T1-weighted images are quantified to acquire a time intensity curve. The slope and pattern of this curve has been shown to be clearly different between the initial pre-treatment exam and after chemotherapy in patients who demonstrate treatment response [63]. Early and rapid contrast enhancement generally indicates tumor viability, while the lack of early enhancement is believed to reflect necrotic tissue or compromised vascular structure [64-66].
Dynamic contrast-enhanced MR (DCE_MR) can be performed as an MR angiography sequence or a volumetric sequence of slightly higher spatial resolution. First, tumor vascular encasement and invasion can be assessed by DCE_MR [67]. Second, contrast accumulates in areas with high perfusion as well as in disordered and leaky vasculature, as would be expected in tumors. Subtraction of postcontrast from precontrast T1-weighted images can show the changes in enhancement in a tumor, as well as the vasculature, more conspicuously at the different vascular phases [62]. DCE_MR can also be performed on a whole-body scale, where it has been described for the evaluation of bone marrow focal lesions following chemotherapy and autologous stem cell transplantation (ASCT) in patients with multiple myeloma[68].
The main limitation associated with the use of contrast agents is their lack of sensitivity and target specificity. For example, in order for the currently available gadolinium chelates to effectively enhance imaging contrast, the tissue concentration must be on the order of 10−7mol/g [69]. With this concentration, anatomic/morphologic expressions of disease can be identified. However, to visualize molecular components responsible for the evolution of tumor before and after treatment, the targets of imaging are the sparse biomarkers and receptors at a concentration of 10−9 to 10−13 mol/g [70]. Recent years have seen various pre-clinical research efforts to address these limitations. For example, cell membrane alpha(nu)beta(3) targeting dramatically increased the uptake of paramagnetic liposomes by multiple rounds of internalization following ligand binding [71]. As another example, strategies to join gadolinium to immunoliposomes are being explored. Encapsulation to the aqueous space, incorporation into the lipid bilayer, and containment on the exterior by polymeriable amphiphilic polymers are some of the methods to load gadolinium to immunoliposomes [59]. Molecular MR imaging is a promising research venue for the assessment of the microenvironment of STS, although it has yet to enter the clinical realm.
3.3 MR diffusion and perfusion imaging
Diffusion weighted imaging (DWI) can provide valuable cellular information about tissue in addition to the conventional T1- and T2-weighted imaging [36, 72-81] .DWI provides important information about the movement and functional environment of water in tissue and reflects cellular status of normal and pathological tissue. Furthermore, DWI is sensitive to changes in the micro-diffusion of water within the intra-(ICS) and extracellular spaces (ECS) and cytotoxic edema due to alterations in the dependent sodium-potassium pumps[82-85]. If there are changes in the ICS, ECS or sodium-potassium pumps, the apparent diffusion coefficient (ADC) will reflect these changes and potentially serve as a biomarker of tissue response[73, 79, 86, 87]. For example, after a disruption or restriction of the flow of water within a tissue, cytotoxic edema occurs, such as: changes within the tissue due to growth of tumors[74, 88].; metastatic lesions[77, 89]. or ischemic events (e.g., stroke)[81, 84, 85, 90].
These alterations in different tissue types alter the diffusion of water which results in changes in signal intensity on the DWI (either hyperintensity or hypointensity) generally before they are seen on a T2-weighted image[81, 90]. The reason for these signal intensity changes on DWI are not exactly known; however; there is evidence that these changes may be attributable to many factors, such as shifts of water from the extracellular space to the intracellular space, increased tortuosity of the diffusion pathways, restriction of the cellular membrane permeability, increased cellular density, and/or disruption of cellular membrane depolarization[80, 82, 85, 90-92]. Moreover, DWI also provides an important quantitative biophysical parameter, called the apparent diffusion coefficient of water (ADC).
The ADC is an indicator of the movement of water within the tissue and provides a measure of the flow and distance a water molecule has moved. The ADC quantifies the combined effects of both diffusion and capillary perfusion. A “decreased” ADC is interpreted as “reduced” flow of water or diffusion, whereas in tissue with an “increased” ADC there is a less restricted water flow. The ADC has been related to the state of tissue during the growth of tumors or progression of cancer. With proliferating cells, there is an increase in cellular density and a decrease in the relative amount of ICS and ECS available, this leading to a reduction in the ADC[74, 77, 93]. If there is cellular degradation or necrosis, the flow of water is increased with concurrent increases in the ADC. Thus, DWI and ADC have become powerful indicators for characterization of prostate tissue, particularly in differentiating between benign and malignant lesions[36, 73-79].
The application of different diffusion gradient values allows for the creation of trace apparent ADC maps on a pixel-by-pixel basis for quantitative analysis according to the equation.
| (1) |
where bi = the diffusion gradient values; (b=γ2G2δ2 (Δ-δ/3), γ= gyromagnetic ratio, G=gradient strength, δ=diffusion gradient duration, Δ= time between diffusion gradient pulses, S0=1st image (b=0), and Si=ith image.
Diffusion measurement pulse sequences include the Stejskal and Tanner method [94], and the more commonly used single-shot spin-echo echo planar imaging (EPI) method. As well as the above basic pulse sequences, faster pulse sequences, such as multiple RF spin echo-based rapid acquisition with relaxation enhancement (RARE), were designed [95, 96]. Because muscle and fat signals are considerably higher in musculoskeletal soft tissues, newer modified centric-reordered RARE (mRARE) were shown to yield less distortion than those acquired with the single-shot EPI sequence, and provided more anatomic information [97]. K-space projection innovations have also been applied in designing the more recently adapted Periodically Rotated Overlapping Parallel Lines with Enhanced Reconstruction (PROPELLER), primarily applied in the liver and abdomen [98, 99].
In tumors, there is a restriction of Brownian water motion that manifests as a reduced ADC value on diffusion-weighted imaging (Figure 2). During treatment, cellular necrosis is associated with increased cell membrane permeability, thus increasing the ADC values, due to diminished restriction of Brownian motion.Studies have found a clear correlation between changes in tumor volumes and those of apparent diffusion coefficients (ADC) before and after regional or systemic chemotherapy. In one study, ADC values always decreased in association with a tumor volume increase, regardless of the effectiveness of anti-cancer therapy [100]. But, when the degree of tumor necrosis is assessed by the Salzer-Kuntschik histologic classification, necrotic areas within a tumor showed higher ADC values, compared to viable tumor areas following treatment [101]. Active research in the application of DWI to STS in recent years continues to enhance the role of DWI in assessing treatment response [102]. For example, when ADC values were acquired from multiple regions of interests in lesions, minimum ADC values were shown to be more indicative of chemotherapy treatment response in osteosarcoma than were average ADC values [103]. In other organ systems, DWI has also demonstrated much higher specificity and accuracy compared to T2-weighted imaging and DCE_MR in assessing the response of muscle-invasive bladder cancer following low-dose chemotherapy [104].
Figure 2.

A. Pretreatment scan in a 14-year-old girl with a high-grade undifferentiated sarcoma. Coronal STIR (TR/TE 1600/5) shows a large mass in the calf with a slightly heterogeneous increased signal. B. Pretreatment scan in a 14-year-old girl with a high-grade undifferentiated sarcoma. Coronal DWI (b=0) shows a heterogeneous calf mass of increased signal. C. Pretreatment scan in a 14-year-old girl with a high grade undifferentiated sarcoma. Coronal DWI (b=500) shows persistent areas of increased signal, implying the presence of viable tumor. D. Pretreatment scan in a 14-year-old girl with a high-grade undifferentiated sarcoma. Coronal ADC map shows areas of low signal intensity within the mass, indicating the presence of viable malignant tumor cells.
Another application for DWI is in characterizing soft tissue masses to determine malignancy. In one study, ADC values of chronic expanding hematomas (CEHs) were found to be significantly higher than malignant soft tissue tumors, providing a good discriminating feature between benign and malignant soft tissue tumors [105]. On the molecular imaging level, in a transgenic mouse model (CR2-TAg), DWI was shown to be able to differentiate benign and malignant prostatic tissue at a sub-millimeter scale [106]. Finally, compared to T1-weighted gadolinium enhanced imaging, DWI performs comparably for the detection of whole body tumors [78, 107]. With its non-dependence on contrast agents, DWI has great potential in the initial and post-treatment assessment of STS.
3.4 MR spectroscopy
In addition to histological composition, morphological features, and perfusion and diffusion properties, the underlying biochemical environment is fundamental to understanding tumor therapy response. MR spectroscopy (MRS) is a means of metabolic –profile with MR that not only can provide useful information about a tumor’s characteristics during initial staging [21-25, 108], but can also help in the assessment of treatment-induced biochemical changes during therapy in different tumor types[109].
With 1H MRS, information about the existence of different hydrogen-containing molecules can be obtained. For MRS acquisition, there are two major single-voxel techniques, a point-resolved spectroscopy sequence (PRESS)[110], and a stimulated echoes acquisition mode (STEAM)[111] pulse sequence. The choice of sequence can influence the spectral quality. In the human brain, PRESS is the choice for a long echo time, as it offers a gain in signal intensity by a factor of two, and is less sensitive to motion and diffusion and not susceptible to multiple quantum effects [112]. STEAM offers an advantage for the observation of metabolites with a short T2. Another short echo time technique is localization by adiabatic selective refocusing (LASER), which offers a better slice selection without the reduction of signal and less B1 inhomogeneity [113, 114].
Both qualitative measures [21, 22] and relative quantification measures [23, 109, 115] have been described for MRS, while absolute quantitation is gaining momentum for use in clinical applications. As a very common nuclei choice, proton MRS in the musculoskeletal (MSK) system than the much more thoroughly studied central nervous system (CNS) for a variety of reasons. First, because of tissue composition and water content differences between the MSK system and the brain, magnetic homogeneity, susceptibility, diffusion effects, and NMR visibility will be different in musculoskeletal tissues compared to the CNS [116, 117]. Second, the water and lipid compartments in the MSK system are vastly different compared with those found in the CNS. In the CNS, the brain white and grey matter, cerebral spinal fluid (CSF), and NMR-invisible tissues are the major subjects in spectroscopy research[118]. In the MSK system, muscle tissue and intra and extra myocellular spaces are often the major soft tissue compartmentations of spectral analysis [119-121]. Thus, the careful inclusion or suppression of different types of tissue in spectral acquisition is important in the MSK system. Third, the radiofrequency coils in clinical MSK applications differ from those in the CNS system. In MSK spectroscopy, surface receiver coils are used to collect the spectral signal, making the spectral collection strategy and signal processing different from that performed in the CNS. With the use of phased array surface coils, the need to understand and evaluate the common spectroscopy strategies is of great importance. Finally, other considerations in performing clinical MRS include the choice of a single-voxel or a multi-voxel technique. Studies using multi-voxel 1H MRS have shown greater reliability and improved sensitivity to intramyocellular differences compared to single-voxel MRS [122]. With regard to malignancies, choline metabolism is the focus in multiple types of tumor neoplasia. The rise of phosphocholine and tCho is believed to be characteristic in different types of brain, breast, and prostate tumors in in vivo and in vitro 1H and 31P MR spectroscopy studies [123-126]. For example, an overall increase of tCho (and phosphocholine) is correlated with the progression of human mammary[26] and prostatic[127] epithelial cells from normal to malignant types. Thus, recently, MRS has gained significant attention in several MSK tumor malignancy studies [21-24]. These studies utilized short and intermediate TE 1H MRS to quantify the tCho concentration for malignant and benign skeletal tumors and found tCho may serve as a marker for malignancy in musculoskeletal tumors. As an example, in figure 3 single voxel MRS data was acquired from a 81 year old woman with pleomorphic rhabdomyosarcoma. Pre-treatment tCho concentration of 2.0 mmol/kg decreased to 1.5 mmol/kg by post-treatment MRS. Histologic analysis revealed 90% treatment-related sclerosis, 5% necrosis and 5% viable tumor.
Figure 3.1.

81 year old woman with pleomorphic rhabdomyosarcoma. Pre-chemotherapy (clockwise: A-coronal STIR, B-Axial postcontrast T1, C-MRS) images. Relative to water signal, a clear Cho signal can be seen on the spectrum.
Treatment response from chemotherapy was also studied by 1H MRS. The tCho concentration, volume ratio, and tCho water ratio were all found to be substantially reduced in partially responsive lymphoma and alveolar sarcoma lesions after chemotherapy[109]. In a preclinical study on mice, vascular-disrupting agent (VDA) ZD6126 was shown to be able to significantly reduce the tCho in the radiation-induced fibrosarcoma 1 (RIF-1)[128]. This result is consistent with the reduction of cell membrane turnover associated with necrosis and cell death following the disruption of the tumor vasculature. In other organ system malignancies such as in breast cancer, patients with a greater reduction in tCho were more likely to achieve pathologically complete response[129]. For glioma patients, the mean tumor tCho/NAA ratio and normalized tCho were also found to be diminished over the course of post-operative radiotherapy [130].
Traditionally, a tCho level change was interpreted to be a result of alterations in cellular proliferation. More recent studies have emphasized the role of several oncogenes and other biomarkers in controlling choline metabolism [131, 132]. For example, Ki-67, P-gp, p53, TLS-CHOP, cyclins, survivin,,TERT [133], and activated receptor-associated tyrosine kinase c-kit[134], have been identified in various types of STS. Imaging most of the above biomarkers in the clinical environment is still beyond the capability of MRS, but the development of molecular imaging will definitely provide an opportunity to explore these pathways of Choline metabolism[131].
Although not in common clinical use, 31P MRS has the potential to be utilized in the assessment of treatment response. With 31P MRS, it has been demonstrated that viable tumors characteristically show strong signals of phosphomonoester (PME) (doublets at 6.87 ppm), phosphodiester (PDE) (doublets at 3.20 ppm), and moderately increased signals of Pi and low PCr[135]. Inorganic phosphase is used to measure in vivo pH values for human and animal tumors [124, 136, 137]. Figure 4 is an example of elevated ratio of PME/ATP and Pi/ATP and pH values corresponding to the aggressiveness of human leiomyosarcoma[138]. Because the human intracellular volume fraction is generally greater than 50%, the measured pH values are generally considered to be intracellular pH. Thus, this application should be examined carefully because, during pathological states such as necrosis, extracellular Pi can be visible [139, 140]. For tumors in mice, 3-aminopropylphosphate (3-APP) has been used to measure extracellular pH values[137]. Another example is the assessment of isolated limb perfusion (ILP) using 31P MRS by Kettelhack et al. [141]. In this study, the ratio of PME/PCR and PME/β-ATP was decreased after ILP, with the latter ratio a more promising indicator of therapy response.
Figure 4.

In vivo phosphorus MRS before neoadjuvant therapy of a 75 year-old female with a leiomyosarcoma in the gluteal region. The MR data was acquired from a tumor mass with a long diameter of 9-10 cm using a 1.5 Tesla clinical MR scanner (Siemens Helicon, Siemens Medical Corporation, Iselin NJ, USA). The image data and analysis was provided in courtesy of Dr. Fernando Arias-Mendoza of Columbia University, U.S. The grid overlaying the image is the projection of the 3D voxel matrix of the phosphorus data set. Six spectra are shown in green and the three voxels completely inside the tumor were highlighted (yellow boxes) and their spectra (A-C) expanded. Peak assignments: EtnP, phosphoethanolamine; ChoP, phosphocholine; Pi, inorganic phosphate; NTP, the three 31P signals from nucleoside triphosphates (α, β, and γ). Each spectrum shows different spectral qualities, good signals in spectrum A, adequate in B, and minimal in C. The signal quality of spectra A and B correspond to areas with different degree of cellularity, while spectrum C matches with necrosis or large amounts of fibroid/myxoid matrix. The patient’s surgical specimen was reported as highly cellular with areas of focal necrosis, matching with the spectral findings. In addition to these, signal quantification in spectra A and B showed important differences. The [EtnP+ChoP]/NTP, Pi/NTP, and pH values in spectrum A were 1.13, 0.42, and 7.07 and in spectrum B 1.46, 0.88, and 7.48, respectively. The higher values of the three parameters of spectrum B are related to a more aggressive sarcoma, in comparison to spectrum A, whose parameters are of a less aggressive form. The more aggressive spectral characteristics of spectrum B are suggestive of a high-grade sarcoma as was the case in this patient.
Finally, 19F MRS, while not in clinical use, has been used to monitor the pharmacodynamics of surrogate markers in transgenic cancer models [142]. In this study, cytosine deaminase catalyzed conversion of the 5-fluorocytosine prodrug to the chemotherapeutic agent 5-fluorouracil (5-FU) was directly observed by 19F MRS. SR-4554, a fluorinated 2-nitroimidazole noninvasive probe of tumor hypoxia, was also evaluated as a 19F NMR hypoxia reporter agent for NMR spectroscopy [143].
3.5 Other MR imaging modalities
For the imaging of hypoxia, several reporter molecules have been developed, such as pimonidazole, EF5, CCI-103F, Cu-ATSM, and others [144]. When injected intravenously, these molecular agents will reoxidize in the presence of oxygen, and thus, reveal microscopic-scale hypoxia. In addition, blood oxygen level-dependent imaging (BOLD), which is widely used in functional MR in the brain, has been used to study oxyhemoglobin (oxyHb) in breast cancer hypoxia[145] and may one day be applied to the study of sarcomas.
Other means of imaging hypoxia include T2* or R2* imaging, which can measure the transverse relaxation rate of blood and surrounding tissues. Local magnetic field inhomogeneities, caused by susceptibility differences and hyperintense signal from relatively long T2* tissues, are the two major types of T2* imaging [146]. For the first type of T2* imaging, the deoxyhemoglobin in the red blood cells has a paramagnetic effect, which causes a decrease in the apparent T2* through changes in bulk magnetic susceptibility; pulse sequences, such as gradient recall echoes, can generate blood oxygen level-dependent contrast between activated and resting tissues [147]. Because it can demonstrate blood oxygenation-related paramagnetism, for specific types of tumors, this imaging modality can therefore be used to reflect tissue hypoxia [145]. To measure oxygen tension, perfluorooctyl bromide (PFOB) emulsion has been used by 19F MRS [14, 148].
Because angiogenesis is important for tumor growth and metastasis, the in vivo detection and quantification of angiogenesis would be of paramount importance to the diagnosis of a tumor and the evaluation of treatment response. To assess post treatment changes in tumor angiogenesis and oxygenation, a technique called Overhauser-enhanced MRI (OMRI) has been devised [149]. With the help of the oxygen-sensitive contrast agent, OX63, OMRI uses hyperpolarized 1H MRI to study the tissue oxygen level. By acquiring OMRI images at different hyperpolarization levels, local tumor oxygen concentration and microvascular permeability can be simultaneously determined.
Although MRI is the most sensitive noninvasive, nonradioactive method for detection of metastatic disease, it was limited to localized imaging of organs. New paradigms for metastatic lesion detection and monitoring of therapy are emerging, such as the whole-body imaging using MR imaging. Recent developments in the field of MR technology, including gradient systems, RF coils, and “rolling bed” methods allow whole-body coverage. Indeed, conventional and advanced MR imaging sequences can be used such as, inversion recovery T1-weighted imaging, T2-weighted imaging, and DWI[78, 150-152]. Whole body MR imaging (WB-MR) will enable better spatial resolution and soft tissue delineation for more accurate assessment of STS or other MSK lesions. More importantly, through the use of WB-DWI a better estimation of treatment response in STS may be possible. Indeed, as noted above, DWI and MRS provide functional cellular information that would complement routine anatomical imaging with T1- and T2-weighted sequences. By capitalizing on these methods in a “whole body imaging setting”, an excellent platform to investigate metastatic disease and to correlate with other biomarkers will be created.
Whole-body acquisition strategies include multiple packages, parallel imaging, and variable flip angles to reduce the specific absorption rate (SAR) and susceptibility-induced difficulties [153-156]. While emerging as a technique for the staging of other malignancies and potentially sarcomas, whole-body MR may become important as a one-stop-shop for the assessment of treatment response in a sarcoma along with re-staging following treatment as shown in figure 5. This study is a representative example of WB-MR and DWI at 3T in a normal female volunteer. Combining the T2 and DWI information, whole body MR imaging may prove to play a role in the evaluation of the primary site of disease as well as metastatic foci with subsequent evaluation of these sites for changes following treatment.
Figure 5.
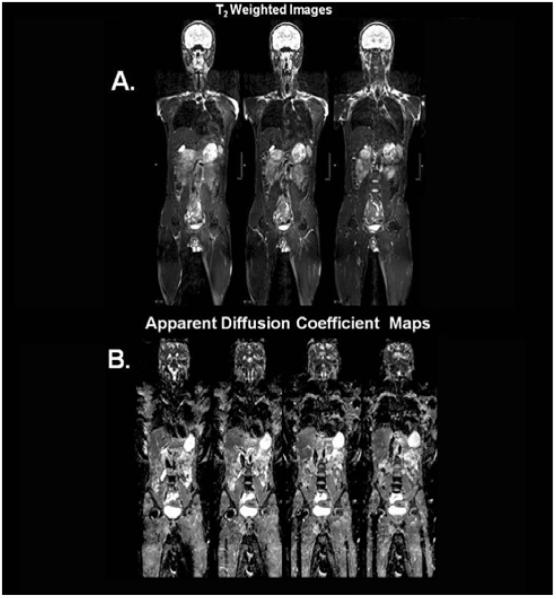
Representative example of WB-MR and DWI at 3T in a normal female volunteer. A. Whole body coronal T2-weighted images through the center of the body. B. Corresponding ADC maps generated from the DWI images.
4. Conclusions
The role of MR imaging in monitoring the therapeutic response in soft tissue sarcomas continues to evolve. At the present time, MR imaging is part of a more comprehensive process that involves other modalities, such as PET imaging, for the assessment of treatment-related necrosis. Nevertheless, MR imaging has some unique advantages in the study of treatment response. These advantages include the lack of ionizing radiation and its relatively high spatial resolution compared with nuclear medicine studies. Directions for the near future include studies at higher magnetic field strengths with emphasis on diffusion, perfusion and metabolic MR imaging as well as the development of whole-body MR techniques. Although many imaging targets are extensively studied in the laboratory setting, their use in in vivo human tissue remains to be realized.
Figure 3.2.

Post- chemotherapy images (clockwise: D-coronal STIR, E-Axial postcontrast T1, F-MRS)show a decrease in size with heterogeneous alterations in signal and contrast enhancement. Relative to water signal, a much reduced Cho can be seen on the spectrum. A slightly different intersection of patient’s body is displayed in this figure comparing to figure 3.1 for optimal positioning of voxel.
Acknowledgments
Grant support: 1) General Electric Radiology Research Academic Fellowship (GERRAF), 2) Society of Computed Body Tomography and Magnetic Resonance Young Investigator Award 3) The William M.G. Gatewood Fellowship, NIH 1R01CA100184, P50CA103175, 5P30CA06973, Breast SPORE:P50CA88843, Avon:01-2009-031 and U01CA070095
References
- 1.Fletcher CDM, Fredrik U.K.K., Mertens. In: World Health Organization Classification of Tumours: pathology and genetics of tumours of soft tissue and bone. I.A.f.R.o.C. (IARC), editor. IARCPress; 2002. [Google Scholar]
- 2.Coindre JM. Grading of soft tissue sarcomas: review and update. Arch Pathol Lab Med. 2006;130(10):1448–53. doi: 10.5858/2006-130-1448-GOSTSR. [DOI] [PubMed] [Google Scholar]
- 3.de Saint Aubain Somerhausen N, Fletcher CD. Soft-tissue sarcomas: an update. Eur J Surg Oncol. 1999;25(2):215–20. doi: 10.1053/ejso.1998.0630. [DOI] [PubMed] [Google Scholar]
- 4.Guillou L, Coindre JM, Bonichon F, Nguyen BB, Terrier P, Collin F, Vilain MO, Mandard AM, Le Doussal V, Leroux A, Jacquemier J, Duplay H, Sastre-Garau X, Costa J. Comparative study of the National Cancer Institute and French Federation of Cancer Centers Sarcoma Group grading systems in a population of 410 adult patients with soft tissue sarcoma. J Clin Oncol. 1997;15(1):350–62. doi: 10.1200/JCO.1997.15.1.350. [DOI] [PubMed] [Google Scholar]
- 5.Coindre JM, Terrier P, Bui NB, Bonichon F, Collin F, Le Doussal V, Mandard AM, Vilain MO, Jacquemier J, Duplay H, Sastre X, Barlier C, Henry-Amar M, Mace-Lesech J, Contesso G. Prognostic factors in adult patients with locally controlled soft tissue sarcoma. A study of 546 patients from the French Federation of Cancer Centers Sarcoma Group. J Clin Oncol. 1996;14(3):869–77. doi: 10.1200/JCO.1996.14.3.869. [DOI] [PubMed] [Google Scholar]
- 6.Markhede G, Angervall L, Stener B. A multivariate analysis of the prognosis after surgical treatment of malignant soft-tissue tumors. Cancer. 1982;49(8):1721–33. doi: 10.1002/1097-0142(19820415)49:8<1721::aid-cncr2820490832>3.0.co;2-x. [DOI] [PubMed] [Google Scholar]
- 7.Welker JA, Henshaw RM, Jelinek J, Shmookler BM, Malawer MM. The percutaneous needle biopsy is safe and recommended in the diagnosis of musculoskeletal masses. Cancer. 2000;89(12):2677–86. doi: 10.1002/1097-0142(20001215)89:12<2677::aid-cncr22>3.0.co;2-l. [DOI] [PubMed] [Google Scholar]
- 8.Yang J, Frassica FJ, Fayad L, Clark DP, Weber KL. Analysis of Nondiagnostic Results after Image-guided Needle Biopsies of Musculoskeletal Lesions. Clin Orthop Relat Res. 2010;468(11):3103–11. doi: 10.1007/s11999-010-1337-1. [DOI] [PMC free article] [PubMed] [Google Scholar]
- 9.Skubitz KM, D’Adamo DR. Sarcoma. Mayo Clin Proc. 2007;82(11):1409–32. doi: 10.4065/82.11.1409. [DOI] [PubMed] [Google Scholar]
- 10.De Schepper AM, De Beuckeleer L, Vandevenne J, Somville J. Magnetic resonance imaging of soft tissue tumors. Eur Radiol. 2000;10(2):213–23. doi: 10.1007/s003300050037. [DOI] [PubMed] [Google Scholar]
- 11.He Q, Xu RZ, Shkarin P, Pizzorno G, Lee-French CH, Rothman DL, Shungu DC, Shim H. Magnetic resonance spectroscopic imaging of tumor metabolic markers for cancer diagnosis, metabolic phenotyping, and characterization of tumor microenvironment. Dis Markers. 2003;19(2-3):69–94. doi: 10.1155/2004/424395. [DOI] [PMC free article] [PubMed] [Google Scholar]
- 12.Warburg O. The Metabolism of Tumor. Constable&Co, Ltd.; London, England: 1930. [Google Scholar]
- 13.Bhujwalla ZM, Artemov D, Ballesteros P, Cerdan S, Gillies RJ, Solaiyappan M. Combined vascular and extracellular pH imaging of solid tumors. NMR Biomed. 2002;15(2):114–9. doi: 10.1002/nbm.743. [DOI] [PubMed] [Google Scholar]
- 14.Gillies RJ, Bhujwalla ZM, Evelhoch J, Garwood M, Neeman M, Robinson SP, Sotak CH, Van Der Sanden B. Applications of magnetic resonance in model systems: tumor biology and physiology. Neoplasia. 2000;2(1-2):139–51. doi: 10.1038/sj.neo.7900076. [DOI] [PMC free article] [PubMed] [Google Scholar]
- 15.van Sluis R, Bhujwalla ZM, Raghunand N, Ballesteros P, Alvarez J, Cerdan S, Galons JP, Gillies RJ. In vivo imaging of extracellular pH using 1H MRSI. Magn Reson Med. 1999;41(4):743–50. doi: 10.1002/(sici)1522-2594(199904)41:4<743::aid-mrm13>3.0.co;2-z. [DOI] [PubMed] [Google Scholar]
- 16.Sostman HD, Prescott DM, Dewhirst MW, Dodge RK, Thrall DE, Page RL, Tucker JA, Harrelson JM, Reece G, Leopold KA, et al. MR imaging and spectroscopy for prognostic evaluation in soft-tissue sarcomas. Radiology. 1994;190(1):269–75. doi: 10.1148/radiology.190.1.8259418. [DOI] [PubMed] [Google Scholar]
- 17.Brizel DM, Scully SP, Harrelson JM, Layfield LJ, Bean JM, Prosnitz LR, Dewhirst MW. Tumor oxygenation predicts for the likelihood of distant metastases in human soft tissue sarcoma. Cancer Res. 1996;56(5):941–3. [PubMed] [Google Scholar]
- 18.Chapman JD, Engelhardt EL, Stobbe CC, Schneider RF, Hanks GE. Measuring hypoxia and predicting tumor radioresistance with nuclear medicine assays. Radiother Oncol. 1998;46(3):229–37. doi: 10.1016/s0167-8140(97)00186-2. [DOI] [PubMed] [Google Scholar]
- 19.Exton JH. Signaling through phosphatidylcholine breakdown. J Biol Chem. 1990;265(1):1–4. [PubMed] [Google Scholar]
- 20.Pelech SL, Vance DE. Signal transduction via phosphatidylcholine cycles. Trends in Biochemical Sciences. 1989;14(1):28–30. [Google Scholar]
- 21.Fayad LM, Barker PB, Bluemke DA. Molecular characterization of musculoskeletal tumors by proton MR spectroscopy. Semin Musculoskelet Radiol. 2007;11(3):240–5. doi: 10.1055/s-2008-1038313. [DOI] [PubMed] [Google Scholar]
- 22.Fayad LM, Barker PB, Jacobs MA, Eng J, Weber KL, Kulesza P, Bluemke DA. Characterization of musculoskeletal lesions on 3-T proton MR spectroscopy. AJR Am J Roentgenol. 2007;188(6):1513–20. doi: 10.2214/AJR.06.0935. [DOI] [PubMed] [Google Scholar]
- 23.Fayad LM, Bluemke DA, McCarthy EF, Weber KL, Barker PB, Jacobs MA. Musculoskeletal tumors: use of proton MR spectroscopic imaging for characterization. J Magn Reson Imaging. 2006;23(1):23–8. doi: 10.1002/jmri.20448. [DOI] [PubMed] [Google Scholar]
- 24.Fayad LM, Salibi N, Wang X, Machado AJ, Jacobs MA, Bluemke DA, Barker PB. Quantification of muscle choline concentrations by proton MR spectroscopy at 3 T: technical feasibility. AJR Am J Roentgenol. 2010;194(1):W73–9. doi: 10.2214/AJR.09.3125. [DOI] [PMC free article] [PubMed] [Google Scholar]
- 25.Fayad LM, Wang X, Salibi N, Barker PB, Jacobs MA, Machado AJ, Weber KL, Bluemke DA. A feasibility study of quantitative molecular characterization of musculoskeletal lesions by proton MR spectroscopy at 3 T. AJR Am J Roentgenol. 2010;195(1):W69–75. doi: 10.2214/AJR.09.3718. [DOI] [PMC free article] [PubMed] [Google Scholar]
- 26.Aboagye EO, Bhujwalla ZM. Malignant transformation alters membrane choline phospholipid metabolism of human mammary epithelial cells. Cancer Res. 1999;59(1):80–4. [PubMed] [Google Scholar]
- 27.Gill SS, Thomas DG, Van Bruggen N, Gadian DG, Peden CJ, Bell JD, Cox IJ, Menon DK, Iles RA, Bryant DJ, et al. Proton MR spectroscopy of intracranial tumours: in vivo and in vitro studies. J Comput Assist Tomogr. 1990;14(4):497–504. doi: 10.1097/00004728-199007000-00001. [DOI] [PubMed] [Google Scholar]
- 28.Glunde K, Artemov D, Penet MF, Jacobs MA, Bhujwalla ZM. Magnetic resonance spectroscopy in metabolic and molecular imaging and diagnosis of cancer. Chem Rev. 2010;110(5):3043–59. doi: 10.1021/cr9004007. [DOI] [PMC free article] [PubMed] [Google Scholar]
- 29.Kurhanewicz J, Vigneron DB, Nelson SJ, Hricak H, MacDonald JM, Konety B, Narayan P. Citrate as an in vivo marker to discriminate prostate cancer from benign prostatic hyperplasia and normal prostate peripheral zone: detection via localized proton spectroscopy. Urology. 1995;45(3):459–66. doi: 10.1016/S0090-4295(99)80016-8. [DOI] [PubMed] [Google Scholar]
- 30.Mukherji SK, Schiro S, Castillo M, Kwock L, Muller KE, Blackstock W. Proton MR spectroscopy of squamous cell carcinoma of the extracranial head and neck: in vitro and in vivo studies. AJNR Am J Neuroradiol. 1997;18(6):1057–72. [PMC free article] [PubMed] [Google Scholar]
- 31.Roebuck JR, Cecil KM, Schnall MD, Lenkinski RE. Human breast lesions: characterization with proton MR spectroscopy. Radiology. 1998;209(1):269–75. doi: 10.1148/radiology.209.1.9769842. [DOI] [PubMed] [Google Scholar]
- 32.Skubitz KM, Haddad PA. Paclitaxel and pegylated-liposomal doxorubicin are both active in angiosarcoma. Cancer. 2005;104(2):361–6. doi: 10.1002/cncr.21140. [DOI] [PubMed] [Google Scholar]
- 33.Robinson D, Yassin M, Nevo Z. Cryotherapy of musculoskeletal tumors--from basic science to clinical results. Technol Cancer Res Treat. 2004;3(4):371–5. doi: 10.1177/153303460400300407. [DOI] [PubMed] [Google Scholar]
- 34.Marcove RC, Miller TR. The treatment of primary and metastatic localized bone tumors by cryosurgery. Surg Clin North Am. 1969;49(2):421–30. doi: 10.1016/s0039-6109(16)38799-0. [DOI] [PubMed] [Google Scholar]
- 35.Hazle JD, Stafford RJ, Price RE. Magnetic resonance imaging-guided focused ultrasound thermal therapy in experimental animal models: correlation of ablation volumes with pathology in rabbit muscle and VX2 tumors. J Magn Reson Imaging. 2002;15(2):185–94. doi: 10.1002/jmri.10055. [DOI] [PubMed] [Google Scholar]
- 36.Jacobs MA, Herskovits EH, Kim HS. Uterine fibroids: diffusion-weighted MR imaging for monitoring therapy with focused ultrasound surgery--preliminary study. Radiology. 2005;236(1):196–203. doi: 10.1148/radiol.2361040312. [DOI] [PubMed] [Google Scholar]
- 37.Jolesz FA, Hynynen K, McDannold N, Tempany C. MR imaging-controlled focused ultrasound ablation: a noninvasive image-guided surgery. Magn Reson Imaging Clin N Am. 2005;13(3):545–60. doi: 10.1016/j.mric.2005.04.008. [DOI] [PubMed] [Google Scholar]
- 38.Stewart EA, Gedroyc WM, Tempany CM, Quade BJ, Inbar Y, Ehrenstein T, Shushan A, Hindley JT, Goldin RD, David M, Sklair M, Rabinovici J. Focused ultrasound treatment of uterine fibroid tumors: safety and feasibility of a noninvasive thermoablative technique. Am J Obstet Gynecol. 2003;189(1):48–54. doi: 10.1067/mob.2003.345. [DOI] [PubMed] [Google Scholar]
- 39.Wu F, Chen WZ, Bai J, Zou JZ, Wang ZL, Zhu H, Wang ZB. Tumor vessel destruction resulting from high-intensity focused ultrasound in patients with solid malignancies. Ultrasound Med Biol. 2002;28(4):535–42. doi: 10.1016/s0301-5629(01)00515-4. [DOI] [PubMed] [Google Scholar]
- 40.Vanel D, Shapeero L, Guinebretiere J, et al. In: Posttreatment assessment of soft tissue tumors, in Imaging of soft tissue tumors. De Schepper A, editor. Springer; Berlin, Heidelberg, New York: 1997. pp. 113–126. [Google Scholar]
- 41.Salzer-Kuntschik M, Brand G, Delling G. Determination of the degree of morphological regression following chemotherapy in malignant bone tumors. Pathologe. 1983;4(3):135–41. [PubMed] [Google Scholar]
- 42.Salzer-Kuntschik M, Delling G, Beron G, Sigmund R. Morphological grades of regression in osteosarcoma after polychemotherapy - study COSS 80. J Cancer Res Clin Oncol. 1983;106(Suppl):21–4. doi: 10.1007/BF00625047. [DOI] [PubMed] [Google Scholar]
- 43.Therasse P, Arbuck SG, Eisenhauer EA, Wanders J, Kaplan RS, Rubinstein L, Verweij J, Van Glabbeke M, van Oosterom AT, Christian MC, Gwyther SG. New guidelines to evaluate the response to treatment in solid tumors. European Organization for Research and Treatment of Cancer, National Cancer Institute of the United States, National Cancer Institute of Canada. J Natl Cancer Inst. 2000;92(3):205–16. doi: 10.1093/jnci/92.3.205. [DOI] [PubMed] [Google Scholar]
- 44.Therasse P, Eisenhauer EA, Verweij J. RECIST revisited: a review of validation studies on tumour assessment. Eur J Cancer. 2006;42(8):1031–9. doi: 10.1016/j.ejca.2006.01.026. [DOI] [PubMed] [Google Scholar]
- 45.Schuetze SM, Baker LH, Benjamin RS, Canetta R. Selection of response criteria for clinical trials of sarcoma treatment. Oncologist. 2008;13(Suppl 2):32–40. doi: 10.1634/theoncologist.13-S2-32. [DOI] [PubMed] [Google Scholar]
- 46.Jaffe CC. Response assessment in clinical trials: implications for sarcoma clinical trial design. Oncologist. 2008;13(Suppl 2):14–8. doi: 10.1634/theoncologist.13-S2-14. [DOI] [PubMed] [Google Scholar]
- 47.Stacchiotti S, Collini P, Messina A, Morosi C, Barisella M, Bertulli R, Piovesan C, Dileo P, Torri V, Gronchi A, Casali PG. High-grade soft-tissue sarcomas: tumor response assessment--pilot study to assess the correlation between radiologic and pathologic response by using RECIST and Choi criteria. Radiology. 2009;251(2):447–56. doi: 10.1148/radiol.2512081403. [DOI] [PubMed] [Google Scholar]
- 48.Choi H. Response evaluation of gastrointestinal stromal tumors. Oncologist. 2008;13(Suppl 2):4–7. doi: 10.1634/theoncologist.13-S2-4. [DOI] [PubMed] [Google Scholar]
- 49.Eisenhauer EA, Therasse P, Bogaerts J, Schwartz LH, Sargent D, Ford R, Dancey J, Arbuck S, Gwyther S, Mooney M, Rubinstein L, Shankar L, Dodd L, Kaplan R, Lacombe D, Verweij J. New response evaluation criteria in solid tumours: revised RECIST guideline (version 1.1) Eur J Cancer. 2009;45(2):228–47. doi: 10.1016/j.ejca.2008.10.026. [DOI] [PubMed] [Google Scholar]
- 50.Wahl RL, Jacene H, Kasamon Y, Lodge MA. From RECIST to PERCIST: Evolving Considerations for PET response criteria in solid tumors. J Nucl Med. 2009;50(Suppl 1):122S–50S. doi: 10.2967/jnumed.108.057307. [DOI] [PMC free article] [PubMed] [Google Scholar]
- 51.Siegel MJ. Magnetic resonance imaging of musculoskeletal soft tissue masses. Radiol Clin North Am. 2001;39(4):701–20. doi: 10.1016/s0033-8389(05)70306-7. [DOI] [PubMed] [Google Scholar]
- 52.McSweeney MB, Small WC, Cerny V, Sewell W, Powell RW, Goldstein JH. Magnetic resonance imaging in the diagnosis of breast disease: use of transverse relaxation times. Radiology. 1984;153(3):741–4. doi: 10.1148/radiology.153.3.6093191. [DOI] [PubMed] [Google Scholar]
- 53.Merchant TE, Thelissen GR, de Graaf PW, Nieuwenhuizen CW, Kievit HC, Den Otter W. Application of a mixed imaging sequence for MR imaging characterization of human breast disease. Acta Radiol. 1993;34(4):356–61. [PubMed] [Google Scholar]
- 54.Wu JS, Hochman MG. Soft-tissue tumors and tumorlike lesions: a systematic imaging approach. Radiology. 2009;253(2):297–316. doi: 10.1148/radiol.2532081199. [DOI] [PubMed] [Google Scholar]
- 55.Richardson ML, Lough LR, Shuman WP, Lazerte GD, Conrad EU. MR appearance of skeletal neoplasms following cryotherapy. Skeletal Radiol. 1994;23(2):121–5. doi: 10.1007/BF00563206. [DOI] [PubMed] [Google Scholar]
- 56.Ilaslan H, Sundaram M. Advances in musculoskeletal tumor imaging. Orthop Clin North Am. 2006;37(3):375–91. vii. doi: 10.1016/j.ocl.2006.05.003. [DOI] [PubMed] [Google Scholar]
- 57.Vanel D, Lacombe MJ, Couanet D, Kalifa C, Spielmann M, Genin J. Musculoskeletal tumors: follow-up with MR imaging after treatment with surgery and radiation therapy. Radiology. 1987;164(1):243–5. doi: 10.1148/radiology.164.1.3588913. [DOI] [PubMed] [Google Scholar]
- 58.Biondetti PR, Ehman RL. Soft-tissue sarcomas: use of textural patterns in skeletal muscle as a diagnostic feature in postoperative MR imaging. Radiology. 1992;183(3):845–8. doi: 10.1148/radiology.183.3.1584945. [DOI] [PubMed] [Google Scholar]
- 59.Kozlowska D, Foran P, MacMahon P, Shelly MJ, Eustace S, O’Kennedy R. Molecular and magnetic resonance imaging: The value of immunoliposomes. Adv Drug Deliv Rev. 2009;61(15):1402–11. doi: 10.1016/j.addr.2009.09.003. [DOI] [PubMed] [Google Scholar]
- 60.Anzai Y. Superparamagnetic iron oxide nanoparticles: nodal metastases and beyond. Top Magn Reson Imaging. 2004;15(2):103–11. doi: 10.1097/01.rmr.0000130602.65243.87. [DOI] [PubMed] [Google Scholar]
- 61.Harisinghani MG, Saini S, Weissleder R, Hahn PF, Yantiss RK, Tempany C, Wood BJ, Mueller PR. MR lymphangiography using ultrasmall superparamagnetic iron oxide in patients with primary abdominal and pelvic malignancies: radiographic-pathologic correlation. AJR Am J Roentgenol. 1999;172(5):1347–51. doi: 10.2214/ajr.172.5.10227514. [DOI] [PubMed] [Google Scholar]
- 62.Vanel D, Shapeero LG, Tardivon A, Western A, Guinebretiere JM. Dynamic contrast-enhanced MRI with subtraction of aggressive soft tissue tumors after resection. Skeletal Radiol. 1998;27(9):505–10. doi: 10.1007/s002560050428. [DOI] [PubMed] [Google Scholar]
- 63.Kawai A, Sugihara S, Kunisada T, Uchida Y, Inoue H. Imaging assessment of the response of bone tumors to preoperative chemotherapy. Clin Orthop Relat Res. 1997;(337):216–25. doi: 10.1097/00003086-199704000-00024. [DOI] [PubMed] [Google Scholar]
- 64.Bartolozzi C, Lencioni R, Caramella D, Mazzeo S, Ciancia EM. Treatment of hepatocellular carcinoma with percutaneous ethanol injection: evaluation with contrast-enhanced MR imaging. AJR Am J Roentgenol. 1994;162(4):827–31. doi: 10.2214/ajr.162.4.8141000. [DOI] [PubMed] [Google Scholar]
- 65.Castrucci M, Sironi S, De Cobelli F, Salvioni M, Del Maschio A. Plain and gadolinium-DTPA-enhanced MR imaging of hepatocellular carcinoma treated with transarterial chemoembolization. Abdom Imaging. 1996;21(6):488–94. doi: 10.1007/s002619900110. [DOI] [PubMed] [Google Scholar]
- 66.Murakami T, Nakamura H, Hori S, Tomoda K, Mitani T, Nakanishi K, Hashimoto T, Tsuda K, Kozuka T, Monden M, et al. Detection of viable tumor cells in hepatocellular carcinoma following transcatheter arterial chemoembolization with iodized oil. Pathologic correlation with dynamic turbo-FLASH MR imaging with Gd-DTPA. Acta Radiol. 1993;34(4):399–403. [PubMed] [Google Scholar]
- 67.Feydy A, Anract P, Tomeno B, Chevrot A, Drape JL. Assessment of vascular invasion by musculoskeletal tumors of the limbs: use of contrast-enhanced MR angiography. Radiology. 2006;238(2):611–21. doi: 10.1148/radiol.2382041725. [DOI] [PubMed] [Google Scholar]
- 68.Lin C, Luciani A, Belhadj K, Deux JF, Kuhnowski F, Maatouk M, Beaussart P, Cuenod CA, Haioun C, Rahmouni A. Multiple myeloma treatment response assessment with whole-body dynamic contrast-enhanced MR imaging. Radiology. 2010;254(2):521–31. doi: 10.1148/radiol.09090629. [DOI] [PubMed] [Google Scholar]
- 69.Gupta H, Weissleder R. Targeted contrast agents in MR imaging. Magn Reson Imaging Clin N Am. 1996;4(1):171–84. [PubMed] [Google Scholar]
- 70.Strijkers GJ, Mulder WJ, van Heeswijk RB, Frederik PM, Bomans P, Magusin PC, Nicolay K. Relaxivity of liposomal paramagnetic MRI contrast agents. Magma. 2005;18(4):186–92. doi: 10.1007/s10334-005-0111-y. [DOI] [PubMed] [Google Scholar]
- 71.Kok MB, Hak S, Mulder WJ, van der Schaft DW, Strijkers GJ, Nicolay K. Cellular compartmentalization of internalized paramagnetic liposomes strongly influences both T1 and T2 relaxivity. Magn Reson Med. 2009;61(5):1022–32. doi: 10.1002/mrm.21910. [DOI] [PubMed] [Google Scholar]
- 72.Castillo M, Arbelaez A, Smith JK, Fisher LL. Diffusion-weighted MR imaging offers no advantage over routine noncontrast MR imaging in the detection of vertebral metastases. AJNR Am J Neuroradiol. 2000;21(5):948–53. [PMC free article] [PubMed] [Google Scholar]
- 73.Chenevert TL, Meyer CR, Moffat BA, Rehemtulla A, Mukherji SK, Gebarski SS, Quint DJ, Robertson PL, Lawrence TS, Junck L, Taylor JM, Johnson TD, Dong Q, Muraszko KM, Brunberg JA, Ross BD. Diffusion MRI: a new strategy for assessment of cancer therapeutic efficacy. Mol Imaging. 2002;1(4):336–43. doi: 10.1162/15353500200221482. [DOI] [PubMed] [Google Scholar]
- 74.Chenevert TL, Stegman LD, Taylor JM, Robertson PL, Greenberg HS, Rehemtulla A, Ross BD. Diffusion magnetic resonance imaging: an early surrogate marker of therapeutic efficacy in brain tumors. J Natl Cancer Inst. 2000;92(24):2029–36. doi: 10.1093/jnci/92.24.2029. [DOI] [PubMed] [Google Scholar]
- 75.Ei Khouli RH, Jacobs MA, Mezban SD, Huang P, Kamel IR, Macura KJ, Bluemke DA. Diffusion-weighted imaging improves the diagnostic accuracy of conventional 3.0-T breast MR imaging. Radiology. 2010;256(1):64–73. doi: 10.1148/radiol.10091367. [DOI] [PMC free article] [PubMed] [Google Scholar]
- 76.Herneth AM, Friedrich K, Weidekamm C, Schibany N, Krestan C, Czerny C, Kainberger F. Diffusion weighted imaging of bone marrow pathologies. Eur J Radiol. 2005;55(1):74–83. doi: 10.1016/j.ejrad.2005.03.031. [DOI] [PubMed] [Google Scholar]
- 77.Jacobs MA, Ouwerkerk R, Kamel I, Bottomley PA, Bluemke DA, Kim HS. Proton, diffusion-weighted imaging, and sodium (23Na) MRI of uterine leiomyomata after MR-guided high-intensity focused ultrasound: a preliminary study. J Magn Reson Imaging. 2009;29(3):649–56. doi: 10.1002/jmri.21677. [DOI] [PMC free article] [PubMed] [Google Scholar]
- 78.Jacobs MA, Pan L, Macura KJ. Whole-body diffusion-weighted and proton imaging: a review of this emerging technology for monitoring metastatic cancer. Semin Roentgenol. 2009;44(2):111–22. doi: 10.1053/j.ro.2009.01.003. [DOI] [PMC free article] [PubMed] [Google Scholar]
- 79.Jin G, An N, Jacobs MA, Li K. The role of parallel diffusion-weighted imaging and apparent diffusion coefficient (ADC) map values for evaluating breast lesions: preliminary results. Acad Radiol. 2010;17(4):456–63. doi: 10.1016/j.acra.2009.12.004. [DOI] [PMC free article] [PubMed] [Google Scholar]
- 80.Mintorovitch J, Moseley ME, Chileuitt L, Shimizu H, Cohen Y, Weinstein PR. Comparison of diffusion- and T2-weighted MRI for the early detection of cerebral ischemia and reperfusion in rats. Magn Reson Med. 1991;18(1):39–50. doi: 10.1002/mrm.1910180106. [DOI] [PubMed] [Google Scholar]
- 81.Moseley ME, Kucharczyk J, Mintorovitch J, Cohen Y, Kurhanewicz J, Derugin N, Asgari H, Norman D. Diffusion-weighted MR imaging of acute stroke: correlation with T2-weighted and magnetic susceptibility-enhanced MR imaging in cats. AJNR Am J Neuroradiol. 1990;11(3):423–9. [PMC free article] [PubMed] [Google Scholar]
- 82.Babsky AM, Topper S, Zhang H, Gao Y, James JR, Hekmatyar SK, Bansal N. Evaluation of extra- and intracellular apparent diffusion coefficient of sodium in rat skeletal muscle: effects of prolonged ischemia. Magn Reson Med. 2008;59(3):485–91. doi: 10.1002/mrm.21568. [DOI] [PubMed] [Google Scholar]
- 83.Le Bihan D, Breton E, Lallemand D, Aubin ML, Vignaud J, Laval-Jeantet M. Separation of diffusion and perfusion in intravoxel incoherent motion MR imaging. Radiology. 1988;168(2):497–505. doi: 10.1148/radiology.168.2.3393671. [DOI] [PubMed] [Google Scholar]
- 84.Le Bihan D, Breton E, Lallemand D, Grenier P, Cabanis E, Laval-Jeantet M. MR imaging of intravoxel incoherent motions: application to diffusion and perfusion in neurologic disorders. Radiology. 1986;161(2):401–7. doi: 10.1148/radiology.161.2.3763909. [DOI] [PubMed] [Google Scholar]
- 85.Szafer A, Zhong J, Gore JC. Theoretical model for water diffusion in tissues. Magn Reson Med. 1995;33(5):697–712. doi: 10.1002/mrm.1910330516. [DOI] [PubMed] [Google Scholar]
- 86.Jacobs MA, Ouwerkerk R, Wolff AC, Stearns V, Bottomley PA, Barker PB, Argani P, Khouri N, Davidson NE, Bhujwalla ZM, Bluemke DA. Multiparametric and multinuclear magnetic resonance imaging of human breast cancer: current applications. Technol Cancer Res Treat. 2004;3(6):543–50. doi: 10.1177/153303460400300603. [DOI] [PubMed] [Google Scholar]
- 87.Kamel IR, Bluemke DA, Eng J, Liapi E, Messersmith W, Reyes DK, Geschwind JF. The role of functional MR imaging in the assessment of tumor response after chemoembolization in patients with hepatocellular carcinoma. J Vasc Interv Radiol. 2006;17(3):505–12. doi: 10.1097/01.RVI.0000200052.02183.92. [DOI] [PubMed] [Google Scholar]
- 88.Hosseinzadeh K, Schwarz SD. Endorectal diffusion-weighted imaging in prostate cancer to differentiate malignant and benign peripheral zone tissue. J Magn Reson Imaging. 2004;20(4):654–61. doi: 10.1002/jmri.20159. [DOI] [PubMed] [Google Scholar]
- 89.Herneth AM, Philipp MO, Naude J, Funovics M, Beichel RR, Bammer R, Imhof H. Vertebral metastases: assessment with apparent diffusion coefficient. Radiology. 2002;225(3):889–94. doi: 10.1148/radiol.2253011707. [DOI] [PubMed] [Google Scholar]
- 90.Knight RA, Ordidge RJ, Helpern JA, Chopp M, Rodolosi LC, Peck D. Temporal evolution of ischemic damage in rat brain measured by proton nuclear magnetic resonance imaging. Stroke. 1991;22(6):802–8. doi: 10.1161/01.str.22.6.802. [DOI] [PubMed] [Google Scholar]
- 91.Le Bihan DJ. Differentiation of benign versus pathologic compression fractures with diffusion-weighted MR imaging: a closer step toward the “holy grail” of tissue characterization? Radiology. 1998;207(2):305–7. doi: 10.1148/radiology.207.2.9577472. [DOI] [PubMed] [Google Scholar]
- 92.Zelhof B, Lowry M, Rodrigues G, Kraus S, Turnbull L. Description of magnetic resonance imaging-derived enhancement variables in pathologically confirmed prostate cancer and normal peripheral zone regions. BJU Int. 2009;104(5):621–7. doi: 10.1111/j.1464-410X.2009.08457.x. [DOI] [PubMed] [Google Scholar]
- 93.Brunberg JA, Chenevert TL, McKeever PE, Ross DA, Junck LR, Muraszko KM, Dauser R, Pipe JG, Betley AT. In vivo MR determination of water diffusion coefficients and diffusion anisotropy: correlation with structural alteration in gliomas of the cerebral hemispheres. AJNR Am J Neuroradiol. 1995;16(2):361–71. [PMC free article] [PubMed] [Google Scholar]
- 94.Stejskal EOT, Spin JE. Diffusion Measurements: Spin Echoes in the Presence of a Time-Dependent Field Gradient. Journal of Chemical Physics. 1965;42:5. [Google Scholar]
- 95.Norris DG, Bornert P, Reese T, Leibfritz D. On the application of ultrafast RARE experiments. Magn Reson Med. 1992;27(1):142–64. doi: 10.1002/mrm.1910270114. [DOI] [PubMed] [Google Scholar]
- 96.Dietrich O, R.J., Sommer J, Deimling M, Reiser MF, Baur-Melnyk A. Diffusion-weighted MRI of musculoskeletal soft-tissue tumors using a RARE-based signle-shot pulse sequence. Annual Meeting of International Society of Magnetic Resonance in Medicine; Miami, USA. 2005. [Google Scholar]
- 97.Dietrich O, Raya JG, Sommer J, Deimling M, Reiser MF, Baur-Melnyk A. A comparative evaluation of a RARE-based single-shot pulse sequence for diffusion-weighted MRI of musculoskeletal soft-tissue tumors. Eur Radiol. 2005;15(4):772–83. doi: 10.1007/s00330-004-2619-3. [DOI] [PubMed] [Google Scholar]
- 98.Deng J, Miller FH, Salem R, Omary RA, Larson AC. Multishot diffusion-weighted PROPELLER magnetic resonance imaging of the abdomen. Invest Radiol. 2006;41(10):769–75. doi: 10.1097/01.rli.0000236808.84746.95. [DOI] [PubMed] [Google Scholar]
- 99.Deng J, Virmani S, Young J, Harris K, Yang GY, Rademaker A, Woloschak G, Omary RA, Larson AC. Diffusion-weighted PROPELLER MRI for quantitative assessment of liver tumor necrotic fraction and viable tumor volume in VX2 rabbits. J Magn Reson Imaging. 2008;27(5):1069–76. doi: 10.1002/jmri.21327. [DOI] [PMC free article] [PubMed] [Google Scholar]
- 100.Dudeck O, Zeile M, Pink D, Pech M, Tunn PU, Reichardt P, Ludwig WD, Hamm B. Diffusion-weighted magnetic resonance imaging allows monitoring of anticancer treatment effects in patients with soft-tissue sarcomas. J Magn Reson Imaging. 2008;27(5):1109–13. doi: 10.1002/jmri.21358. [DOI] [PubMed] [Google Scholar]
- 101.Uhl M, Saueressig U, van Buiren M, Kontny U, Niemeyer C, Kohler G, Ilyasov K, Langer M. Osteosarcoma: preliminary results of in vivo assessment of tumor necrosis after chemotherapy with diffusion- and perfusion-weighted magnetic resonance imaging. Invest Radiol. 2006;41(8):618–23. doi: 10.1097/01.rli.0000225398.17315.68. [DOI] [PubMed] [Google Scholar]
- 102.Bley TA, Wieben O, Uhl M. Diffusion-weighted MR imaging in musculoskeletal radiology: applications in trauma, tumors, and inflammation. Magn Reson Imaging Clin N Am. 2009;17(2):263–75. doi: 10.1016/j.mric.2009.01.005. [DOI] [PubMed] [Google Scholar]
- 103.Oka K, Yakushiji T, Sato H, Hirai T, Yamashita Y, Mizuta H. The value of diffusion-weighted imaging for monitoring the chemotherapeutic response of osteosarcoma: a comparison between average apparent diffusion coefficient and minimum apparent diffusion coefficient. Skeletal Radiol. 2010;39(2):141–6. doi: 10.1007/s00256-009-0830-7. [DOI] [PubMed] [Google Scholar]
- 104.Yoshida S, Koga F, Kawakami S, Ishii C, Tanaka H, Numao N, Sakai Y, Saito K, Masuda H, Fujii Y, Kihara K. Initial experience of diffusion-weighted magnetic resonance imaging to assess therapeutic response to induction chemoradiotherapy against muscle-invasive bladder cancer. Urology. 2010;75(2):387–91. doi: 10.1016/j.urology.2009.06.111. [DOI] [PubMed] [Google Scholar]
- 105.Oka K, Yakushiji T, Sato H, Yorimitsu S, Hayashida Y, Yamashita Y, Mizuta H. Ability of diffusion-weighted imaging for the differential diagnosis between chronic expanding hematomas and malignant soft tissue tumors. J Magn Reson Imaging. 2008;28(5):1195–200. doi: 10.1002/jmri.21512. [DOI] [PubMed] [Google Scholar]
- 106.Song SK, Qu Z, Garabedian EM, Gordon JI, Milbrandt J, Ackerman JJ. Improved magnetic resonance imaging detection of prostate cancer in a transgenic mouse model. Cancer Res. 2002;62(5):1555–8. [PubMed] [Google Scholar]
- 107.Alibek S, Cavallaro A, Aplas A, Uder M, Staatz G. Diffusion weighted imaging of pediatric and adolescent malignancies with regard to detection and delineation: initial experience. Acad Radiol. 2009;16(7):866–71. doi: 10.1016/j.acra.2009.01.004. [DOI] [PubMed] [Google Scholar]
- 108.Wang CK, Li CW, Hsieh TJ, Chien SH, Liu GC, Tsai KB. Characterization of bone and soft-tissue tumors with in vivo 1H MR spectroscopy: initial results. Radiology. 2004;232(2):599–605. doi: 10.1148/radiol.2322031441. [DOI] [PubMed] [Google Scholar]
- 109.Hsieh TJ, L.C., Chuang HY, Liu GC, Wang CK. Longitudinally monitoring chemotherapy effect of malignant musculoskeletal tumors with in vivo proton magnetic resonance spectroscopy: an initial experience. Journal of computer assisted tomography. 2008;32:8. doi: 10.1097/RCT.0b013e31815b9ce9. [DOI] [PubMed] [Google Scholar]
- 110.Bottomley PA. Spatial localization in NMR spectroscopy in vivo. Ann N Y Acad Sci. 1987;508:333–48. doi: 10.1111/j.1749-6632.1987.tb32915.x. [DOI] [PubMed] [Google Scholar]
- 111.Frahm J, Merboldt K-D, Haenicke W. Localized proton spectroscopy using stimulated echoes. Journal of Magnetic resonance. 1987;72:502–508. doi: 10.1002/mrm.1910170113. [DOI] [PubMed] [Google Scholar]
- 112.Moonen CT, von Kienlin M, van Zijl PC, Cohen J, Gillen J, Daly P, Wolf G. Comparison of single-shot localization methods (STEAM and PRESS) for in vivo proton NMR spectroscopy. NMR Biomed. 1989;2(5-6):201–8. doi: 10.1002/nbm.1940020506. [DOI] [PubMed] [Google Scholar]
- 113.Kassem MN, Bartha R. Quantitative proton short-echo-time LASER spectroscopy of normal human white matter and hippocampus at 4 Tesla incorporating macromolecule subtraction. Magn Reson Med. 2003;49(5):918–27. doi: 10.1002/mrm.10443. [DOI] [PubMed] [Google Scholar]
- 114.Garwood M, DelaBarre L. The return of the frequency sweep: designing adiabatic pulses for contemporary NMR. J Magn Reson. 2001;153(2):155–77. doi: 10.1006/jmre.2001.2340. [DOI] [PubMed] [Google Scholar]
- 115.Qi ZH, Li CF, Li ZF, Zhang K, Wang Q, Yu DX. Preliminary study of 3T 1H MR spectroscopy in bone and soft tissue tumors. Chin Med J (Engl) 2009;122(1):39–43. [PubMed] [Google Scholar]
- 116.de Graaf RA. In Vivo NMR Spectroscopy: Principles and Techniques. John Wiley & Sons Ltd.; West Sussex, England: 2007. p. 445. [Google Scholar]
- 117.de Graaf RA. In Vivo NMR Spectroscopy: Principles and Techniques. John Wiley & Sons Ltd.; West Sussex, England: 2007. p. 111. [Google Scholar]
- 118.Ernst T, Kreis R, Ross BD. Absolute quantitation of water and metabolites in the human brain. I. compartments and water. (series B).Journal of magnetic resonance. 1993;102:8. [Google Scholar]
- 119.Boesch C. Musculoskeletal spectroscopy. J Magn Reson Imaging. 2007;25(2):321–38. doi: 10.1002/jmri.20806. [DOI] [PubMed] [Google Scholar]
- 120.Machann J, Stefan N, Schick F. (1)H MR spectroscopy of skeletal muscle, liver and bone marrow. Eur J Radiol. 2008;67(2):275–84. doi: 10.1016/j.ejrad.2008.02.032. [DOI] [PubMed] [Google Scholar]
- 121.Boesch C, Machann J, Vermathen P, Schick F. Role of proton MR for the study of muscle lipid metabolism. NMR Biomed. 2006;19(7):968–88. doi: 10.1002/nbm.1096. [DOI] [PubMed] [Google Scholar]
- 122.Shen W, Mao X, Wolper C, Heshka S, Dashnaw S, Hirsch J, Heymsfield SB, Shungu DC. Reproducibility of single- and multi-voxel 1H MRS measurements of intramyocellular lipid in overweight and lean subjects under conditions of controlled dietary calorie and fat intake. NMR Biomed. 2008;21(5):498–506. doi: 10.1002/nbm.1218. [DOI] [PMC free article] [PubMed] [Google Scholar]
- 123.Ackerstaff E, Glunde K, Bhujwalla ZM. Choline phospholipid metabolism: a target in cancer cells? J Cell Biochem. 2003;90(3):525–33. doi: 10.1002/jcb.10659. [DOI] [PubMed] [Google Scholar]
- 124.Negendank W. Studies of human tumors by MRS: a review. NMR Biomed. 1992;5(5):303–24. doi: 10.1002/nbm.1940050518. [DOI] [PubMed] [Google Scholar]
- 125.Podo F. Tumour phospholipid metabolism. NMR Biomed. 1999;12(7):413–39. doi: 10.1002/(sici)1099-1492(199911)12:7<413::aid-nbm587>3.0.co;2-u. [DOI] [PubMed] [Google Scholar]
- 126.Ronen SM, Leach MO. Imaging biochemistry: applications to breast cancer. Breast Cancer Res. 2001;3(1):36–40. doi: 10.1186/bcr268. [DOI] [PMC free article] [PubMed] [Google Scholar]
- 127.Ackerstaff E, Pflug BR, Nelson JB, Bhujwalla ZM. Detection of increased choline compounds with proton nuclear magnetic resonance spectroscopy subsequent to malignant transformation of human prostatic epithelial cells. Cancer Res. 2001;61(9):3599–603. [PubMed] [Google Scholar]
- 128.Madhu B, Waterton JC, Griffiths JR, Ryan AJ, Robinson SP. The response of RIF-1 fibrosarcomas to the vascular-disrupting agent ZD6126 assessed by in vivo and ex vivo 1H magnetic resonance spectroscopy. Neoplasia. 2006;8(7):560–7. doi: 10.1593/neo.06319. [DOI] [PMC free article] [PubMed] [Google Scholar]
- 129.Baek HM, Chen JH, Nie K, Yu HJ, Bahri S, Mehta RS, Nalcioglu O, Su MY. Predicting pathologic response to neoadjuvant chemotherapy in breast cancer by using MR imaging and quantitative 1H MR spectroscopy. Radiology. 2009;251(3):653–62. doi: 10.1148/radiol.2512080553. [DOI] [PMC free article] [PubMed] [Google Scholar]
- 130.Alexander A, Murtha A, Abdulkarim B, Mehta V, Wheatley M, Murray B, Riauka T, Hanson J, Fulton D, McEwan A, Roa W. Prognostic significance of serial magnetic resonance spectroscopies over the course of radiation therapy for patients with malignant glioma. Clin Invest Med. 2006;29(5):301–11. [PubMed] [Google Scholar]
- 131.Glunde K, Jacobs MA, Bhujwalla ZM. Choline metabolism in cancer: implications for diagnosis and therapy. Expert Rev Mol Diagn. 2006;6(6):821–9. doi: 10.1586/14737159.6.6.821. [DOI] [PubMed] [Google Scholar]
- 132.Glunde K, Serkova NJ. Therapeutic targets and biomarkers identified in cancer choline phospholipid metabolism. Pharmacogenomics. 2006;7(7):1109–23. doi: 10.2217/14622416.7.7.1109. [DOI] [PubMed] [Google Scholar]
- 133.Ottaiano A, De Chiara A, Fazioli F, Talamanca AA, Mori S, Botti G, Milano A, Apice G. Biological prognostic factors in adult soft tissue sarcomas. Anticancer Res. 2005;25(6C):4519–26. [PubMed] [Google Scholar]
- 134.Borden EC, Baker LH, Bell RS, Bramwell V, Demetri GD, Eisenberg BL, Fletcher CD, Fletcher JA, Ladanyi M, Meltzer P, O’Sullivan B, Parkinson DR, Pisters PW, Saxman S, Singer S, Sundaram M, van Oosterom AT, Verweij J, Waalen J, Weiss SW, Brennan MF. Soft tissue sarcomas of adults: state of the translational science. Clin Cancer Res. 2003;9(6):1941–56. [PubMed] [Google Scholar]
- 135.Moller HE, Vermathen P, Rummeny E, Wortler K, Wuisman P, Rossner A, Wormann B, Ritter J, Peters PE. In vivo 31P NMR spectroscopy of human musculoskeletal tumors as a measure of response to chemotherapy. NMR Biomed. 1996;9(8):347–58. doi: 10.1002/(SICI)1099-1492(199612)9:8<347::AID-NBM431>3.0.CO;2-3. [DOI] [PubMed] [Google Scholar]
- 136.Griffiths JR. Are cancer cells acidic? Br J Cancer. 1991;64(3):425–7. doi: 10.1038/bjc.1991.326. [DOI] [PMC free article] [PubMed] [Google Scholar]
- 137.Gillies RJ, Liu Z, Bhujwalla Z. 31P-MRS measurements of extracellular pH of tumors using 3-aminopropylphosphonate. Am J Physiol. 1994;267(1 Pt 1):C195–203. doi: 10.1152/ajpcell.1994.267.1.C195. [DOI] [PubMed] [Google Scholar]
- 138.Arias-Mendoza F, Brown TR. In Vivo Phosphorus MR Spectroscopy Demonstrates the Heterogeneous Composition of Sarcomas. Annual Meeting of the International Society of Magnetic Resonance in Medicine; Montreal, Canada. 2011. [Google Scholar]
- 139.Ojugo AS, McSheehy PM, McIntyre DJ, McCoy C, Stubbs M, Leach MO, Judson IR, Griffiths JR. Measurement of the extracellular pH of solid tumours in mice by magnetic resonance spectroscopy: a comparison of exogenous (19)F and (31)P probes. NMR Biomed. 1999;12(8):495–504. doi: 10.1002/(sici)1099-1492(199912)12:8<495::aid-nbm594>3.0.co;2-k. [DOI] [PubMed] [Google Scholar]
- 140.Gillies RJ, Raghunand N, Garcia-Martin ML, Gatenby RA. pH imaging. A review of pH measurement methods and applications in cancers. IEEE Eng Med Biol Mag. 2004;23(5):57–64. doi: 10.1109/memb.2004.1360409. [DOI] [PubMed] [Google Scholar]
- 141.Kettelhack C, Wickede M, Vogl T, Schneider U, Hohenberger P. 31Phosphorus-magnetic resonance spectroscopy to assess histologic tumor response noninvasively after isolated limb perfusion for soft tissue tumors. Cancer. 2002;94(5):1557–64. doi: 10.1002/cncr.10361. [DOI] [PubMed] [Google Scholar]
- 142.Stegman LD, Rehemtulla A, Beattie B, Kievit E, Lawrence TS, Blasberg RG, Tjuvajev JG, Ross BD. Noninvasive quantitation of cytosine deaminase transgene expression in human tumor xenografts with in vivo magnetic resonance spectroscopy. Proc Natl Acad Sci U S A. 1999;96(17):9821–6. doi: 10.1073/pnas.96.17.9821. [DOI] [PMC free article] [PubMed] [Google Scholar]
- 143.Seddon BM, Payne GS, Simmons L, Ruddle R, Grimshaw R, Tan S, Turner A, Raynaud F, Halbert G, Leach MO, Judson I, Workman P. A phase I study of SR-4554 via intravenous administration for noninvasive investigation of tumor hypoxia by magnetic resonance spectroscopy in patients with malignancy. Clin Cancer Res. 2003;9(14):5101–12. [PubMed] [Google Scholar]
- 144.Ballinger JR. Imaging hypoxia in tumors. Semin Nucl Med. 2001;31(4):321–9. doi: 10.1053/snuc.2001.26191. [DOI] [PubMed] [Google Scholar]
- 145.Padhani A. Science to practice: what does MR oxygenation imaging tell us about human breast cancer hypoxia? Radiology. 2010;254(1):1–3. doi: 10.1148/radiol.091669. [DOI] [PubMed] [Google Scholar]
- 146.Nitz WR, Reimer P. Contrast mechanisms in MR imaging. Eur Radiol. 1999;9(6):1032–46. doi: 10.1007/s003300050789. [DOI] [PubMed] [Google Scholar]
- 147.Robinson SP, Howe FA, Rodrigues LM, Stubbs M, Griffiths JR. Magnetic resonance imaging techniques for monitoring changes in tumor oxygenation and blood flow. Semin Radiat Oncol. 1998;8(3):197–207. doi: 10.1016/s1053-4296(98)80045-3. [DOI] [PubMed] [Google Scholar]
- 148.Ratner AV, Muller HH, Bradley-Simpson B, Johnson DE, Hurd RE, Sotak C, Young SW. Detection of tumors with 19F magnetic resonance imaging. Invest Radiol. 1988;23(5):361–4. doi: 10.1097/00004424-198805000-00006. [DOI] [PubMed] [Google Scholar]
- 149.Matsumoto S, Yasui H, Batra S, Kinoshita Y, Bernardo M, Munasinghe JP, Utsumi H, Choudhuri R, Devasahayam N, Subramanian S, Mitchell JB, Krishna MC. Simultaneous imaging of tumor oxygenation and microvascular permeability using Overhauser enhanced MRI. Proc Natl Acad Sci U S A. 2009;106(42):17898–903. doi: 10.1073/pnas.0908447106. [DOI] [PMC free article] [PubMed] [Google Scholar]
- 150.Lauenstein TC, Goehde SC, Herborn CU, Goyen M, Oberhoff C, Debatin JF, Ruehm SG, Barkhausen J. Whole-body MR imaging: evaluation of patients for metastases. Radiology. 2004;233(1):139–48. doi: 10.1148/radiol.2331030777. [DOI] [PubMed] [Google Scholar]
- 151.Ohno Y, Koyama H, Onishi Y, Takenaka D, Nogami M, Yoshikawa T, Matsumoto S, Kotani Y, Sugimura K. Non-small cell lung cancer: whole-body MR examination for M-stage assessment--utility for whole-body diffusion-weighted imaging compared with integrated FDG PET/CT. Radiology. 2008;248(2):643–54. doi: 10.1148/radiol.2482072039. [DOI] [PubMed] [Google Scholar]
- 152.Takahara T, Imai Y, Yamashita T, Yasuda S, Nasu S, Van Cauteren M. Diffusion weighted whole body imaging with background body signal suppression (DWIBS): technical improvement using free breathing, STIR and high resolution 3D display. Radiat Med. 2004;22(4):275–82. [PubMed] [Google Scholar]
- 153.Duewell SH, Ceckler TL, Ong K, Wen H, Jaffer FA, Chesnick SA, Balaban RS. Musculoskeletal MR imaging at 4 T and at 1.5 T: comparison of relaxation times and image contrast. Radiology. 1995;196(2):551–5. doi: 10.1148/radiology.196.2.7617876. [DOI] [PubMed] [Google Scholar]
- 154.Gold GE, Han E, Stainsby J, Wright G, Brittain J, Beaulieu C. Musculoskeletal MRI at 3.0 T: relaxation times and image contrast. AJR Am J Roentgenol. 2004;183(2):343–51. doi: 10.2214/ajr.183.2.1830343. [DOI] [PubMed] [Google Scholar]
- 155.Gold GE, Suh B, Sawyer-Glover A, Beaulieu C. Musculoskeletal MRI at 3.0 T: initial clinical experience. AJR Am J Roentgenol. 2004;183(5):1479–86. doi: 10.2214/ajr.183.5.1831479. [DOI] [PubMed] [Google Scholar]
- 156.Saupe N, Prussmann KP, Luechinger R, Bosiger P, Marincek B, Weishaupt D. MR imaging of the wrist: comparison between 1.5- and 3-T MR imaging--preliminary experience. Radiology. 2005;234(1):256–64. doi: 10.1148/radiol.2341031596. [DOI] [PubMed] [Google Scholar]