Abstract
Carriers of FMR1 premutation alleles have 55–200 CGG repeats in the 5’ untranslated region of the gene. These individuals are at risk for fragile X associated primary ovarian insufficiency (females) and, in late life, fragile X associated tremor and ataxia syndrome (males, and to a lesser extent, females). Premutation carrier status can also be associated with autism spectrum disorder, attention deficit hyperactivity disorder, and some cognitive deficits. In premutation carriers, FMR1 mRNA levels are often higher than in those with normal sized alleles. In contrast, in subjects with full mutation alleles, (>200 repeats) the FMR1 gene is silenced and FMR1 mRNA and its product, FMRP, are absent. We have studied a male knock-in (KI) mouse model of the fragile X premutation (120–140 repeats) during young adulthood. In comparison to wild type, KI mice were hyperactive, exhibited less anxiety in both the open field and the elevated zero maze, were impaired on the passive avoidance test, and showed some subtle deficits on a test of social interaction. Motor learning as assessed by the rotarod test was normal. Dendritic arbors were less complex and spine densities and lengths increased in medial prefrontal cortex, basal lateral amygdala, and hippocampus compared with wild type. Regional rates of cerebral protein synthesis measured in vivo in KI mice were increased. KI mice also had elevated levels of Fmr1 mRNA and decreased levels of FMRP. Our results highlight similarities in phenotype between KI and Fmr1 knockout mice and suggest that the decreased concentration of FMRP contributes to the phenotype in young adult KI mice.
Keywords: Fragile X syndrome, fragile X premutation, FMRP, Fmr1, hyperactivity, anxiety, dendritic spine morphology, protein synthesis, social interaction
Introduction
The fragile X mental retardation gene (FMR1) on Xq27.3 contains a CGG repeat sequence in the 5’-untranslated region. In the normal population, the repeat sequence is 5–54 repeats in length (Fu et al., 1991). In individuals with repeat sequence lengths greater than 200, the gene is hypermethylated and transcription is silenced; these individuals lack the gene product, fragile X mental retardation protein (FMRP) and consequently have the full fragile X mutation (fragile X syndrome (FXS)) with its serious medical consequences including moderate to severe cognitive impairment (Verkerk et al., 1991). Individuals with CGG repeat sequences between 55 and 200 are known as fragile X premutation (FXPM) carriers. In these individuals the gene remains unmethylated and transcription is not silenced, but there is a high risk of expansion to a full mutation upon maternal transmission. FXPM alleles produce elevated levels of FMR1 mRNA which is thought to be toxic to neurons (Jin et al., 2003; Hessl et al, 2005; Brouwer et al, 2008a).
FXS phenotype in males includes cognitive impairments, behavioral dysfunction such as hyperactivity, social anxiety, attention problems, executive function impairments, and autistic-like behavior (Hagerman, 2002). In addition FXS includes some distinct physical phenotypes such as macroorchidism and facial dysmorphisms (Hagerman, 2002). These wide-ranging phenotypes are caused by the absence of FMRP, an RNA-binding protein that is involved in the regulation of translation in dendrites as well as neuronal cell bodies. One of the few neuropathological hallmarks of FXS is an abnormal morphology of spines located on dendrites; spines are long, thin and higher in density than normal (Hinton et al., 1991; Irwin et al., 2001). The prevalence of the full mutation allele is c. 1/4000 in males and 1/8000 in females (Crawford et al., 2001).
For many years it was thought that carriers of the FXPM allele were without a clinical phenotype, but reports over the past ten years indicate that elderly male FXPM carriers can develop a progressive neurodegenerative syndrome, fragile X associated tremor/ataxia syndrome, (Hagerman et al., 2001) and 20% of female FXPM carriers are at risk for developing fragile X associated primary ovarian insufficiency (Allingham-Hawkins et al., 1999). There is also accumulating evidence that FXPM carriers have a higher incidence of neuropsychological symptoms (Cornish et al., 2005; Cornish et al., 2009; Hessl et al., 2007; Hunter et al., 2008; Kogan et al., 2008; Loesch et al., 2003a; Loesch et al., 2003b) some of which may be milder variants of those seen in the full mutation. These features may relate to elevated levels of FMR1 mRNA and/or decreases in FMRP levels as measured in lymphocytes of FXPM carriers (Tassone et al., 2000b). Prevalence of FXPM in the general population is much higher than that of the fragile X full mutation, c. 1/800 males and 1/300 females. Consequently, FXPM may have a greater impact on the general population than FXS.
Research on the cellular and molecular causes of FXS has been bolstered by the development of a mouse model with a null mutation for Fmr1 (Fmr1 KO) (The Dutch-Belgian Fragile et al., 1994). To better understand FXPM, two expanded CGG-repeat knock-in (KI) mouse models have been generated (Bontekoe et al., 2001; Entezam et al., 2007). In one, a region of the Fmr1 gene including the endogenous repeat tract (CGG)8 was replaced with a cloned human premutation allele (CGG)98 (Bontekoe et al., 2001). In the model used in the present study, the repeat tract was generated by serial ligation of short, stable CGG·CCG repeats (Entezam et al., 2007). Both models showed repeat instability upon transmission to succeeding generations, and a higher number of expansions with paternal transmission. Significant methylation of the Fmr1 promoter has not been found in either model even with repeat sizes well over 200. In both models, Fmr1 mRNA levels are increased in brain and FMRP levels are decreased. In both models ubiquitin-positive inclusions were found in neurons in older animals (Entezam et al., 2007; Willemsen et al., 2003). Whereas there may be subtle differences between them, both models demonstrate these essential characteristics. Studies of the behavioral phenotype of (CGG)98 KI mice have emphasized the development of a pathological phenotype with increasing age (Brouwer et al., 2008b; Hunsaker et al., 2009; Van Dam et al., 2005). There have been no studies of dendrite morphology in these models. The aim of the current study is to systematically characterize young, adult, male, (CGG·CCG)n KI mice with respect to behavior, dendrite morphology, and regional rates of cerebral protein synthesis (rCPS).
Materials and methods
Animals
FXPM KI [(CGG·CCG)n] mice were generated as previously described (Entezam et al., 2007) with the neomycin gene removed by crossing these animals to mice expressing CRE recombinase under the control of the MMTV promoter. The genetic background was C57BL/6. Briefly, WT and KI mice were produced by pairing female mice heterozygous for the KI allele with WT males. This strategy yielded both WT and KI male mice in the same litters. Mice were group housed in a central facility and maintained under controlled conditions of normal humidity and temperature with standard alternating 12-hr periods of light and darkness. All procedures were carried out in accordance with the National Institutes of Health Guidelines on the Care and Use of Animals and an animal study protocol approved by the National Institute of Mental Health Animal Care and Use Committee.
Determination of repeat size
Genomic DNA was prepared from mouse tail extracts as previously described (Entezam et al., 2007). The primer pair, frax-c and frax-f (Fu et al., 1991), was used to detect both WT Fmr1 and FXPM alleles. The size of the CGG•CCG-repeat tract was monitored by polymerase chain reaction (PCR) with primers frax-m5 (5’-CGGGGGGCGTGCGGTAACGGCCCAA-3’) and 6-carboxyfluorescein- or 4,7,2′,4′,5′,7′-hexachloro-6-carboxyfluorescein-labeled frax-m4 (5’-CTTGAGGCCCAGCCGCCGTCGGCC-3’). The binding sites for these primers are located immediately adjacent to the repeat tract and their 3’ ends are unique to the KI allele. The reaction products were then run on a 3130XL Genetic Analyzer and analyzed using GeneMapper® 3.7 (Applied Biosystems, Foster City, CA). Results were confirmed where necessary by Southern blotting. PCR across long repeats typically produces multiple bands and the size of each allele was calculated based on the mobility of the central band in the cluster.
Behavioral tests
From 7 to 16 weeks of age, male mice were subjected to a battery of behavioral tests carried out in the following order with a one-week interval between tests: open field (7–9 weeks), social interaction (8–10 weeks), elevated zero maze (10–13 weeks), rotarod (11–13 weeks), and passive avoidance (13–16 weeks).
Open field test
Locomotor activity was evaluated in WT (55 ± 8 days of age, n=27) and KI (56 ± 9 days of age, n=28) mice by placing mice in an open field consisting of a clear Plexiglas box (40 × 40 × 30 cm) with a black floor in standard room light. Activity was detected by a computer-operated tracking system of 16 photo beams per side (TruScan System, Coulbourn Instruments, Allentown, PA) and recorded over 6-min intervals for 30 min. Total horizontal distance moved, center distance (area >6.25cm from walls), margin distance, and center entries were measured. The center distance, center entries, and margin/total distance can be used as indices of anxiety-related responses.
Elevated plus maze and elevated zero maze tests
We assessed generalized anxiety by means of the elevated plus maze (EPM) and elevated zero maze (EZM) (Shepherd et al., 1994) tests. These tests are based on a natural tendency of mice to actively explore a new environment. The EPM equipment consisted of two opposing open arms (30 × 5 cm) and two opposing closed arms (30 × 5 cm) surrounded by 15 cm high walls elevated 50 cm above the floor. The four arms converged into a central platform (10 × 10 cm). Each WT (59 ± 2 days of age, n=25) and KI (61 ± 2 days of age, n=26) mouse was placed in the center of the apparatus facing an open arm. The time spent in the dark and open arms and the numbers of entrances into dark or open arms were recorded for 5 min. We defined an arm entry as the mouse having his head and forepaws in the arm. The EZM apparatus consisted of a raised circular track divided equally into two open and two closed quadrants with an internal diameter of 45 cm, a width of 7.0 cm. The track was 64.5 cm above the floor, and the walls of closed quadrants were 20.5 cm high. WT (90 ± 7 days of age, n=11) and KI (80 ± 4 days of age, n=8) mice were placed in the center of an open quadrant and allowed to explore the maze freely for 5 min while behavior was recorded by a video camera mounted overhead. Time spent in open and closed quadrants were analyzed by means of the automated behavioral analysis software (MED Associates Inc, St. Albans, Vermont).
Test of social interaction
We tested WT (65 ± 9 days of age, n=20) and KI (68 ± 9 days of age, n=20) mice for social interaction in an automated three-chambered social approach apparatus (Nadler et al., 2004) as previously described (Liu et al., 2010). Briefly, the test had three phases. (A) Habituation. With the doorways into the two side chambers open, the test mouse was placed in the center chamber and allowed to freely explore the entire social test box for 5 min. The amount of time spent in each chamber and the number of entries into each side chamber were recorded by the automated testing system. Mice that spent three or more min in any one chamber were eliminated from the study. (B) Social approach. After the habituation phase, the test mouse was confined to the center chamber with the doors closed, and an unfamiliar mouse (Stranger-1) was placed inside the inverted wire cup in one of the side chambers. The doors were opened, and the subject was allowed to explore freely for 5 min. In addition to the automatically recorded amount of time spent in each chamber and the number of entries, an observer simultaneously scored time spent sniffing the stranger mouse or the empty wire cup (sniffing within 1 cm of the wire cup). (C) Preference for social novelty. At the end of the 5-min social approach test, the subject was confined to the center chamber with the doors closed again. With the Stranger-1 mouse remaining in its original wire cup, a new unfamiliar mouse (Stranger-2) was placed inside the inverted wire cup in the opposite chamber, which was empty during the social approach phase. The doors were re-opened and the subject was allowed to explore for 5 min. Measures were taken as described above.
Rotarod and passive avoidance tests
We tested animals for acquisition of a motor skill on the rotarod test and for an aversive form of learning on the passive avoidance test. Coordination and motor skill acquisition were assessed by means of an accelerated rotating rod (Type 0207-003M, Columbus Instruments, Columbus, OH) in WT (89 ± 6 days of age, n=11) and KI (85 ± 3 days of age, n=9) mice. Mice underwent test trials (four trials per day for four days). Each day for the first 30 sec, mice were placed on a stationary rod (3 cm diameter). Mice were then habituated to the rod rotating at a constant speed of 5 rpm for 15 sec. Then the speed of rotation accelerated linearly 0.1 rpm per sec until the mouse fell off. The latency to fall off the accelerating rod was recorded. We also tested learning and memory by means of the passive avoidance test in WT (86 ± 4 days of age, n=15) and KI (95 ± 5 days of age, n=17) mice. The apparatus used was two chambered: one lighted and one dark separated by an automated guillotine door (Coulbourn Instruments, Allentown, PA). The procedure included one-trial training and one test session 24 h later. On training day each mouse was placed in the lighted compartment and after 10 sec the guillotine door was raised and the mouse was given access to the dark compartment. Upon entrance into the dark compartment, the guillotine door was closed and an electric shock (0.3 mA for 1 sec) administered. The mouse was removed from the apparatus after 10 sec and returned to its home cage. Mice that did not enter the dark compartment within 60 sec were eliminated from the study. After 24 h, each animal was placed in the lighted compartment and the latency to enter the dark compartment was recorded up to a maximum of 300 sec.
Morphological analysis of Golgi-Cox-stained dendrites and dentritic spines
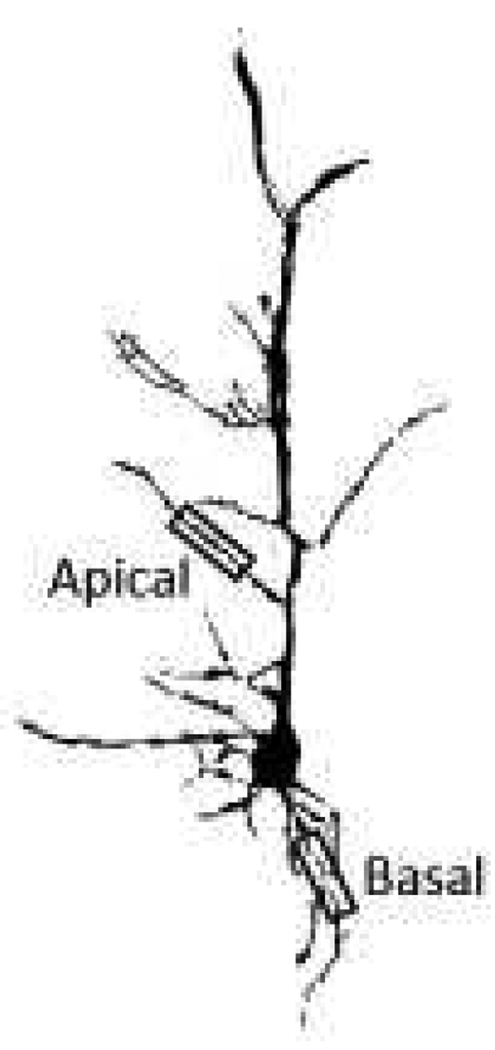
One week after the passive avoidance test, mice (9 of each genotype) were deeply anesthetized with sodium pentobarbital (100 mg/kg, ip) and perfused transcardially with normal saline. Brains were removed and Golgi-impregnated with the Rapid GolgiStain™ Kit according to the manufacturer’s protocol (FD NeuroTechnologies, Ellicott City, MD). Tissue blocks containing amygdala and medial prefrontal cortex were separated from one hemisphere and coronal sections 100 µm in thickness were prepared. The other hemisphere was sectioned sagittally for the dorsal hippocampus. Neurons which satisfied the following criteria were selected for analysis: (i) cell type was identifiable; (ii) neurons were dark and consistently silver impregnated along the entire extent of all dendrites; (iii) dendrites were not truncated; and (iv) stained neurons were relatively isolated from neighboring impregnated neurons to avoid interfering with analysis. Pyramidal neurons from CA3 of dorsal hippocampus and layer III of medial prefrontal cortex (infralimbic and prelimbic), and two major classes of neurons (pyramidal-like and stellate) from the basolateral complex of the amygdala were selected for quantification. Dendritic branches originating from cell soma were classified as primary dendrites, and those originating from primary dendrites were classified as secondary dendrites. For dendritic branching analysis we analyzed 45–50 neurons per region. We used the Sholl Analysis to quantify branch intersections (NIH Image J). The number and the lengths of spines in 50 µm segments of secondary apical and basal dendrites were determined (NIH Image J). For primary basal dendrites, segments were sampled beginning 25 µm from the soma; for secondary apical dendrites, dendrites were located 25–50 µm above the soma and segments were sampled beginning 25 µm from the apical trunk (Fig.1). We selected 30 neurons per region for spine analyses on apical and basal dendrites.
Fig. 1.
Reconstructed Golgi-stained neuron illustrating the sites on primary basal and secondary apical dendrites sampled for spine analyses.
Regional rates of cerebral protein synthesis (rCPS)
We used the autoradiographic L-[1-14C]leucine method to determine rCPS in WT (133 ± 2 days of age, n=8) and KI (133 ± 2 days of age, n=8) mice as described previously (Qin et al., 2005). Briefly, mice under light isoflurane anesthesia were prepared for studies by insertion of polyethylene catheters into a femoral artery and vein. Mice recovered from the surgery overnight and food and water were available ad libitum. Mice were permitted to move freely throughout the recovery and experimental periods. The experimental period was initiated by an intravenous pulse injection of 100 µCi/kg of L-[1-14C]leucine (specific activity, 60 mCi/mmol, Du Pont-NEN, Wilmington, DE). Timed arterial samples were collected during the following 60 min for determination of the time courses of plasma concentrations of leucine and [14C]leucine. Labeled and unlabeled leucine concentrations in the acid-soluble fractions of arterial plasma were assayed by liquid scintillation counting and amino acid analysis, respectively. At the end of the experimental interval, brains were removed, frozen, and serial sections, 20 µm in thickness, were prepared for quantitative autoradiography. Autoradiograms were digitized (MCID Analysis, Interfocus Imaging Ltd, Linton, Cambridge, UK), the concentration of 14C in each region of interest was determined, and rCPS was calculated by means of the operational equation of the method (Smith et al., 1988). The value of lambda in the equation was 0.603 (Qin et al., 2005). Brain regions were identified by reference to a mouse brain atlas (Paxinos & Franklin, 2001).
Western blotting and Fmr1 mRNA determinations
WT and KI mice (three months of age) were anesthetized with sodium pentobarbital (100 mg/kg, i.p.) and decapitated, and brains were frozen in dry ice. The cerebellum was dissected and eleven brain regions were punched by means of Harris Uni-Core (1.25 mm) (Electron Microscopy Sciences, Hatfield, PA) in a Leica cryostat (−22 °C) and homogenized in 1% (w/v) ice-cold T-PER tissue protein extraction reagent (Thermo Scientific, Rockford, IL) with 1% Halt protease inhibitor cocktail (Thermo Scientific) and 1% phosphatase inhibitor cocktail (Sigma-Aldrich, St. Louis, MO, USA). Homogenates were centrifuged (12,000 × g, 4°C, 15 min). The supernatant fractions were collected as protein samples, which were separated by NuPAGE on Bis–Tris gels and subjected to Western blotting with a WesternBreeze Chemiluminescent kit (Invitrogen, Carlsbad, CA). FMRP was detected with a rabbit polyclonal antibody to FMRP, ab17722 (Abcam Inc, Cambridge, MA). Protein from the brains of Fmr1 KO animals was used as a negative control. Blots were quantified by densitometry with MCID Analysis system. β-Actin was used as a loading control.
Brain regions were similarly prepared for mRNA extraction by immediate placement in RNAlater (Ambion, Austin, TX). Total RNA was prepared with TRIzol®Reagent (InVitrogen) according to the manufacturer’s instructions. RNA quality was assessed by means of an Agilent 2100 Bioanalyzer (Agilent Technologies, Carlsbad CA). We used SuperScript III (InVitrogen) according to the supplier’s instructions to perform reverse transcription. Quantitative PCR reactions were carried out with the 7900 HT Fast real Time PCR System and TaqMan Universal PCR Master Mix (Applied Biosystems, Foster City, CA). Levels of Fmr1 mRNA were assessed with a mouse Fmr1 primer/probe set (Taqman Gene Expression Assay Cat# Mm00484415) and compared with mouse GAPDH endogenous control supplied by Applied Biosystems. Reactions were performed in triplicate as previously described (Tassone et al., 2000a).
Immunohistochemistry
WT and KI mice at 3 months of age were deeply anesthetized with sodium pentobarbital (100 mg/kg, i.p.) and perfused as previously described (Hoffman et al., 1992). After perfusion each block was submerged in 30% aqueous sucrose for 3 days. Cryostat sections 30 µm in thickness were prepared, distributed sequentially into 12 tissue culture wells containing cryoprotectant solution, and stored at −20°C. Immunohistochemistry was performed with primary rabbit anti-FMRP (1:7500; Abcam Inc., Cambridge, MA, USA) for 1h at room temperature followed by 48h at 4°C, and incubation for 1 h at room temperature with biotinylated-secondary anti-rabbit IgG (1:600) (Vectastain ABC kit, CA, USA). The sections were then stained with Ni sulfate-DAB chromogen (Sigma-Aldrich, St. Louis, MO, USA).
Statistical analysis
Data are expressed as means ± SEM. Open field, social interaction, EPM and rotarod results were analyzed by repeated measures (RM) ANOVA. For the open field results genotype (WT, KI) and epoch were factors with RM on epoch. For the social interaction results genotype, condition (social approach, social novelty) and chamber (Chamber-1, Chamber-2) were factors with RM on condition and chamber. For EPM results genotype and arm (open, closed) were factors with RM on arm. For rotarod results genotype and trial were factors with RM on trial. Degrees of freedom were adjusted by means of the Huynh-Feldt Epsilon approach. Statistically significant interactions were further probed with post-hoc Bonferroni t-tests. Data from the EZM, passive avoidance test, Western blot, spine density, body weight, testes weight, and rCPS were analyzed for differences between WT and KI by one-tailed Student’s t-test. We used one-tailed tests because we had hypothesized that the phenotype of KI mice would be similar to the known phenotype of Fmr1 KO mice. Spine length distributions were compared by two-way Kruskal-Wallis followed by Kolmogorov-Smirnov tests. The criterion for statistical significance was P≤0.05.
Results
Physiology
The average repeat length for all of the 37 KI mice studied was 132 ± 1 (range 125–137). We measured physiological variables in a subset of mice at the time of measurement of rCPS (Table 1). WT and KI mice were well matched with respect to age, body weight and other physiological variables measured. Only testes weight differed between the two groups. In KI mice the average testes weight was 15% higher than WT (P<0.05). In our study of Fmr1 KO mice testes weight was 29% higher than WT (Qin et al., 2002).
Table 1.
Physiological variables in WT and KI mice at the time of measurement of rCPS. Values are means ± SEM for the number of mice indicated in parentheses.
| WT (8) |
KI (8) |
|
|---|---|---|
| Age (days) | 133 ± 2 | 133 ± 2 |
| Body weight (g) | 28.0 ± 1.1 | 28.0 ± 1.3 |
| Testes Weight (g) ^ | 0.197 ± 0.008 | 0.226 ± 0.010* |
| Arterial plasma glucose concentration (mmol/ml) | 8.0 ± 0.3 | 7.4 ± 0.2 |
| Arterial blood hematocrit (%) | 46 ± 1 | 46 ± 1 |
| Mean arterial blood pressure (mm Hg) | 122 ± 3 | 116 ± 3 |
| Repeat length | ND | 133 ± 1 |
Determined in separate groups of mice.
Statistically significantly different from WT, P<0.05, one-tail t-test.
Behavior
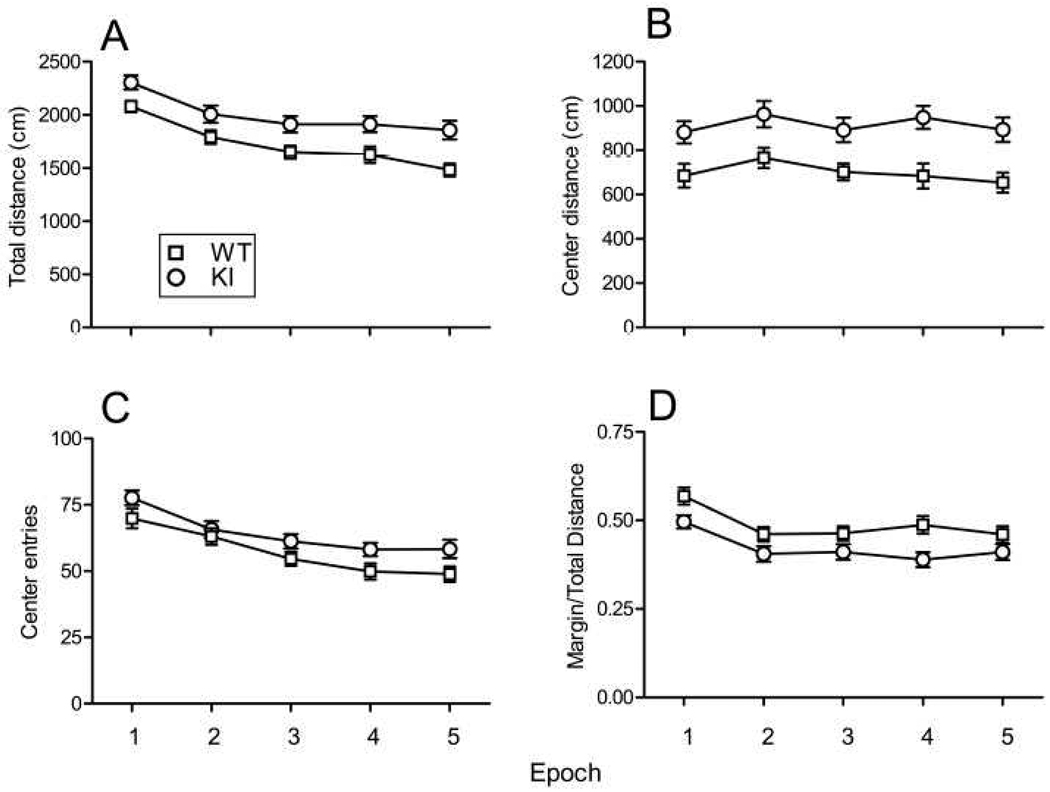
In the open field, the total horizontal distance traveled per 6-min epoch gradually decreased during the 30 min session in both groups (Fig. 2A) indicating that both genotypes habituated to the new environment. The interaction between genotype and epoch was not statistically significant, indicating that habituation was similar for both genotypes. Main effects of both epoch and genotype were statistically significant. The time × distance curve of KI mice was consistently higher than that of WT indicating hyperactivity of KI mice. As an indicator of the level of general anxiety, we analyzed the distance traveled in the center of the field (Fig. 2B), the number of center entries (Fig. 2C), and the fraction of the distance traveled in the margins of the field (Fig. 2D). The interaction between epoch and genotype was not statistically significant for any of the variables indicating that mice of both genotypes responded similarly over time. For center distance traveled, the main effect of epoch was not statistically significant but the effect of genotype was. The epoch × center distance curve was higher for the KI mice consistent with hyperactivity and less anxiety than WT. For the number of center entries, main effects of both epoch and genotype were statistically significant. Center entries tended to decrease over the five epochs and were higher in the KI mice at all time points consistent with hyperactivity and lower anxiety in KI mice. The fraction of distance moved in the margins of the field decreased over time in both genotypes and was consistently lower in KI mice indicating lower anxiety in the KI mice.
Fig. 2.
Open-field activity in 27 WT (□) and 27 KI (○) mice. Each point represents the mean ± SEM for each six min epoch. Data were analyzed by means of RM ANOVA with genotype (WT, KI) and epoch as factors and repeated measures on epoch. (A) Total distance moved in the horizontal plane. The epoch × genotype (F(4, 208) = 0.88, NS) interaction was not statistically significant, but main effects of both genotype (F(1,52) = 11.39, P ≤ 0.005) and epoch (F(1,208) = 35.08, P < 0.0001) were. (B) Center distance. Neither the epoch × genotype (F(4, 208) = 0.43, NS) interaction nor the main effect of epoch (F(1,208) = 2.05, P = 0.089) was statistically significant, but the main effect of genotype (F(1,52) = 14.44, P ≤ 0.001) was statistically significant. (C). Number of entries into the center of the field. The epoch × genotype (F(4, 208) = 0.52, NS) interaction was not statistically significant, but main effects of both genotype (F(1,52) = 6.02, P ≤ 0.05) and epoch (F(1,208) = 21.69, P < 0.0001) were. (D). Percent distance moved in the margins of the field. The epoch × genotype (F(4, 208) = 0.82, NS) interaction was not statistically significant, but main effects of both genotype (F(1,52) = 7.53, P ≤ 0.01) and epoch (F(1,208) = 14.83, P < 0.0001) were.
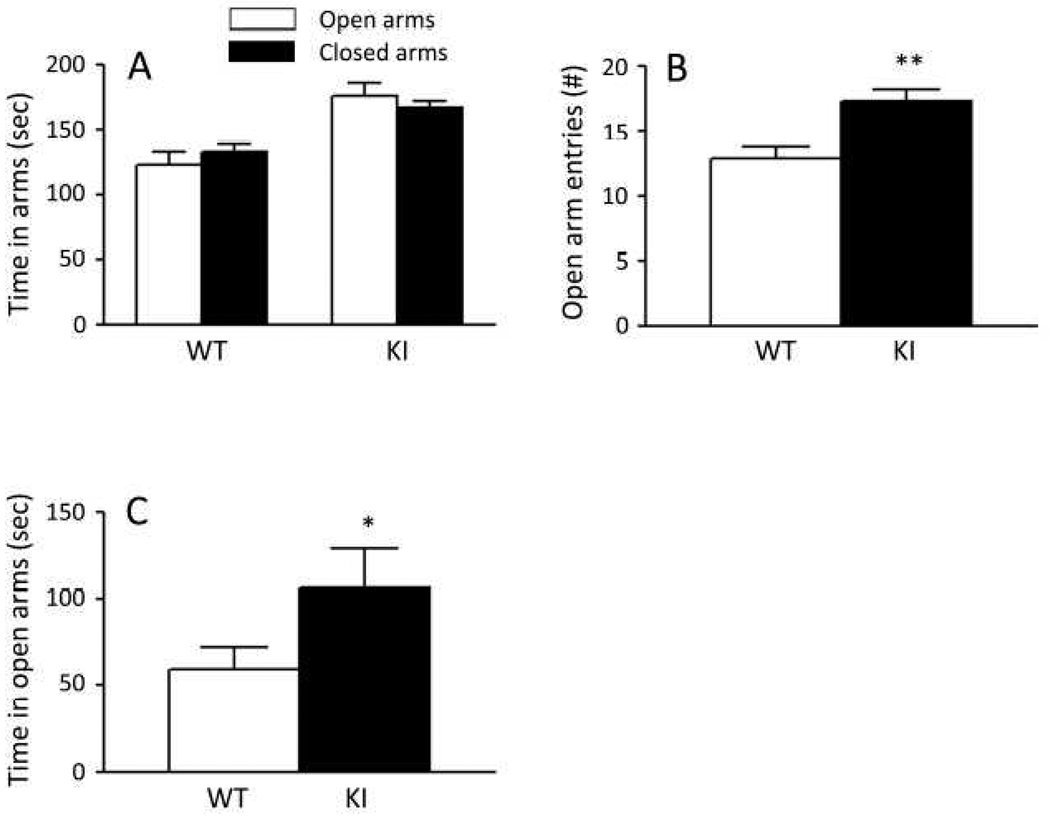
General anxiety in KI mice was further assessed by means of the EPM. Times spent in the open and closed arms of the EPM were similar for both genotypes (Fig. 3A). Neither the interaction between genotype and arm nor the main effect of genotype was statistically significant, but the main effect of arm was statistically significant, confirming the natural preference of mice for closed spaces. We also assessed the number of entries into the open arms (Fig. 3B) and found that KI mice made 34% more entries into the open arms than WT mice (P<0.001, one-tailed Student’s t-test). In a subset of mice, we also tested for general anxiety by means of the EZM (Fig. 3C). We evaluated time spent in the open quadrants and found that on average KI mice spent 81% more time in the open quadrants than WT (P<0.05, one-tailed Student’s t-test).
Fig. 3.
Behavior of WT and KI mice in tests of anxiety. Bars represent the means ± SEM. (A). Time spent in the open and closed arms of the EPM in WT (n=25) and KI (n=26) mice. Results were analyzed by RM ANOVA with genotype and arm as factors and repeated measures on arm. Neither the interaction between genotype and arm nor the main effect of genotype were statistically significant, but the main effect of arm (F1,49=15.40, P ≤ 0.001) was. (B). Numbers of entries into the open arms of the EPM for WT (n=25) and KI (n=26) mice were compared by one-tailed Student’s t-test. The difference was statistically significant (P ≤ 0.001, **). (C). Times spent in the open quadrants of the EZM in WT (n=7) and KI (n=7) mice were compared by one-tailed Student’s t-test. The difference was statistically significant (P ≤ 0.05, *).
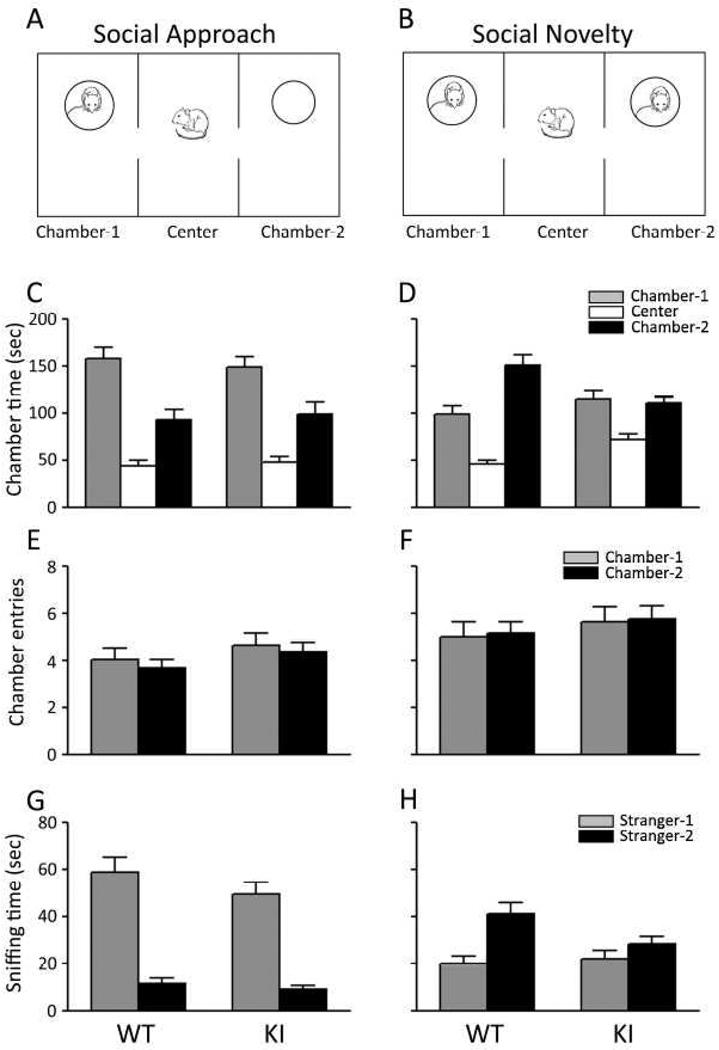
We assessed social behavior by means of an automated three-chambered social approach apparatus (Nadler et al., 2004). During the habituation phase, two WT mice remained in one side chamber for more than 3 min and were eliminated from further study. The social approach phase began with the introduction of a novel mouse (Stranger-1) into Chamber-1 (Fig. 4A). During this phase, mice of both genotypes spent more time in Chamber-1 than either the center or Chamber-2 (empty chamber) (Fig. 4C). The social novelty phase began with the introduction of a second novel mouse (Stranger-2) into Chamber-2 (Fig. 4B). During this phase WT mice (Fig. 4D) showed a clear switch in preference for the chamber with the novel mouse (Chamber-2). The KI mice spent more time in Chamber-2 (12%) than they had during the social approach phase, but the increase was smaller than that of WT mice (62%). Results were analyzed by means of RM ANOVA with chamber (1 or 2), condition (social approach or social novelty), and genotype (WT or KI) as factors with RM on chamber and condition. The three-way interaction (chamber × condition × genotype) was not statistically significant but two-way interactions of chamber × condition (F(1, 38) = 15.27, P < 0.001) and condition × genotype (F(1, 38) = 5.53, P < 0.05) were. These results indicate that regardless of genotype, chamber preference changed between social approach and social novelty. Moreover the effect of condition (social approach or social novelty) differed between the two genotypes on total time in the two side chambers (Chamber-1 and Chamber-2), i.e., KI mice spent less time in the two side chambers and an increased amount of time in the center during social novelty compared with WT.
Fig. 4.
Behavior of WT (n = 20) and KI (n = 20) mice on a test of social interaction. Bars (mean ± SEM) represent the time spent in each chamber (C, D), the number of chamber entries (E, F), time spent sniffing the wire cage in each chamber (G, H). Chamber-1 (or Stranger-1 in G & H) is represented by the grey bar; Chamber-2 (or Stranger-2 in G & H) is represented by the black bars; the center chamber in C & D is represented by the open bars. Results were analyzed by RM ANOVA with genotype (WT, KI), condition (social approach, social novelty), and chamber (Chamber-1, Chamber-2) as factors and repeated measures on condition and chamber. For the time spent in a chamber, the chamber × condition × genotype (F(1,38) = 2.92, P=0.095) and the genotype × chamber (F(1,38) = 1.14, NS) interactions were not statistically significant, but the chamber × condition (F(1, 38) = 15.27, P ≤ 0.001) and condition × genotype (F(1, 38) = 5.53, P ≤ 0.05) interactions were both statistically significant. The pairwise comparison between genotypes was statistically significant for social novelty regardless of chamber (P=0.001). The pairwise comparison between social approach and social novelty regardless of chamber was statistically significant for KI mice (P=0.002). Regardless of genotype we found a statistically significant difference between times spent in chamber-1 and chamber-2 under the social approach (P=0.001) condition. For chamber entries, none of the interactions was statistically significant, and of the factors only the main effect of chamber was statistically significant (F(1, 38) = 12.62, P =0.001). For the time spent sniffing, only the condition × chamber interaction achieved statistical significance (F(1,38) = 77.82, P < 0.001). The chamber × condition × genotype interaction (F(1,38) = 2.65, P=0.11) approached significance. Main effects of both chamber (F(1,38) = 48.00, P ≤ 0.001) and condition (F(1,38) = 5.22, P ≤ 0.05) were statistically significant and the main effect of genotype (F(1,38) = 2.67, P=0.11) approached statistical significance. The pairwise comparison between chambers was statistically significant for both social approach (P < 0.001) and social novelty (P=0.001) regardless of genotype. The pairwise comparison between social approach and social novelty was statistically significant for both Chamber-1 and Chamber-2 regardless of genotype (P < 0.001).
The number of entries into each chamber (Fig. 4E & F) can be a measure of activity as well as social interest. Average numbers of entries into both chambers under both conditions were higher for KI mice compared with WT consistent with hyperactivity of KI mice. Entries into both chambers were higher for both genotypes during social novelty compared with social approach, suggesting that the introduction of the second stranger mouse was arousing for both genotypes. Results of the RM ANOVA indicate that none of the three-way and two-way interactions were statistically significant.
The measure of time spent sniffing the wire cups in Chambers-1 and -2 (Fig. 4G & H) is considered to be an index of more direct social interest in this choice task (Nadler et al., 2004). During the social approach phase with a novel mouse in Chamber-1 only, both WT and KI mice spent more time sniffing Stranger-1 than the empty cup in Chamber-2. During the social novelty phase in which a second novel mouse (Stranger-2) was introduced into Chamber-2, mice of both genotypes showed a clear switch in preference for Stranger-2 and spent relatively more time sniffing the novel mouse. The three-way interaction was not statistically significant and neither the genotype × condition nor the genotype × chamber interactions were statistically significant, but the statistically significant interaction between condition and chamber indicates a switch in chamber preference for both genotypes with the introduction of the second stranger mouse. Overall our results on the social interaction test indicate that KI mice exhibit behavior similar to that of WT mice with the exception of the increased time in the center chamber during social novelty suggesting some “social anxiety”.
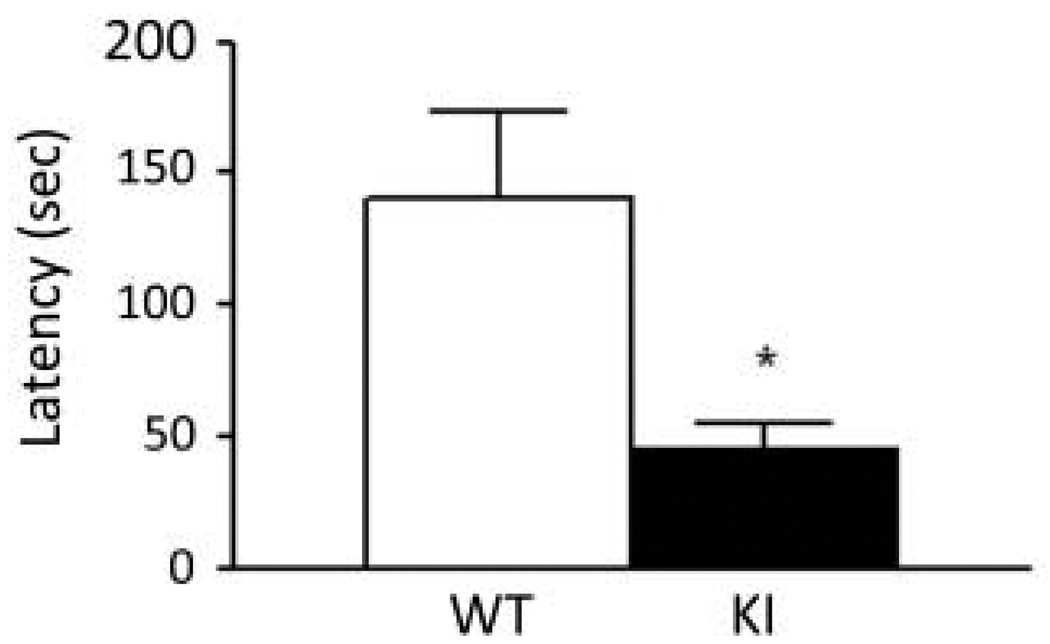
We assessed a form of learning and memory with the passive avoidance test. Twenty-four hours after a one-trial training session, the latency of animals to enter the dark compartment was recorded for up to 300 sec (Fig. 5). The average latency of KI mice was only 32% of the latency of WT (P<0.01).
Fig. 5.
Behavior of WT (n=15) and KI (n=17) mice on the passive avoidance test. Bars represent the mean ± SEM latency to enter the dark chamber 24 h after a single training session in which mice received a foot-shock (0.3 mA for 1 s) upon entering the dark chamber. Latencies were significantly different in the two genotypes (P ≤ 0.01, one-tailed Student’s t-test).
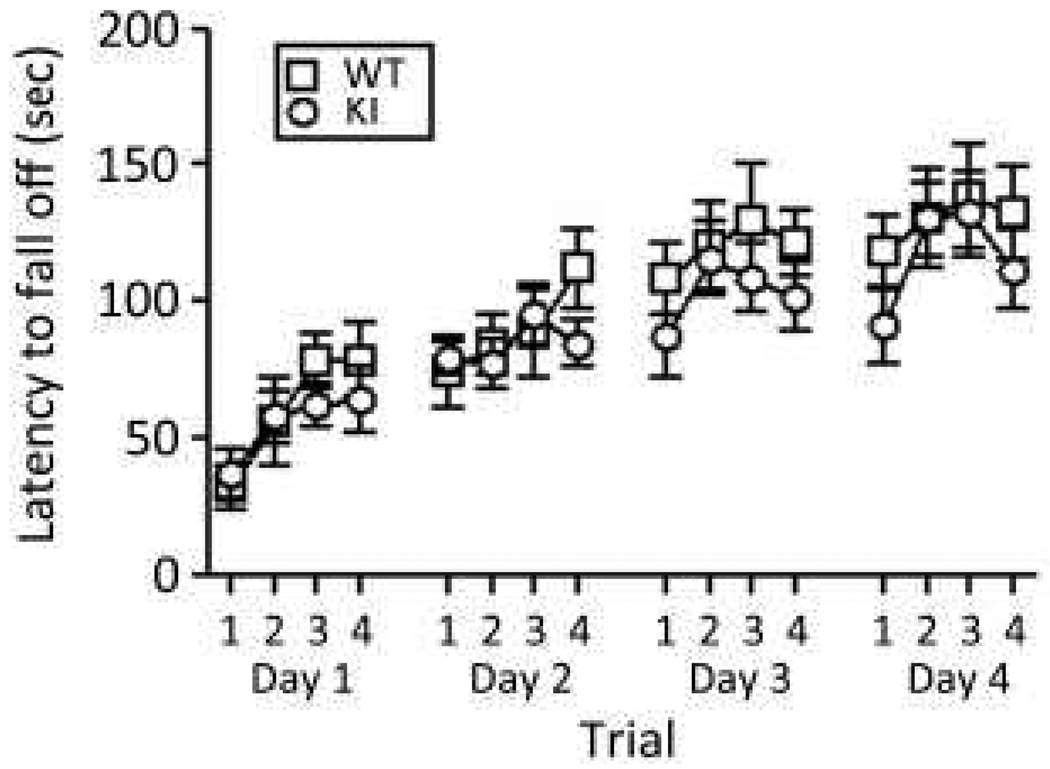
We assessed a form of motor learning and memory with the rotarod test. The latency to fall off the rotating rod increased with trials in both genotypes indicating motor learning (Fig.6). There was no statistically significant interaction between genotype and trial and no main effect of genotype. Only the main effect of trial was statistically significant (P<0.0001) indicating that performance of both genotypes improved with increasing number of trials.
Fig. 6.
Behavior of WT (□) (n=11) and KI (○) (n=9) mice on the rotarod test of motor learning. Each point represents the mean ± SEM latency to fall off the rotating rod. Data were analyzed by means of a RM ANOVA with genotype and trial as factors and repeated measures on trial. Neither the interaction between genotype and trial (F15,150 = 0.43, NS) nor the main effect of genotype (F1,150 = 2.17, P=0.17) was statistically significant, but the main effect of trial (F15,150 = 7.33, P ≤ 0.001) was.
Dendrite and dendritic spine morphology
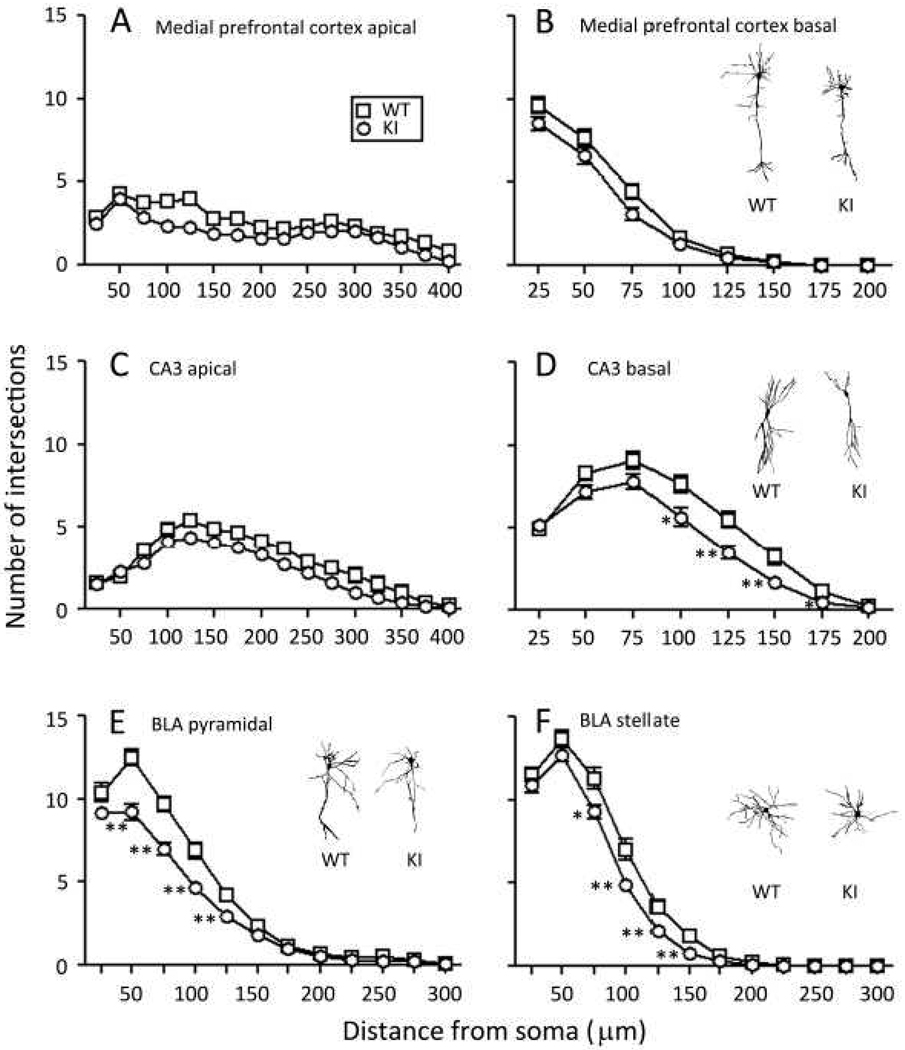
In light of the behavioral effects of the expanded CGG·CCG -repeat sequence on the Fmr1 gene, we examined dendrite and spine morphology in three regions of the brain: medial prefrontal cortex, hippocampus, and basal lateral amygdala. These three regions were chosen because of their involvement in social interaction, inhibitory control, learning and memory. We determined dendritic branching on primary apical (Fig. 7A) and basal (Fig.7B) dendrites of layer III pyramidal neurons in medial prefrontal cortex from seven WT and eight KI mice. The total number of neurons analyzed was 45 of each genotype. In both genotypes the number of branch points was highest proximal to the soma and was higher on basal dendrites compared with apical. Overall arborization was reduced in both apical (P<0.001) and basal (P<0.05) dendrites in KI mice. Differences appeared to be more pronounced proximal to the soma. We also determined dendritic branching on apical (Fig. 7C) and basal (Fig.7D) dendrites of CA3 pyramidal cells of the dorsal hippocampus from seven WT and seven KI mice. The total number of neurons analyzed was 50 of each genotype. Overall arborization on apical dendrites was reduced in KI mice compared to WT (P<0.01), but the shapes of the curves were similar. The shapes of the branching × distance from the soma curves were different for the two genotypes for basal dendrites (P<0.01). Specifically branching was similar for the two genotypes between 25 and 75 µm and at 200 µm from the soma, but between 100 and 175 µm from the soma, branching was statistically significantly reduced in the KI mice. We also determined branching on dendrites of pyramidal-like (Fig. 7E) and stellate (Fig. 7F) cells in basal lateral amygdala from nine WT and nine KI mice. The total number of each cell type analyzed was 45 for each genotype and for each cell type. In both genotypes, the number of branch points was highest proximal to the soma. The shapes of the branching × distance from the soma curves were different in the two genotypes for both pyramidal-like (P<0.01) and stellate cells (P<0.01). In pyramidal-like cells, branching was statistically significantly lower in KI mice between 50 and 175 µm from the soma. In stellate cells, branching was statistically significantly lower in KI mice between 75 and 150 µm from the soma.
Fig. 7.
Dendritic branching in WT (□) and KI (○) mice was assessed by means of Sholl Analyses. Each point represents the mean ± SEM branches on 45 dendrites of each genotype in medial prefrontal cortex and in amygdala and on 50 dendrites of each genotype in hippocampus. Results were analyzed by RM ANOVA with genotype and distance from the soma as factors and repeated measures on distance from the soma. (A). Medial prefrontal cortex, apical dendrites from seven WT and seven KI mice. The interaction between genotype and distance from the soma was not statistically significant, but main effects of both genotype (F1,88 = 26.88, P ≤ 0.001) and distance from the soma (F11,960 = 23.57, P ≤ 0.001) were. (B). Medial prefrontal cortex, basal dendrites, from seven WT and seven KI mice. The interaction between genotype and distance from the soma (F3,263=16.31, P=0.09) approached statistical significance, and main effects of both genotype (F1,88=4.63, P≤0.05) and distance from the soma (F3,263= 357.14, P<0.0001) were statistically significant. (C). Hippocampal CA3, apical dendrites, from seven WT and seven KI mice. The interaction between genotype and distance from the soma was not statistically significant, but main effects of both genotype (F1,98 = 9.19, P ≤ 0.005) and distance from the soma (F4,420=75.57, P≤0.001) were. (D). Hippocampal CA3, basal dendrites, from seven WT and seven KI mice. The interaction between genotype and distance from the soma (F4,372=3.53, P≤0.01) was statistically significant. Statistically significant differences between WT and KI at each distance from the soma were probed by means of Bonferroni t-tests and are indicated on the graph as follows: *, 0.01 ≤ P ≤ 0.05; **, 0.001 ≤ P ≤ 0.01. (E). Basolateral amygdala, pyramidal-like cell dendrites, from nine WT and nine KI mice. The interaction between genotype and distance from the soma (F5,435=8.63, P≤0.001) was statistically significant. Statistically significant differences between WT and KI at each distance from the soma were probed by means of Bonferroni t-tests and are indicated on the graph as described above. (F). Basolateral amygdala, stellate cell dendrites, from nine WT and nine KI mice. The interaction between genotype and distance from the soma (F4,325=3.90, P≤0.005) was statistically significant. Statistically significant differences between WT and KI at each distance from the soma were probed by means of Bonferroni t-tests and are indicated on the graph as described above. Insets in B, D, E, and F are representative of Golgi-impregnated cells from WT and KI mice as follows: medial prefrontal cortex pyramidal cells, hippocampal CA3 pyramidal cells, basal lateral amygdala pyramidal-like cells, and basal lateral amygdale stellate cells, respectively.
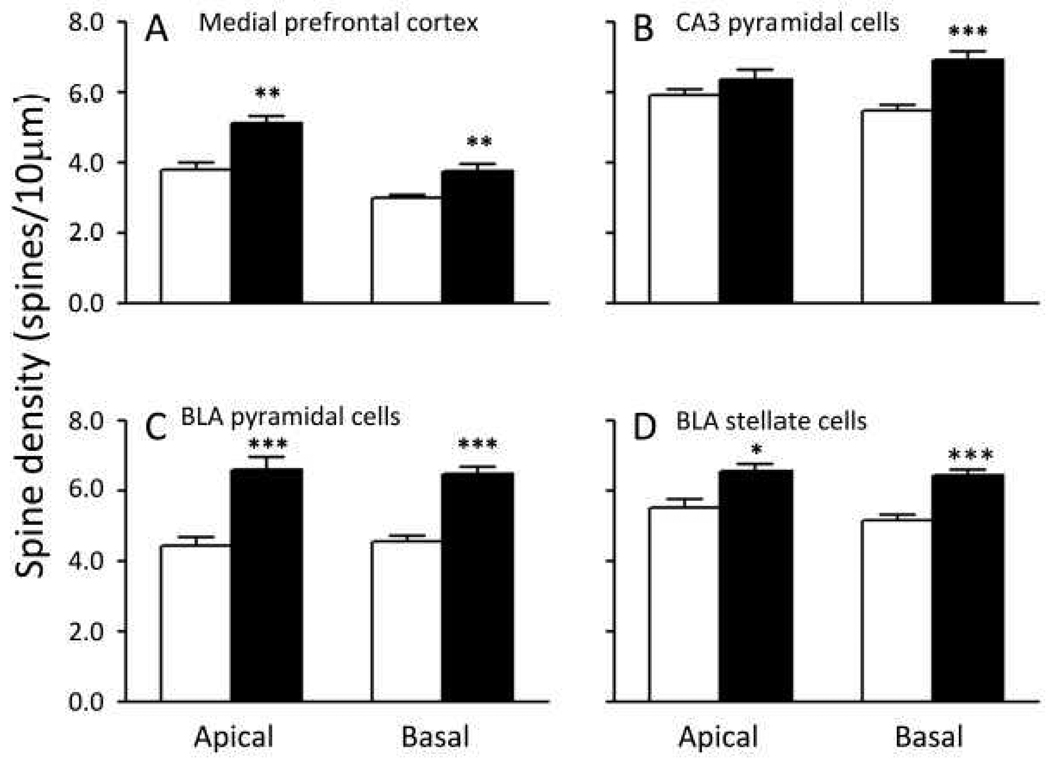
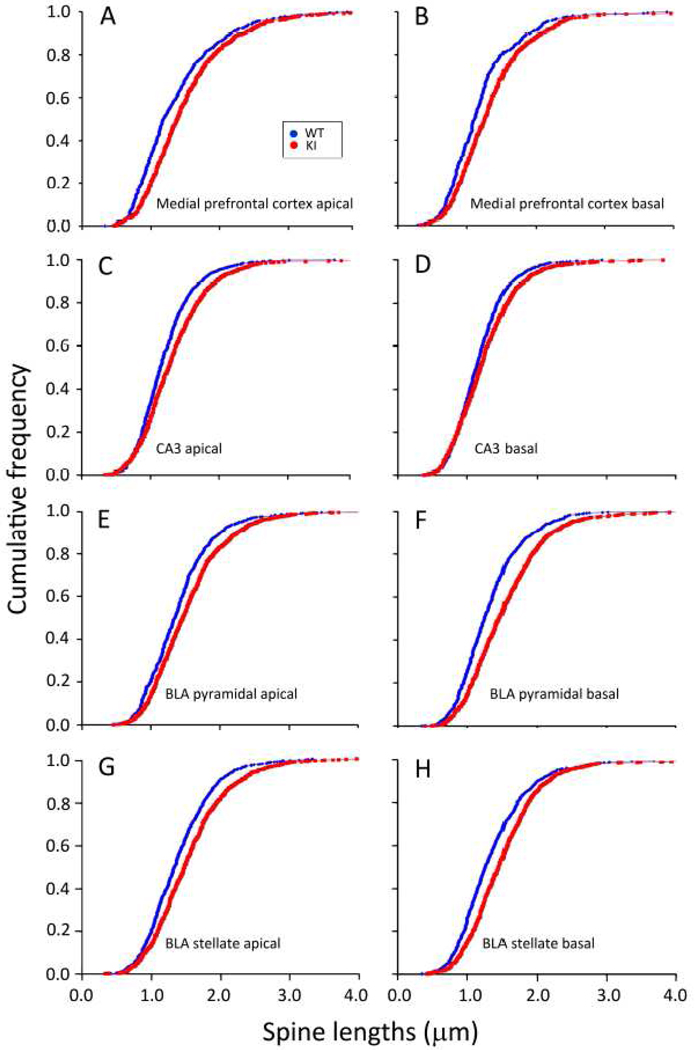
Spine density and length were measured on secondary apical and primary basal dendrites of layer III pyramidal cells in medial prefrontal cortex, CA3 pyramidal cells in dorsal hippocampus, and pyramidal-like and stellate cells in basal lateral amygdala. Measurements were made in five mice of each genotype. In each mouse, spine densities and lengths were evaluated in six neurons. The densities of spines (Fig. 8) were higher in KI mice on all dendrites examined except for the secondary apical dendrite of CA3 pyramidal cells. In medial prefrontal cortex, spine densities were higher in KI mice by 35 and 25% on apical and basal dendrites, respectively (Fig.8A). In CA3 pyramidal cells, spine densities in KI mice were increased by 8 and 26% on apical and basal dendrites, respectively (Fig.8B). In basal lateral amygdala pyramidal-like cells, spine densities in KI mice were increased by 48 and 41% on apical and basal dendrites, respectively (Fig.8C). In KI mice, spine densities on basal lateral amygdala stellate cells were 18 and 25% higher on apical and basal dendrites, respectively (Fig.8D). Cumulative frequency distributions of spine length in the two genotypes were compared by means of Kolmogorov-Smirnov tests. In all three regions and in both pyramidal-like and stellate cells in basal lateral amygdala, spines on both apical and basal dendrites were statistically significantly longer in KI mice (P<0.0001) (Fig. 9).
Fig. 8.
Spine densities on secondary dendrites in WT (open bars) and KI (filled bars) mice. Bars are the means ± SEM in five mice of each genotype. We measured spine densities on 30 neurons per region on apical and basal dendrites. Differences between genotypes were tested by means of one-tailed Student’s t-tests. Statistically significant differences are indicated on the figure as follows: *, 0.01 ≤ P ≤ 0.05; **, 0.001 ≤ P ≤ 0.01; ***, P < 0.001. (A). Medial prefrontal cortex, apical (left) and basal (right). (B). Hippocampal CA3 pyramidal cells, apical (left and basal (right). (C). Basolateral amygdala pyramidal cells, apical (left) and basal (right). (D). Basolateral amygdala stellate cells, apical (left) and basal (right).
Fig. 9.
Cumulative frequency distributions of dendritic spine lengths in five WT (blue •) and five KI (red •) mice. We measured spine lengths on 30 neurons per region on apical and basal dendrites. Cumulative frequencies were compared by means of Kolmogorov-Smirnov Tests. (A). Medial prefrontal cortex, apical dendrite. Lengths were measured in 570 and 771 spines from five WT and five KI mice, respectively. The difference between the distributions in the two genotypes was statistically significant (P<0.0001). (B). Medial prefrontal cortex, basal dendrite. Lengths were measured in 452 and 565 spines from WT and KI mice, respectively. The difference between the distributions in the two genotypes was statistically significant (P<0.0001). (C). Hippocampal CA3, apical dendrite. Lengths were measured in 882 and 957 spines from WT and KI mice, respectively. The difference between the distributions in the two genotypes was statistically significant (P<0.0001). (D). Hippocampal CA3, basal dendrite. Lengths were measured in 824 and 1040 spines from WT and KI mice, respectively. The difference between the distributions in the two genotypes was statistically significant (P<0.0005). (E). Basolateral amygdala pyramidal cell, apical dendrite. Lengths were measured in 670 and 992 spines from WT and KI mice, respectively. The difference between the distributions in the two genotypes was statistically significant (P<0.0001). (F). Basolateral amygdala pyramidal cell, basal dendrite. Lengths were measured in 694 and 975 spines from WT and KI mice, respectively. The difference between the distributions in the two genotypes was statistically significant (P<0.0001). (G). Basolateral amygdala stellate cell, apical dendrite. Lengths were measured in 830 and 983 spines from WT and KI mice, respectively. The difference between the distributions in the two genotypes was statistically significant (P<0.0001). (H). Basolateral amygdala stellate cell, basal dendrite. Lengths were measured in 797 and 967 spines from WT and KI mice, respectively. The difference between the distributions in the two genotypes was statistically significant (P<0.0005).
Regional rates of cerebral protein synthesis
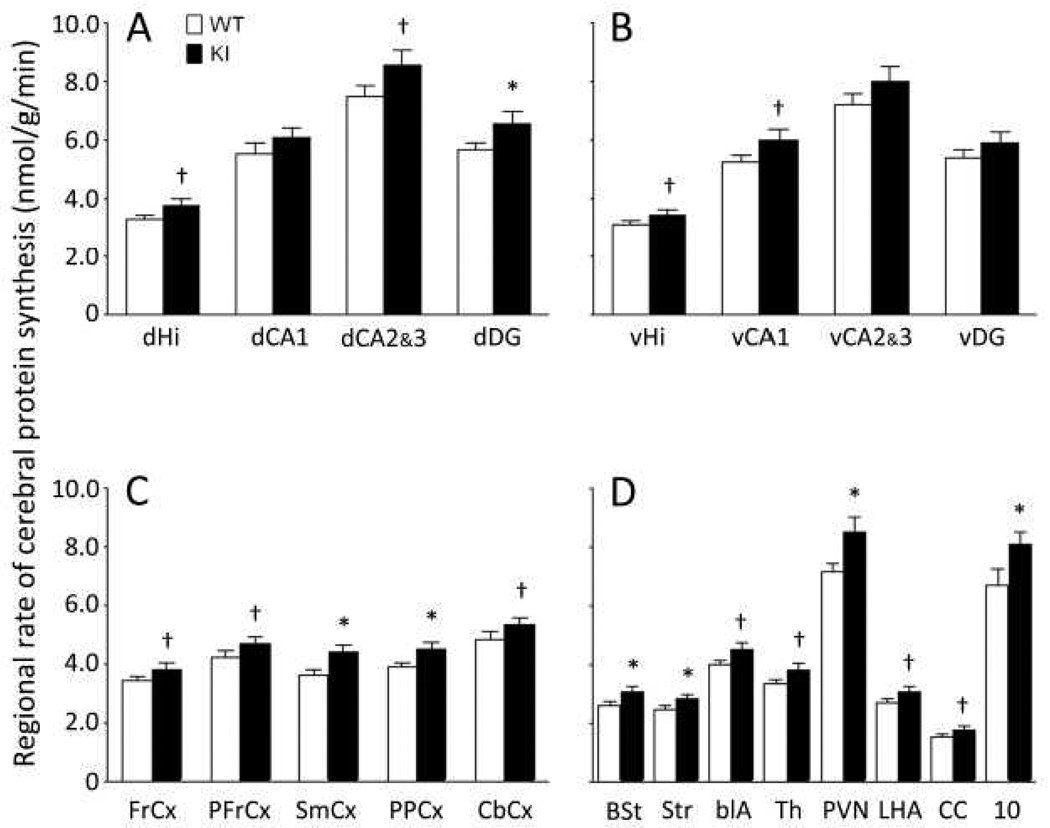
We determined rCPS in twenty one brain regions including the dorsal hippocampus as a whole, the ventral hippocampus as a whole, six subregions of the hippocampus, and five cortical areas (Fig.10). Average rCPS in the KI mice was consistently higher compared with WT by 10–21%. Statistically significant effects (P≤0.05, one-tailed Student’s t-tests) were found in seven regions including two cortical areas, striatum, bed nucleus of stria terminalis, dentate gyrus of dorsal hippocampus, dorsal motor nucleus of the vagus, and paraventricular nucleus of the hypothalamus. Effects in 11 other regions approached statistical significance (0.05≤P≤0.10).
Fig. 10.
Regional rates of cerebral protein synthesis in WT (open bars) and KI (filled bars) mice. Bars represent the means ± SEM for eight mice in each group except for the dorsal motor nucleus of the vagus (10) with seven KI mice. Abbreviations are as follows: dHi, dorsal hippocampus; dCA1, CA1 sector of the pyramidal cell layer of dorsal hippocampus; dCA2&3, CA2&3 sectors of the pyramidal cell layer of dorsal hippocampus; dorsal dentate gyrus; vHi, ventral hippocampus; vCA1, CA1 sector of the pyramidal cell layer of ventral hippocampus; vCA2&3, CA2&3 sectors of the pyramidal cell layer of ventral hippocampus; ventral dentate gyrus; FrCx, frontal cortex; PFrCx, medial prefrontal cortex; SmCx, somatosensory cortex; PPCx, posterior parietal cortex; CbCx, cerebellar cortex; BSt, bed nucleus of the stria terminalis; Str, striatum; blA, basolateral amygdala; Th, thalamus; PVN, paraventricular nucleus of the hypothalamus; LHA, lateral hypothalamic area; CC, corpus callosum; 10, dorsal motor nucleus of the vagus. The two groups were compared by means of one-tailed student’s t-tests; *, 0.01 ≤ P ≤ 0.05; †, 0.05 ≤ P ≤ 0.10.
Levels of Fmr1 mRNA and FMRP in brain regions
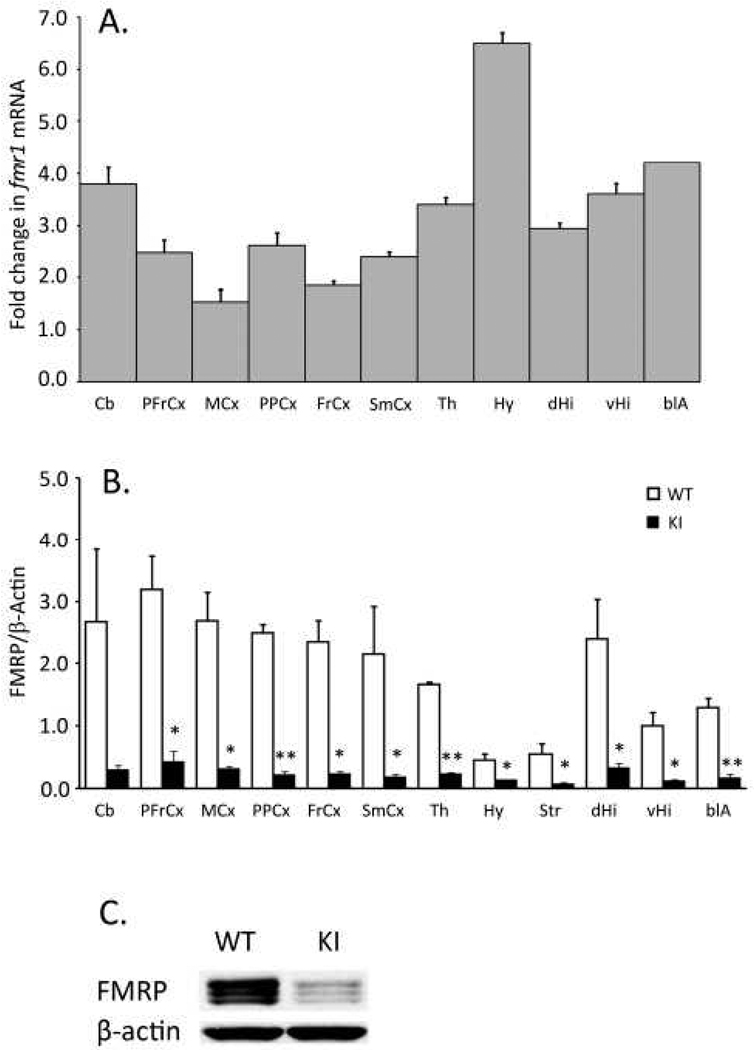
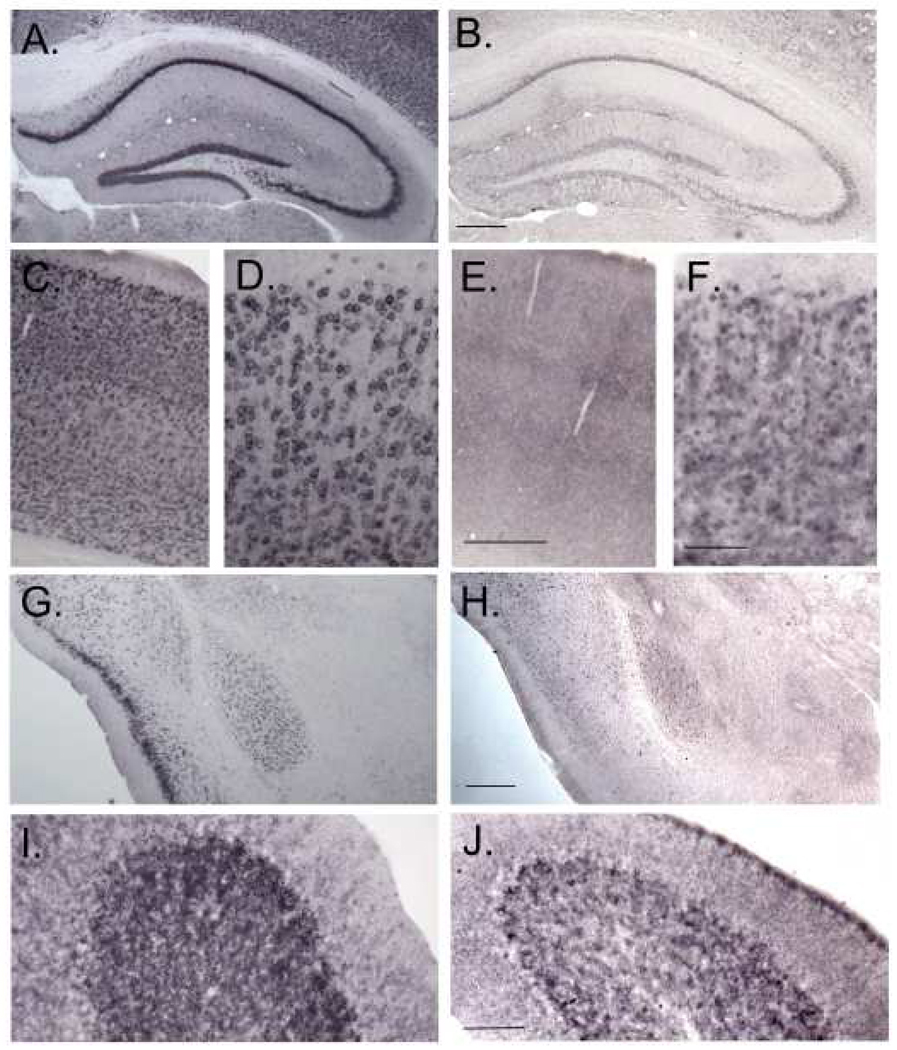
We determined levels of Fmr1 mRNA in cerebellum, and ten “punched” brain regions to confirm the original findings in this model (Entezam et al., 2007). Levels of Fmr1 mRNA were between two and six-fold higher in KI mice compared to WT (Fig. 11A) in all eleven regions. Despite the increased level of Fmr1 mRNA, FMRP concentrations were reduced in the KI mice in the brain as a whole and throughout the brain (Fig. 11B&C). In the brain as a whole, the mean KI FMRP level was 15% of WT. In brain regions, differences between WT and KI mean values ranged from 70 to 91%. Statistically significant effects were seen in all regions except the cerebellum. The distribution of loss of FMRP in some of the regions does not appear to be uniform (Fig 12). In the hippocampus (Fig 12A&B) decreases in FMRP in the stratum lacunosum molecular and in stratum moleculare of the dentate gyrus appear to be less pronounced than in the polymorph layer of dentate gyrus or in stratum radiatum. Similarly, in cerebellum (Fig. 12 I&J) the granule cell layer is unevenly affected and the molecular layer appears to be little affected. Purkinje cells may have more normal levels of FMRP. In cortex (Fig. 12 C. D., E., F.) and in amygdala ((Fig. 12 G&H), it appears that fewer cells are stained for FMRP in the KI.
Fig. 11.
Effects of CGG·CCG repeat insertion on Fmr1 mRNA (A) and FMRP (B) in brain regions. Abbreviations are as follows: Cb, cerebellum; PFrCx, medial prefrontal cortex; MCx, primary motor cortex; PPCx, posterior parietal cortex; FrCx, frontal cortex; SmCx, somatosensory cortex; Th, thalamus; Hy, hypothalamus; dHi, dorsal hippocampus; vHi, ventral hippocampus; vCA1, CA1 sector of the pyramidal cell layer of ventral hippocampus; blA, basolateral amygdala. A. Fold changes (± SD) from WT in Fmr1 mRNA were analyzed by quantitative PCR in three mice of each genotype. B. FMRP/β-actin ratios in WT (open bars) and KI (filled bars) mice were determined by Western blotting. Bars are the means ± SEM determined in three mice of each genotype. We used a rabbit polyclonal antibody (ab17722) to FMRP. Differences between genotypes were tested for statistical significance by means of one-tailed student’s t-tests; *, 0.01 ≤ P ≤ 0.05; †, P≤ 0.01. C. Western blot of whole brain extracts from WT and KI mice.
Fig. 12.
Immunohistochemical localization of FMRP in WT (A, C, D, G, I) and KI (B, E, F, H, J) mice in dorsal hippocampus (A, B), cortex (C–F), amygdala (G, H), and cerebellum (I, J). Scalebars in B, E, and H represent 200 µm and in F and J represent 50 µm. Scalebars in B, E, F, H, and J apply to A, C, D, G, and I, respectively.
Discussion
We have shown that a young adult KI mouse model of the FXPM has a distinct behavioral phenotype which includes hyperactivity, some subtle social deficits, profound deficits on the passive avoidance test, reduced levels of general anxiety, and normal motor learning. Protein synthesis rates in brain were generally higher in KI mice compared with WT. Surprisingly, we found clear neuropathology in the FXPM mouse including hypotrophic dendritic arborization and increased length and density of dendritic spines in amygdala, hippocampus and medial prefrontal cortex. Consistent with findings in the human premutation, the level of Fmr1 mRNA was increased throughout the brain. Despite the increased message, FMRP levels were profoundly reduced. Our results indicate that even in young adult KI mice an expanded CGG·CCG repeat sequence in Fmr1 in the FXPM range can adversely affect behavior, dendrite morphology and rCPS.
The findings that KI mice have a phenotype similar in some respects to Fmr1 KO mice are in accord with reports of the FXPM in human subjects. Case reports (Hagerman et al., 1996; Tassone et al., 2000b) and more comprehensive studies (Aziz et al., 2003; Cornish et al., 2005; Farzin et al., 2006; Loesch et al., 1994) of boys with the FXPM suggest that the phenotype in human subjects is similar, albeit milder, than that of the full mutation. Symptoms include social deficits ranging from mild impairments in social cognition to autism spectrum disorder, impulsivity, mild attention-deficit hyperactivity disorder, and some learning disabilities. There is also evidence that some symptoms, such as social deficits, worsen with increasing age (Cornish et al., 2005). It has been suggested that a decreased fraction of FMRP-positive lymphocytes may be associated with the presence of these clinical features in individual cases (Tassone et al., 2000b).
We studied variables in the KI mice for which we had observed robust phenotypes in Fmr1 KO mice (Liu et al., 2010; Liu and Smith, 2009; Qin et al., 2002). Comparisons between studies must take in consideration genetic backgrounds as well as age of the animals studied. Both factors can influence the behavioral phenotype. The KI mice in the present study were young adults (4–5 months of age) on a C57BL/6 background, whereas Fmr1 KO mice were on an FVB/NJ background (Liu et al., 2010; Liu and Smith, 2009; Qin et al., 2002). All Fmr1 KO mice were young adults; in one case 4–5 months (Qin et al., 2002) and in others 2–3 months of age (Liu et al., 2010; Liu and Smith, 2009). With a few exceptions results of the present study indicated a similar but somewhat milder behavioral phenotype than we saw in Fmr1 KO. Like Fmr1 KO mice (Liu et al., 2010; Peier et al., 2000; Qin et al., 2002; The Dutch-Belgian Fragile et al., 1994), KI mice were clearly hyperactive as indicated by the higher total horizontal distance moved in the open field and the higher number of open arm entries in the EPM. KI mouse behavior in the open field and the EZM indicated reduced anxiety, similar to our findings in the Fmr1 KO (Liu et al., 2010; Liu and Smith, 2009). Deficits on the passive avoidance test were striking in both Fmr1 KO (Liu et al., 2010; Qin et al., 2002) and KI mice suggesting that learning and memory are affected in these mice. Another interpretation of the deficit on this test of aversively motivated learning is that it reflects a loss of inhibitory control. Impulsivity and impaired inhibitory control have also been reported in Fmr1 KO mice (Moon et al., 2006) and are characteristic of clinical phenotypes of FXS and FXPM. This interpretation is of particular interest in light of our findings of less dendritic complexity and spine changes in medial prefrontal cortex, an area of the brain involved in behavioral control (Birrell and Brown, 2000; Muir et al., 1996). We studied motor learning with the rotarod test and found no deficiency in KI mice. This contrasts with results in Fmr1 KO mice (Peier et al., 2000) in which an indication of a deficit was reported. The biggest difference between the KI and Fmr1 KO models was in the test of social interaction. Behavior of KI mice on this test suggested very subtle signs of “social anxiety”, whereas Fmr1 KO mice (Liu et al., 2010; Liu and Smith, 2009) show significantly diminished social approach and response to social novelty. The difference in background strain between the two models may also influence this behavioral distinction.
The protein product of Fmr1 is FMRP, a putative translation suppressor (Laggerbauer et al., 2001; Li et al., 2001; Zhang et al., 2001). Consistent with this role for FMRP, rCPS measured in vivo was increased in the absence of FMRP in Fmr1 KO mice (Qin et al., 2005). In the present study regional FMRP levels were reduced to 10–20% of WT and rCPS were increased, suggesting that a reduction in FMRP can result in a change in translation suppression. Comparison of our Western blots of regional brain extracts with those from whole brain extracts (Entezam et al., 2007) indicates that percent changes in FMRP levels were greater than previously described. This discrepancy could be due to the difference in the number of WT mice analyzed. In the present study we compared blots from 3 KI mice with 3 WT mice. In the previous study the KI mice were compared with a single WT animal. It is now known that FMRP levels vary considerably in WT mice. A low level of FMRP in the WT mouse used in the original study might have led to the erroneous conclusion that FMRP levels were not as severely reduced in KI animals as our present study shows them to be. Comparison of immunohistochemical results between the two studies also shows greater decreases in FMRP in the present study. However, in the original study 4 WT and 5 KI animals were compared. The difference in these results could be due, in part, to an effect of age. In the previous study, sections processed were taken from aged animals, whereas we studied young adult mice. It may be that brain FMRP levels decrease more severely with age in WT mice, so that the large difference seen in younger animals is less marked in older ones. In the (CGG)98 model of FXPM, smaller reductions in FMRP were found, and differences in behavioral phenotype were milder than seen in the present study (Van Dam et al., 2005). (CGG)98 mice with repeat expansions of between 100 and 150 had reductions in FMRP of approximately 50% of WT (Brouwer et al., 2008a); these mice were not hyperactive, did not appear to have reduced anxiety in the open field, and performed like WT mice on the passive avoidance test (Van Dam et al., 2005). Other tests of cognitive function in (CGG)98 mice show declines in visual-spatial memory occurring in later life (Van Dam et al., 2005) and some evidence of deficits in spatial processing in young adult animals (Hunsaker et al., 2009). It is possible that differences in behavioral phenotype are attributable to differences in FMRP levels between the two KI models.
Why are Fmr1 mRNA levels increased in KI mice, and why, in the presence of 2–6 fold increases in Fmr1 mRNA, are FMRP levels reduced? The increased level of Fmr1 mRNA in the presence of an expanded repeat sequence is not understood. It may be due to feedback stimulation as a result of the reduced FMRP levels, but there could also be more direct effects of the repeat tract on transcription. Decreased FMRP in brain has been observed in KI mouse models with expanded repeat sequences (Bontekoe et al., 2001; Brouwer et al., 2007; Entezam et al., 2007) and in lymphocytes from human subjects with FXPM (Kenneson et al., 2001; Tassone et al., 2000b). A likely explanation is that transcripts with expanded repeats may impede the linear 40S migration along the 5’-untranslated region (Feng et al., 1995). An alternative to 5’ cap-dependent initiation of translation may occur through an internal ribosome entry site (IRES), and an IRES has been identified in the 5’ untranslated region of FMR1 mRNA (Chiang et al., 2001). Interestingly, it has been suggested that IRESes may be involved in activity-coupled translation in neuronal dendrites (Pinkstaff et al., 2001).
The effect on dendritic spine morphology is one of the surprising findings of our study. Increased spine density and length are characteristic of FXS (Hinton et al., 1991), and these changes have also been demonstrated in the Fmr1 KO mouse model (Irwin et al., 2001). To our knowledge, spines have not been assessed in FXPM or in intact brain from either of the KI mouse models. We demonstrate here similar abnormalities in young adult KI mice in all three brain regions examined, i.e., medial prefrontal cortex, basal lateral amygdala, and hippocampus. Our findings suggest that spines in adult KI mice are immature and may reflect some deficiency in synaptic plasticity. The opposite effect was shown in a study of cultured hippocampal neurons from heterozygous CGG-repeat (155–200 repeats) female mice (Chen et al, 2010). In the cultured neurons, dendritic spines were unchanged in number but had broader and wider spine heads. It is difficult to interpret these findings in cultured cells in light of the influence of synaptic activity on spine structure in vivo.
There have been very few studies of dendritic branching in either FXS or FXPM. Early studies in patients with unclassified mental retardation (Huttenlocher, 1974; Purpura, 1974) reported reductions in length and number of dendritic branches on pyramidal neurons in cerebral cortex. In the Fmr1 KO mouse (3–4 months of age) no effects on dendritic branching were observed in Layer V pyramidal neurons of primary visual cortex (Irwin et al, 2002), and measurements in stellate cells of somatosensory cortex (barrel field) indicated increased branching on dendrites oriented toward the septa of barrels (Galvez et al, 2003). A reduction in dendritic complexity has been shown, however, in hippocampal neurons cultured from heterozygous CCG98 female mice (Chen et al., 2010). In our study of the KI model, reduction in dendritic complexity was modest in medial prefrontal cortex and on the apical tree of hippocampal pyramidal cells, but on the basal tree and in both stellate and pyramidal-like cells of the basal lateral amygdala was more pronounced.
Diminished dendritic branching and increased numbers of spines appear to be conflicting findings. The spines, however, were also increased in length suggesting that a greater fraction of the spines were of the filopodial type, and filopodial spines were unlikely to have formed synaptic contacts. This may imply diminished mature synapses in KI mice. It has been shown that in the developing nervous system synaptic input promotes further elaboration of dendritic arbors, and in the mature nervous system synaptic input stabilizes synapses by decreasing both new branch additions and branch retractions (Rajan and Cline, 1998). Diminished mature synapses in KI mice could lead to less dendritic complexity by either mechanism: either a failure to elaborate complex arbors during development or through a failure to strengthen and stabilize dendritic arbors in the mature nervous system. Our study of dendritic arbors in adult KI mice cannot distinguish between these two possibilities.
Conclusions
Our study of the adult male KI mouse model of FXPM reveals behavioral impairments, increased rCPS, and less complex dendritic arbors. The substantial reduction in the concentration of FMRP in KI mice may be responsible for these effects. Generally, it is thought that symptoms of patients with FXPM are due to the increased concentration of FMR1 mRNA in brain. Results of our study highlight similarities in phenotype between KI and Fmr1 KO mice and suggest that it is the decreased concentration of FMRP that contributes to the phenotype in young adult KI mice rather than the increased concentration of Fmr1 mRNA. In human subjects, it is likely that symptoms of FXPM that are seen with advancing age may be a function of the FMR1 mRNA toxicity, but we think that effects of reduced FMRP concentrations may be responsible for the appearance of symptoms in younger subjects.
Research Highlights.
The behavioral phenotype of CGG·CCG-repeat mice includes hyperactivity, reduced anxiety, mild social deficits, normal motor learning, deficiency on passive avoidance test
CGG·CCG-repeat mice have reduced concentrations of FMRP and increased rates of cerebral protein synthesis
Branching of dendrites is reduced in CGG·CCG-repeat mice in some regions
Dendritic spines are increased in density and length in CGG·CCG-repeat mice in some regions
Acknowledgements
We thank Zengyan Xia for overseeing the breeding colony and Tom Burlin for analyzing plasma samples for amino acid concentrations. The research was supported by the Intramural Research Programs of the National Institute of Mental Health and the National Institute of Diabetes and Digestive and Kidney Diseases, National Institutes of Health.
Abbreviations footnote
- FXS
Fragile X syndrome
- FXPM
Fragile X premutation
- FMRP
fragile X mental retardation protein
- rCPS
regional cerebral protein synthesis
- Fmr1
fragile X mental retardation-1 gene
Footnotes
Publisher's Disclaimer: This is a PDF file of an unedited manuscript that has been accepted for publication. As a service to our customers we are providing this early version of the manuscript. The manuscript will undergo copyediting, typesetting, and review of the resulting proof before it is published in its final citable form. Please note that during the production process errors may be discovered which could affect the content, and all legal disclaimers that apply to the journal pertain.
REFERENCES
- Allingham-Hawkins SJ, et al. Fragile X premutation is a significant risk factor for premature ovarian failure: The international collaborative POF in fragile X study - Preliminary data. American Journal of Medical Genetics. 1999;83:322–325. [PMC free article] [PubMed] [Google Scholar]
- Aziz M, et al. Clinical features of boys with fragile X premutations and intermediate alleles. American Journal of Medical Genetics Part B-Neuropsychiatric Genetics. 2003;121B:119–127. doi: 10.1002/ajmg.b.20030. [DOI] [PubMed] [Google Scholar]
- Birrell JM, Brown VJ. Medial frontal cortex mediates perceptual attentional set shifting in the rat. Journal of Neuroscience. 2000;20:4320–4324. doi: 10.1523/JNEUROSCI.20-11-04320.2000. [DOI] [PMC free article] [PubMed] [Google Scholar]
- Bontekoe CJM, et al. Instability of a (CGG)(98) repeat in the Fmr1 promoter. Human Molecular Genetics. 2001;10:1693–1699. doi: 10.1093/hmg/10.16.1693. [DOI] [PubMed] [Google Scholar]
- Brouwer JR, et al. CGG-repeat length and neuropathological and molecular correlates in a mouse model for fragile X-associated tremor/ataxia syndrome. Journal of Neurochemistry. 2008a;107:1671–1682. doi: 10.1111/j.1471-4159.2008.05747.x. [DOI] [PMC free article] [PubMed] [Google Scholar]
- Brouwer JR, et al. Elevated Fmr1 mRNA levels and reduced protein expression in a mouse model with an unmethylated Fragile X full mutation. Experimental Cell Research. 2007;313:244–253. doi: 10.1016/j.yexcr.2006.10.002. [DOI] [PMC free article] [PubMed] [Google Scholar]
- Brouwer JR, et al. Altered hypothalamus-pituitary-adrenal gland axis regulation in the expanded CGG-repeat mouse model for fragile X-associated tremor/ataxia syndrome. Psychoneuroendocrinology. 2008b;33:863–873. doi: 10.1016/j.psyneuen.2008.03.011. [DOI] [PMC free article] [PubMed] [Google Scholar]
- Chen YC, et al. Murine hippocampal neurons expressing Fmr1 gene premutation show early developmental deficits and late degeneration. Human Molecular Genetics. 2010;19:196–208. doi: 10.1093/hmg/ddp479. [DOI] [PMC free article] [PubMed] [Google Scholar]
- Chiang P-W, et al. The 5′ -Untranslated Region of the FMR1 Message Facilitates Translation by Internal Ribosome Entry. Journal of Biological Chemistry. 2001;276:37916–37921. doi: 10.1074/jbc.M105584200. [DOI] [PubMed] [Google Scholar]
- Cornish K, et al. The emerging fragile X premutation phenotype: Evidence from the domain of social cognition. Brain and Cognition. 2005;57:53–60. doi: 10.1016/j.bandc.2004.08.020. [DOI] [PubMed] [Google Scholar]
- Cornish KM, et al. Lifespan changes in working memory in fragile X permutation males. Brain and Cognition. 2009;69:551–558. doi: 10.1016/j.bandc.2008.11.006. [DOI] [PMC free article] [PubMed] [Google Scholar]
- Crawford DC, et al. FMR1 and the fragile X syndrome: Human genome epidemiology review. Genetics in Medicine. 2001;3:359–371. doi: 10.1097/00125817-200109000-00006. [DOI] [PMC free article] [PubMed] [Google Scholar]
- Entezam A, et al. Regional FMRP deficits and large repeat expansions into the full mutation range in a new Fragile X premutation mouse model. Gene. 2007;395:125–134. doi: 10.1016/j.gene.2007.02.026. [DOI] [PMC free article] [PubMed] [Google Scholar]
- Farzin F, et al. Autism spectrum disorders and attention-deficit/hyperactivity disorder in boys with the fragile X premutation. Journal of Developmental and Behavioral Pediatrics. 2006;27:S137–S144. doi: 10.1097/00004703-200604002-00012. [DOI] [PubMed] [Google Scholar]
- Feng Y, et al. TRANSLATIONAL SUPPRESSION BY TRINUCLEOTIDE REPEAT EXPANSION AT FMR1. Science. 1995;268:731–734. doi: 10.1126/science.7732383. [DOI] [PubMed] [Google Scholar]
- Fu YH, et al. VARIATION OF THE CGG REPEAT AT THE FRAGILE-X SITE RESULTS IN GENETIC INSTABILITY - RESOLUTION OF THE SHERMAN PARADOX. Cell. 1991;67:1047–1058. doi: 10.1016/0092-8674(91)90283-5. [DOI] [PubMed] [Google Scholar]
- Galvez R, et al. Somatosensory cortical barrel dendritic abnormalities in a mouse model of the fragile X mental retardation syndrome. Brain Research. 2003;971:83–89. doi: 10.1016/s0006-8993(03)02363-1. [DOI] [PubMed] [Google Scholar]
- Hagerman RJ. The physical and behavioral phenotype. In: Hagerman RJ, Hagerman PJ, editors. Fragile X syndrome: Diagnosis, treatment, and research. Baltimore: Johns Hopkins University Press; 2002. pp. 3–109. [Google Scholar]
- Hagerman RJ, et al. Intention tremor, parkinsonism, and generalized brain atrophy in male carriers of fragile X. Neurology. 2001;57:127–130. doi: 10.1212/wnl.57.1.127. [DOI] [PubMed] [Google Scholar]
- Hagerman RJ, et al. Learning-disabled males with a fragile X CGG expansion in the upper premutation size range. Pediatrics. 1996;97:122–126. [PubMed] [Google Scholar]
- Hessl D, et al. Abnormal elevation of FMR1 mRNA is associated with psychological symptoms in individuals with the fragile X premutation. American Journal of Medical Genetics Part B: Neuropsychiatric Genetics. 2005;139B:115–121. doi: 10.1002/ajmg.b.30241. [DOI] [PubMed] [Google Scholar]
- Hessl D, et al. Amygdala dysfunction in men with the fragile X premutation. Brain. 2007;130:404–416. doi: 10.1093/brain/awl338. [DOI] [PubMed] [Google Scholar]
- Hinton VJ, et al. ANALYSIS OF NEOCORTEX IN 3 MALES WITH THE FRAGILE-X SYNDROME. American Journal of Medical Genetics. 1991;41:289–294. doi: 10.1002/ajmg.1320410306. [DOI] [PubMed] [Google Scholar]
- Hoffman GE, et al. Detecting steroidal effects on immediate early gene expression in the hypothalamus. Neuroprotocols. 1992;1:52–66. [Google Scholar]
- Hunsaker MR, et al. Progressive Spatial Processing Deficits in a Mouse Model of the Fragile X Premutation. Behavioral Neuroscience. 2009;123:1315–1324. doi: 10.1037/a0017616. [DOI] [PMC free article] [PubMed] [Google Scholar]
- Hunter JE, et al. Investigation of phenotypes associated with mood and anxiety among male and female fragile X premutation carriers. Behavior Genetics. 2008;38:493–502. doi: 10.1007/s10519-008-9214-3. [DOI] [PMC free article] [PubMed] [Google Scholar]
- Huttenlo Pr. DENDRITIC DEVELOPMENT IN NEOCORTEX OF CHILDREN WITH MENTAL DEFECT AND INFANTILE SPASMS. Neurology. 1974;24:203–210. doi: 10.1212/wnl.24.3.203. [DOI] [PubMed] [Google Scholar]
- Irwin SA, et al. Abnormal dendritic spine characteristics in the temporal and visual cortices of patients with fragile-X syndrome: A quantitative examination. American Journal of Medical Genetics. 2001;98:161–167. doi: 10.1002/1096-8628(20010115)98:2<161::aid-ajmg1025>3.0.co;2-b. [DOI] [PubMed] [Google Scholar]
- Jin P, et al. RNA-mediated neurodegeneration caused by the fragile X premutation rCGG repeats in Drosophila. Neuron. 2003;39:739–747. doi: 10.1016/s0896-6273(03)00533-6. [DOI] [PubMed] [Google Scholar]
- Kenneson A, et al. Reduced FMRP and increased FMR1 transcription is proportionally associated with CGG repeat number in intermediate-length and premutation carriers. Hum. Mol. Genet. 2001;10:1449–1454. doi: 10.1093/hmg/10.14.1449. [DOI] [PubMed] [Google Scholar]
- Kogan CS, et al. Impact of the Fragile X Mental Retardation 1 (FMR1) gene premutation on neuropsychiatric functioning in adult males without fragile X-associated Tremor/Ataxia Syndrome: A controlled study. American Journal of Medical Genetics Part B-Neuropsychiatric Genetics. 2008;147B:859–872. doi: 10.1002/ajmg.b.30685. [DOI] [PubMed] [Google Scholar]
- Laggerbauer B, et al. Evidence that fragile X mental retardation protein is a negative regulator of translation. Human Molecular Genetics. 2001;10:329–338. doi: 10.1093/hmg/10.4.329. [DOI] [PubMed] [Google Scholar]
- Li ZZ, et al. The fragile X mental retardation protein inhibits translation via interacting with mRNA. Nucleic Acids Research. 2001;29:2276–2283. doi: 10.1093/nar/29.11.2276. [DOI] [PMC free article] [PubMed] [Google Scholar]
- Liu Z-H, et al. Lithium ameliorates phenotypic deficits in a mouse model of fragile X syndrome. The International Journal of Neuropsychopharmacology. 2010;(First View):1–13. doi: 10.1017/S1461145710000520. [DOI] [PMC free article] [PubMed] [Google Scholar]
- Liu ZH, Smith CB. Dissociation of social and nonsocial anxiety in a mouse model of fragile X syndrome. Neuroscience Letters. 2009;454:62–66. doi: 10.1016/j.neulet.2009.02.066. [DOI] [PMC free article] [PubMed] [Google Scholar]
- Loesch DZ, et al. Effect of the fragile X status categories and the fragile X mental retardation protein levels on executive functioning in males and females with fragile X. Neuropsychology. 2003a;17:646–657. doi: 10.1037/0894-4105.17.4.646. [DOI] [PubMed] [Google Scholar]
- Loesch DZ, et al. TRANSMITTING MALES AND CARRIER FEMALES IN FRAGILE-X -REVISITED. American Journal of Medical Genetics. 1994;51:392–399. doi: 10.1002/ajmg.1320510418. [DOI] [PubMed] [Google Scholar]
- Loesch DZ, et al. Effect of fragile x status categories and FMRP deficits on cognitive profiles estimated by robust pedigree analysis. American Journal of Medical Genetics Part A. 2003b;122A:13–23. doi: 10.1002/ajmg.a.20214. [DOI] [PubMed] [Google Scholar]
- Moon J, et al. Impaired inhibitory control, sustained attention, and adaptability to change in FMR1 knockout (KO) mice: A mouse model of fragile X syndrome (FXS) Neurotoxicology and Teratology. 2006;28:419–419. [Google Scholar]
- Muir JL, et al. The cerebral cortex of the rat and visual attentional function: Dissociable effects of mediofrontal, cingulate, anterior dorsolateral, and parietal cortex lesions on a five-choice serial reaction time task. Cerebral Cortex. 1996;6:470–481. doi: 10.1093/cercor/6.3.470. [DOI] [PubMed] [Google Scholar]
- Nadler JJ, et al. Automated apparatus for quantitation of social approach behaviors in mice. Genes Brain and Behavior. 2004;3:303–314. doi: 10.1111/j.1601-183X.2004.00071.x. [DOI] [PubMed] [Google Scholar]
- Paxinos G, FKBJ . The mouse brain in stereotaxic coordinates. New York: Academic Press; 2001. [Google Scholar]
- Peier AM, et al. (Over)correction of FMR1 deficiency with YAC transgenics: behavioral and physical features. Human Molecular Genetics. 2000;9:1145–1159. doi: 10.1093/hmg/9.8.1145. [DOI] [PubMed] [Google Scholar]
- Pinkstaff JK, et al. Internal initiation of translation of five dendritically localized neuronal mRNAs. Proceedings of the National Academy of Sciences of the United States of America. 2001;98:2770–2775. doi: 10.1073/pnas.051623398. [DOI] [PMC free article] [PubMed] [Google Scholar]
- Purpura DP. DENDRITIC SPINE DYSGENESIS AND MENTAL-RETARDATION. Science. 1974;186:1126–1128. doi: 10.1126/science.186.4169.1126. [DOI] [PubMed] [Google Scholar]
- Qin M, et al. Post-adolescent changes in regional cerebral protein synthesis: An in vivo study in the Fmr1 null mouse. Journal of Neuroscience. 2005;25:5087–5095. doi: 10.1523/JNEUROSCI.0093-05.2005. [DOI] [PMC free article] [PubMed] [Google Scholar]
- Qin M, et al. Increased rates of cerebral glucose metabolism in a mouse model of fragile X mental retardation. Proceedings of the National Academy of Sciences of the United States of America. 2002;99:15758–15763. doi: 10.1073/pnas.242377399. [DOI] [PMC free article] [PubMed] [Google Scholar]
- Rajan I, Cline HT. Glutamate receptor activity is required for normal development of tectal cells dendrites in vivo. Journal of Neuroscience. 1998;18:7836–7846. doi: 10.1523/JNEUROSCI.18-19-07836.1998. [DOI] [PMC free article] [PubMed] [Google Scholar]
- Shepherd JK, et al. Behavioral and Pharmacological Characterization of the Elevated Zero-Maze as an Animal-Model of Anxiety. Psychopharmacology. 1994;116:56–64. doi: 10.1007/BF02244871. [DOI] [PubMed] [Google Scholar]
- Smith CB, et al. Measurement of local cerebral protein synthesis in vivo: influence of recycling of amino acids derived from protein degradation. Proceedings of the National Academy of Sciences of the United States of America. 1988;85:9341–9345. doi: 10.1073/pnas.85.23.9341. [DOI] [PMC free article] [PubMed] [Google Scholar]
- Tassone F, et al. Elevated levels of FMR1 mRNA in carrier males: A new mechanism of involvement in the fragile-X syndrome. American Journal of Human Genetics. 2000a;66:6–15. doi: 10.1086/302720. [DOI] [PMC free article] [PubMed] [Google Scholar]
- Tassone F, et al. Clinical involvement and protein expression in individuals with the FMR1 premutation. American Journal of Medical Genetics. 2000b;91:144–152. doi: 10.1002/(sici)1096-8628(20000313)91:2<144::aid-ajmg14>3.0.co;2-v. [DOI] [PubMed] [Google Scholar]
- The Dutch-Belgian Fragile XC, et al. Fmr1 knockout mice: A model to study fragile X mental retardation. Cell. 1994;78:23–33. [PubMed] [Google Scholar]
- Van Dam D, et al. Cognitive decline, neuromotor and behavioural disturbances in a mouse model for fragile-X-associated tremor/ataxia syndrome (FXTAS) Behavioural Brain Research. 2005;162:233–239. doi: 10.1016/j.bbr.2005.03.007. [DOI] [PubMed] [Google Scholar]
- Verkerk A, et al. IDENTIFICATION OF A GENE (FMR-1) CONTAINING A CGG REPEAT COINCIDENT WITH A BREAKPOINT CLUSTER REGION EXHIBITING LENGTH VARIATION IN FRAGILE-X SYNDROME. Cell. 1991;65:905–914. doi: 10.1016/0092-8674(91)90397-h. [DOI] [PubMed] [Google Scholar]
- Willemsen R, et al. The FMR1 CGG repeat mouse displays ubiquitin-positive intranuclear neuronal inclusions; implications for the cerebellar tremor/ataxia syndrome. Human Molecular Genetics. 2003;12:949–959. doi: 10.1093/hmg/ddg114. [DOI] [PubMed] [Google Scholar]
- Zhang YQ, et al. Drosophila fragile X-related gene regulates the MAP1B homolog Futsch to control synaptic structure and function. Cell. 2001;107:591–603. doi: 10.1016/s0092-8674(01)00589-x. [DOI] [PubMed] [Google Scholar]


