Abstract
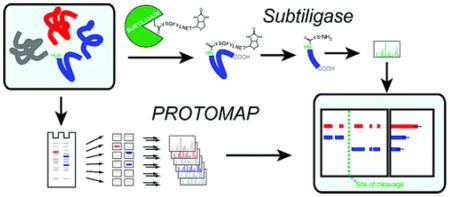
Two proteomic methods were recently introduced to globally map proteolytic cleavage events in biological systems, one that characterized proteolyzed proteins by differential gel migration (PROTOMAP) and the other by enzymatic tagging and enrichment of the nascent N-terminal peptides generated by proteolysis (Subtiligase). Both technologies were applied to apoptosis, and each uncovered hundreds of novel proteolytic events. An initial survey, however, revealed only minimal overlap in the two data sets. In this article, we perform an in-depth comparative analysis of the PROTOMAP and Subtiligase results that assimilates the complementary information acquired by each method. This analysis uncovered substantial agreement between the PROTOMAP and Subtiligase data sets, which in integrated form yield a highly enriched portrait of the proteome-wide impact of proteolysis in apoptosis. We discuss the respective strengths of each proteomic method and the potential for these technologies to expand the scope and sensitivity of large-scale studies of proteolysis in biological systems.
Apoptosis is a highly conserved form of cell death observed in nearly all multicellular organisms that plays an essential role in physiological processes such as tissue development and cellular stress response (1). It involves an organized cascade of proteolytic events that begins with one of various death signals that activate an initiator caspase(s), which in turn activates a set of executioner caspases that carry out an orderly disruption of cellular function, ultimately leading to cell death.
Beyond an obvious motivation to understand the mechanisms of apoptosis, researchers have focused on this cellular process as a “proving ground” for new proteomic techniques aimed toward the global characterization of proteolytic events in biological systems (2). Apoptosis offers several advantages for such technology validation studies, including convenient and well-controlled cellular models, a set of participating proteases (caspases) with well-defined cleavage specificities, and a large number of proteins already known to undergo caspase-mediated proteolysis (positive control events). Furthermore, the myriad array of cellular processes impacted during apoptosis suggests the existence of many more endogenous caspase substrates awaiting discovery. The earliest attempts to catalogue endogenous caspase substrates cleaved during apoptosis date back to the mid-1990s and involved gel-based approaches such as two-dimensional (2-DE) and diagonal gel electrophoresis (3–6). These techniques suffer from limited sensitivity and resolution and therefore only succeeded in identifying ~10–20 of the most abundant caspase substrates. The advent of chemical N-terminal labeling approaches in the early 2000s substantially increased the number of caspase substrates that could be identified in a single experiment (2, 7). Such approaches use either positive or negative selection to capture the N-terminal peptides of proteins and can be used to comparatively profile these peptides in biological settings of altered proteolysis. N-Terminal peptides that appear in experimental but not control proteomes and that fall within the interior of the primary protein sequence are designated as candidate protease substrates. The boost in sensitivity afforded by enriching N-termini and the application of modern mass-spectrometry-based proteomic methods led to the identification of dozens of caspase substrates in a single experiment.
Recently, a group led by James Wells at UCSF developed an advanced N-terminal labeling strategy that uses the engineered enzyme Subtiligase, rather than traditional chemical approaches, to tag and capture the N-termini of proteins (8) (Figure 1). N-Terminal labeling depends on selective modification of amines at the N-termini of proteins without modifying other free amines in the proteome (e.g., lysines). This can be difficult to accomplish with conventional chemical labeling techniques, given that the N-terminal amine is only slightly more nucleophilic than lysine amines and the latter species out-number the former many fold in the proteome. The Subtiligase method cleverly circumvents this problem because the peptide ligation reaction catalyzed by this enzyme is exquisitely selective for N-terminal amines over lysine side chains. While the N-termini of intact (i.e., uncleaved) proteins are also labeled, it has been found that roughly 80% of protein N-termini are endogenously blocked by modifications such as acetylation. Subtiligase is used to covalently attach a biotinylated peptide containing a TEV protease consensus sequence to free N-termini. These peptides are then positively enriched by capture with avidin and eluted using the TEV protease. Internal N-terminal peptides [“N-terminopes” (9)] that are detected in apoptotic but not control samples are considered direct evidence of proteolytic cleavage. This approach excels as a result of the high specificity of Subtiligase, as well as the added advantage that labeled peptides retain a two-amino-acid signature from the linker peptide, thereby providing unambiguous evidence of capture and elution.
Figure 1.
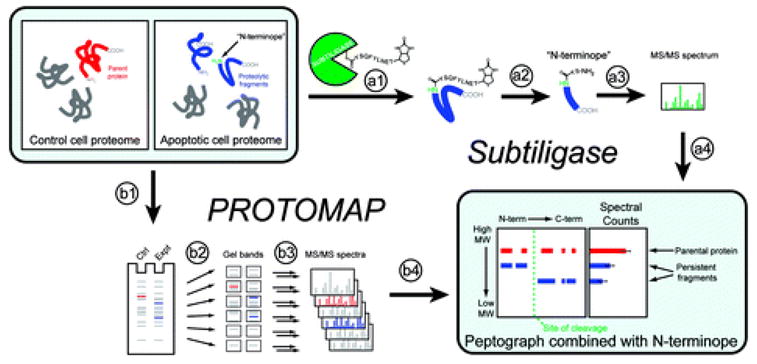
Overview of Subtiligase and PROTOMAP methods. Comparison of healthy and apoptotic cell proteomes was accomplished using two complementary techniques. The Subtiligase method utilizes an engineered enzyme (a1) “subtiligase” that covalently reacts with a custom biotinylated peptide ester containing a TEV protease cleavage site. Subtiligase then selectively transfers this biotinylated peptide to free amines on the N-termini of proteins. (a2) Proteins are digested with trypsin, and “N-terminopes”, peptides corresponding to the N-termini of proteins, are purified with avidin affinity chromatography and elution with TEV protease. N-Terminopes are then (a3) sequenced using LC-MS/MS, and internally located N-terminopes that are found in apoptotic but not control proteomes are considered to be direct evidence of proteolytic cleavage and can be (a4) combined with the topographical information provided by PROTOMAP data. The PROTOMAP approach begins with (b1) separation of control and apoptotic proteins in distinct lanes of a 1D SDS–PAGE gel. (b2) Each lane is then sliced into evenly sized bands and (b3) proteins in each band are in-gel digested with trypsin and sequenced via LC-MS/MS. The resulting (b4) peptides are bioinformatically integrated into a “peptograph”, which plots peptides from control and apoptotic samples in red and blue, respectively, according to their position in the primary sequence of each protein from left to right (N- to C-terminus) and their position in the gel, from top to bottom (high to low molecular weight), thereby revealing changes in gel migration and topography such as would be expected upon proteolysis. The combination of peptographs with N-terminopes provides a near-complete description of each proteolytic event.
A complementary approach has concurrently been developed by our lab that involves detection of shifts in 1D gel migration for proteins to globally profile proteolytic events in biological systems (10) (Figure 1). This approach, termed PROTOMAP, for Protein Topography and Migration Analysis Platform, is conceptually similar to differential 2DE, although it overcomes many of the limitations of 2DE and introduces novel bioinformatic tools for analysis and interpretation of data. PROTOMAP experiments begin with separation of control and experimental samples by 1D SDS–PAGE after which gel lanes are sliced into ~20 evenly spaced bands. These bands are then in-gel digested with trypsin and individually analyzed by reverse-phase LC-MS/MS. Finally, peptide-sequence information from each gel band is integrated into peptographs, which enable clear visualization of shifts in migration and changes in topography between control and experimental samples.
Serendipitously, both the Wells lab and our group applied our respective proteomic methods to characterize the intrinsic apoptotic pathway in Jurkat T-cells. Although slight differences in experimental methodology were employed (e.g., different stimuli to induce apoptosis), we anticipated that the approaches were similar enough to reasonably allow direct comparison of the data sets. Indeed, an initial attempt to draw such comparisons was made in a commentary by Johnson and Kornbluth (11). One conclusion from this comparison was that the two data sets display minimal overlap with each other (20–25% of proteins in common) and a similarly limited concordance with a previously compiled list of caspase substrates (the CASBAH (12)). While this is a correct interpretation from a preliminary analysis of the respective data sets, we were surprised that the overlap was not larger and sought potential explanations for this apparent conundrum. There are several possible reasons for an apparently small overlap in the two proteomic studies: (i) both data sets are largely accurate but not comprehensive, suggesting that the total number of apoptotic substrates is much larger than the quantity of events detected by either method; (ii) one or both of the data sets has a high rate of false positives; or (iii) the overlap between the data sets is actually substantially higher than initially reported due to conservative interpretation of the original results. Here, we show that the third scenario is indeed the case and argue further that the Subtiligase and PROTOMAP data sets, when taken together, may paint a nearly comprehensive picture of intrinsic apoptosis in Jurkat T-cells. Furthermore, we present a thorough discussion of the relative merits of N-terminal labeling and PROTOMAP-type approaches for protease substrate discovery and advocate for the value of combining both platforms.
Characterization of the High Overlap between the Subtiligase and PROTOMAP Data Sets
The most important questions to address when comparing large-scale experiments are how much of the data are in agreement and what, if any, general conclusions can be drawn from their comparison. A previous commentary noted that, of the 292 and 261 cleaved proteins identified in the Subtiligase and PROTOMAP studies, 64 proteins were classified as cleaved in both data sets (11). This represents a 20–25% overlap which, prima facie, is rather unsatisfying. Somewhat surprised by this apparent outcome, we elected to perform a more thorough comparison of the Subtiligase and PROTOMAP data sets, wherein we expanded the analysis to include all proteins detected by PROTOMAP. This comparison takes advantage of a key attribute of PROTOMAP, namely, that the method generates peptographs (and thus descriptions) of all detectable proteins regardless of whether they are proteolytically cleaved. In other words, assuming that most of the cleaved proteins identified in the Subtiligase investigation were detectable in the PROTOMAP study (which proved to be the case; see below), we could evaluate the peptographs for these proteins to shed light on why some were designated as cleaved by PROTOMAP and others were not. We anticipated that this comparison might also reveal whether our initial criteria for assigning proteolytic events by PROTOMAP were excessively stringent, especially when judged in the context of the site of the cleavage information provided by the Subtiligase study.
Several criteria were used to generate the original list of 261 cleaved proteins in the PROTOMAP study. Cleaved proteins were required to show (i) at least 30 total spectral counts in the four replicate proteomic samples, (ii) a ≥ 5-fold change in spectral counts between control and apoptotic samples for either the parental form of the protein or the “fragment” (fastest migrating peptides in the apoptotic sample), and (iii) at least two distinct and unique peptides that provide evidence of a fragment (for those proteins in which a persistent fragment was the primary criteria for inclusion) (10). These criteria are not hard-wired values but rather adjustable parameters set by the experimenter to achieve a desired level of stringency when analyzing this intrinsically descriptive data. In our case, we chose conservative criteria to minimize false positive results (uncleaved proteins incorrectly assigned), at the risk of possibly sacrificing valid positive data (false negatives, cleaved proteins that were not designated as such). In our re-analysis we relaxed these parameters, as well as applied recently established statistical techniques for mass spectrometry data analysis that increase the quantity of acquired proteomic information (boosting average sequence coverage and spectral counts per protein by 19% and 20%, respectively). Briefly, the data were re-searched using DTASelect version 2.0 (13, 14), which achieves an investigator-defined low false-positive rate using an empirically based linear discriminant analysis. Additionally, we employed the “trypstat” option, which performs separate linear discriminant analyses on fully tryptic and half-tryptic peptides, which effectively relaxes quality thresholds on the fully tryptic peptides, thereby increasing sensitivity, while increasing the stringency of half-tryptic peptides, ultimately achieving the same low false-positive rate (15).
It is important to note that although only 261 proteins met the original criteria for cleavage in the PROTOMAP study, over 3000 total proteins were detected in the soluble proteome of Jurkat cells, and peptographs were generated for all of these proteins (regardless of cleavage status), which enables manual re-analysis of those proteins detected in the Wells study. Over 75% of the proteins for which N-terminopes were identified were also detected by PROTOMAP (with at least 5 spectral counts), and upon manual inspection, many of their peptographs showed evidence of cleavage consistent with the N-terminopes assigned in the Subtiligase study (Figure 2 and Supplemental Table 1). Beyond the 64 proteins previously noted as being cleaved in both the Subtiligase and PROTOMAP studies, 24 additional cleaved proteins were, in fact, included in a supplemental table in the original PROTOMAP study [Supplemental Table 2 in ref 10], which contained low-abundance proteins (<30 total spectral counts) that displayed compelling evidence of cleavage (e.g., RPAP3, Figure 3). An additional 79 proteins that did not show compelling evidence of cleavage in the soluble proteome of Jurkat cells at the 4 h time point following induction of apoptosis (the only fraction computationally analyzed in full in the original PROTOMAP study) displayed clear evidence of cleavage consistent with the N-terminope identified in the Subtiligase study in either the particulate fraction (e.g., BAP31, Figure 4) or at distinct time points (e.g., 6 h). Finally, an additional 21 proteins fell into a third category in which the site of cleavage provided by the N-terminope lies very near the N- or C-terminus of the protein such that no detectable shift in migration would be expected (e.g., NFKB2, Figure 5). (We have found that shifts of greater than 15% in protein mass can be resolved in nearly all regions of the gel by PROTOMAP. Cleavage events that generate a smaller mass shift are usually missed due to insufficient change in gel migration rates for proteins.) These peptographs, while not themselves providing evidence of cleavage, can be said to be consistent with the site of cleavage predicted by the Subtiligase method, and we therefore included them in a list of “overlapping” results between the two studies (Figure 2). All told, these considerations bring the total percentage of cleaved proteins detected by PROTOMAP that displayed evidence of proteolysis consistent with the Subtiligase results to 88%. Assuming further that these proteomic methods do not share a systematic bias in the types of proteins that they profile, then the high degree of overlap in their data sets suggests that, together, they may provide a nearly comprehensive picture of proteolytic events in apoptotic Jurkat T-cells. That said, it is likely that both techniques, as is true for all proteomic methods, are biased toward proteins of higher abundance and that caspase substrates present at low copy numbers may be overlooked in these types of analyses.
Figure 2.
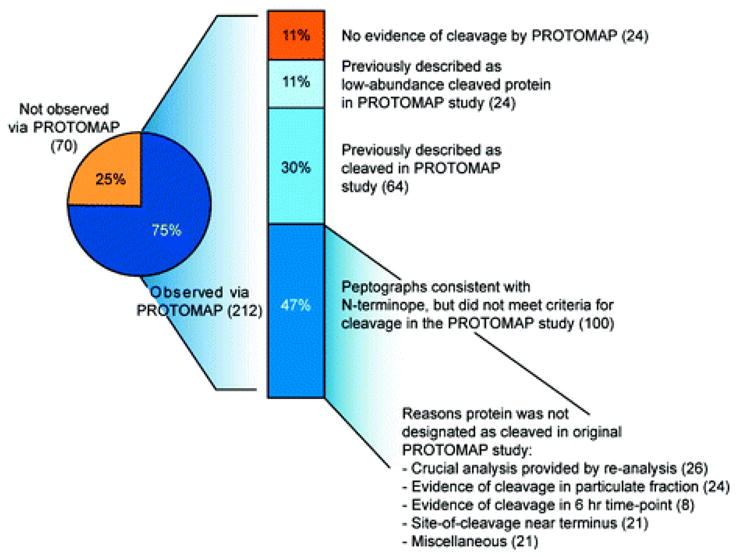
Analysis of the overlap between the Subtiligase and PROTOMAP data sets. The pie chart shows that 75% of the proteins detected as cleaved with the Subtiligase approach generated interpretable peptographs in the PROTOMAP study. Of these 212 proteins, 88% showed patterns that were consistent with the cleavage event predicted by the N-terminope (see Supplementary Table 1 for a direct comparison). Eighty-eight proteins were included in one of the two supplemental tables from the original PROTOMAP study describing cleaved proteins, whereas an additional 100 proteins were not designated as “cleaved” in this study for a variety of reasons: many proteins only displayed evidence of cleavage in the particulate fraction or a later time point (24 and 8, respectively). Additionally, re-analysis of the data with advanced statistical techniques identified peptographs that provide clear evidence of cleavage for many (26) low-abundance proteins and persistent fragments. See Supplementary Table 1 for the complete integration of the Subtiligase and PROTOMAP data sets.
Figure 3.
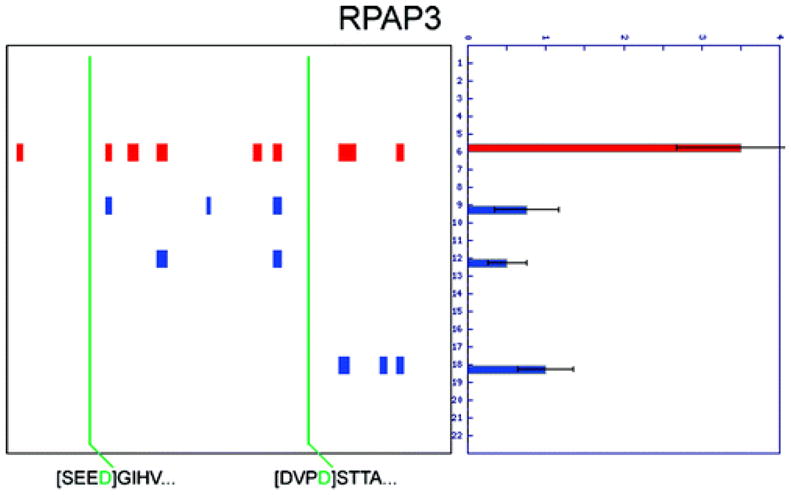
Evidence of cleavage for low-abundance proteins. RNA polymerase II-associated protein 3 (RPAP3) was detected with only 23 total spectral counts, below the original threshold of 30 spectral counts required to make confident assignments by PROTOMAP. However, at least three cleavage events are evident that are consistent with the two N-terminopes detected by the Subtiligase approach.
Figure 4.
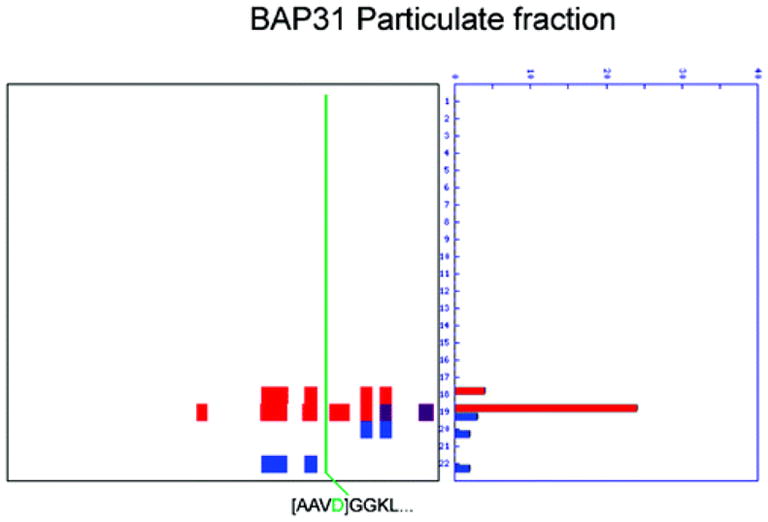
Evidence of cleavage found in the particulate fraction. B-Cell receptor-associated protein 31 (BAP31) was not included in the original PROTOMAP study because of insufficient abundance in the soluble fraction; however, inspection of the peptograph from the particulate fraction reveals clear evidence of cleavage that is consistent with the N-terminope detected in the Subtiligase study.
Figure 5.
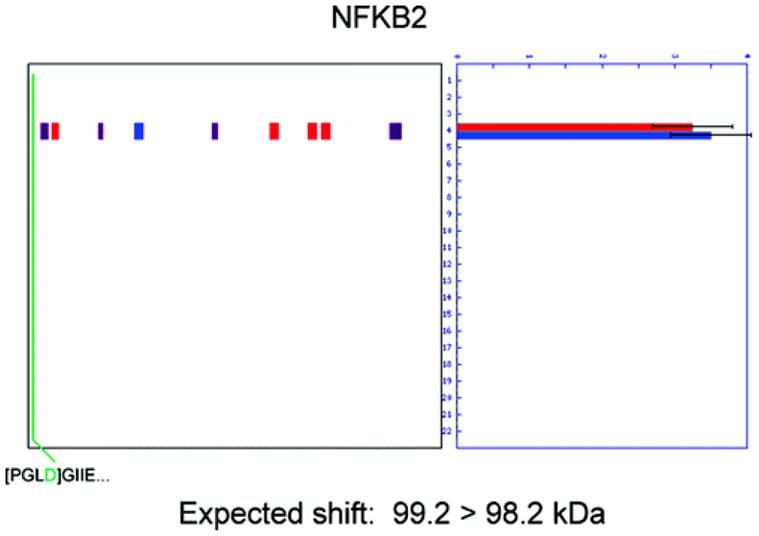
Cleavage events that are too near the termini of proteins to produce shifts in gel migration. The N-terminopes for several proteins are found so close to one terminus that no shift in gel migration is expected. In the case of NFKB2, the N-terminope detected with Subtiligase indicates a caspase cleavage event occurred at D10 that is predicted to cause a change in molecular weight from 99.2 to 98.2 kDa. No shift in gel migration is seen by PROTOMAP; however, these results can be said to be in agreement because no gel shift would be expected for such a small change in protein molecular weight.
Here it is worth noting that in addition to the 186 proteins found to be in good agreement between the two studies, another 197 proteins were classified as high-confidence substrates in the PROTOMAP study that were not observed by Subtiligase. One might suspect that these non-overlapping cleavage events are of lower confidence or accuracy than those found in both the PROTOMAP and Subtiligase studies. Arguing against this premise, however, a similar percentage of overlapping and non-overlapping cleavage events were found in the CASBAH database of established caspase substrates (data not shown).
Acquisition of Synergistic Information by Combining Subtiligase and PROTOMAP Data Sets
Because the Subtiligase approach identifies precise sites of cleavage, often with extraordinarily high sensitivity, it offers a powerful complement to the topographical maps of proteolysis provided by PROTOMAP. The original PROTOMAP study serendipitously identified precise sites of cleavage for approximately 25% of the cleaved proteins in apoptotic cells (10). For some of the remaining proteins, an implicit site of cleavage could be inferred from the topography of the fragments, as there is only a single candidate aspartate within the range bounded by persistent fragments. For many other proteins, however, multiple candidate aspartates exist and, without further experimental validation, the actual scissile residue cannot be deduced. As one representative example, transducin β-like 1 X-linked receptor 1, TBL1XR1, is cleaved leaving a C-terminal persistent fragment containing the WD40 repeat domain (Figure 6). However, despite relatively high abundance and sequence coverage, no half-tryptic peptides were detected by PROTOMAP. Furthermore, three aspartate residues are found within 20 amino acids of the N-terminal boundary of the persistent fragment, making it impossible to infer an implicit site of cleavage (Figure 6). Fortunately, the Subtiligase study detected an N-terminope that identifies the precise site of cleavage as MEVD152, thereby highlighting the limitations of topography-based descriptions of proteolysis and the value of N-terminope mapping, wherein an enrichment of cleaved peptides enables characterization of otherwise difficult-to-detect half-tryptic peptides.
Figure 6.
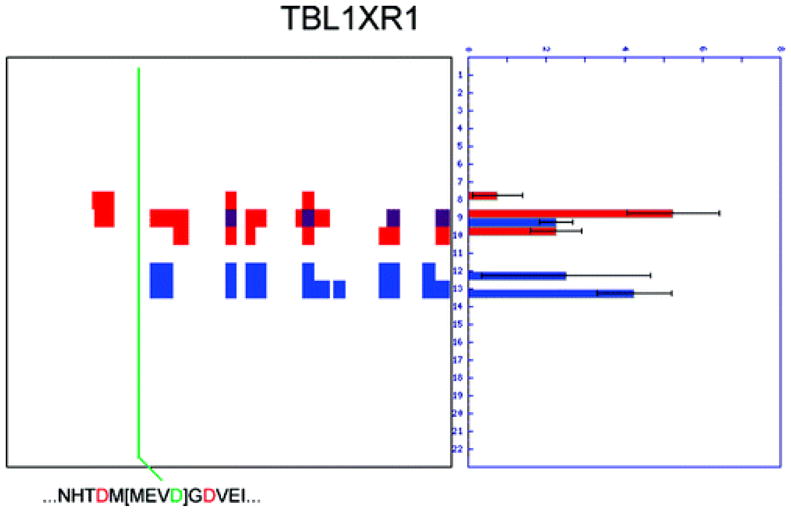
Subtiligase can reveal sites of cleavage that are otherwise difficult to detect. Proteolysis of TBL1XR1 is clearly evident from the peptograph for this protein; however, a precise site of cleavage was not detected by PROTOMAP. An N-terminope was detected that identifies the scissile residue as MEVD152, thereby underscoring the value of peptide enrichment achieved with the Subtiligase strategy.
This is not to suggest that mapping N-terminopes should be the sole preferred method of protease substrate discovery. Indeed, while N-terminal labeling approaches can often provide the precise site of cleavage with great accuracy and sensitivity, such studies necessarily overlook the diversity of fates that can befall proteins following proteolysis. Proteolytic fragments can persist with different rates (or not at all) as shown in the original PROTOMAP study (10), indicating that the binary information (e.g., “cleaved” or “not cleaved”) provided by N-terminal labeling approaches is often insufficiently descriptive to predict the functional outcome of a proteolytic event. Furthermore, N-terminal labeling relies on the detection of a single peptide (containing the scissile residue) to identify cleavage events, and some such peptides may prove difficult or impossible to identify by mass spectrometry, depending on their physicochemical properties and the proximity of lysines and arginines to the scissile residue. One protein that speaks to this point and demonstrates the utility of topographic mapping of protein fragments following proteolysis is G-patch and KOW domain containing protein (GPKOW, Figure 7). Two N-terminopes for this protein were detected by the Subtiligase approach, indicating cleavage at D37 and D98; however, a third cleavage event toward the C-terminus is evident from the peptograph for GPKOW. The third cleavage site responsible for generating the C-terminal fragment of GPKOW has been previously reported in the literature [D341 (12)] but was understandably difficult to detect by Subtiligase methods because the predicted N-terminope has the sequence D.GPAAK.S, which is not unique in the proteome and too small to be unambiguously sequenced by conventional mass spectrometry techniques. Furthermore, the knowledge that multiple cleavage events occur does not reveal anything about the relative stability of the various fragments that could be produced. From the peptograph, it is clear that two internal fragments containing the G-patch domain are relatively stable, as is a small C-terminal domain that does not map to any predicted domains. Thus, PROTOMAP defined one of many possible fragmentation profiles that could have been imagined for a protein with three cleavage sites. This information about the relative stability of cleavage fragments is difficult to infer with peptide-centric approaches and is often crucial for functional interpretation of proteolytic events.
Figure 7.
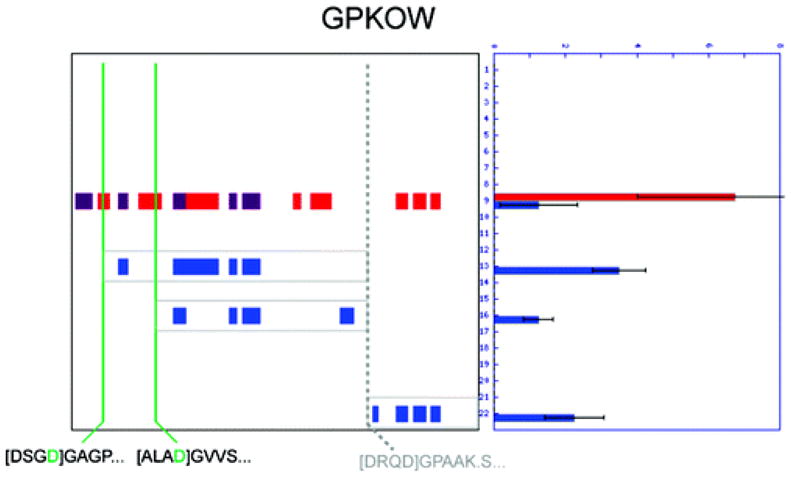
PROTOMAP and Subtiligase provide complementary and synergistic information content-mapping the topographical impact of multiple cleavage events. The often complex nature of proteolytic cleavage is exemplified by the GPKOW protein, in which three persistent fragments are evident from the peptograph (outlined in gray). Only two N-terminopes were detected (shown in green), but a third cleavage event (occurring at DRQD341) is known from the literature (12) and can also be inferred from the topography of persistent fragments detected by PROTOMAP. It is also clear from the migration rates and topography that the N-terminal portion of GPKOW has already been cleaved from the other two (internal) persistent fragments. Such a complete description of a complex proteolytic event probably could not be obtained without combining gel-based and peptide-centric approaches.
Finally, it is important to emphasize insights that can be gleaned by combining both types of data. Highly abundant proteins often “drag” across multiple bands in PROTOMAP studies, and it can be difficult to distinguish minor degradation of these proteins from bona fide proteolysis. One such protein from the Jurkat apoptosis study is myosin-9 (MYH9), a highly abundant cytoskeletal protein that displayed a sufficiently diffuse peptograph to prevent unambiguous classification as a cleaved protein in apoptotic cells (Figure 8). That an N-terminope was detected in the middle of MYH9 confirmed it as a true apoptotic caspase substrate (this N-terminope also neatly bounds a persistent fragment that is more easily observed by PROTOMAP in the particulate fraction of apoptoic cells; Figure 8). Of course, the primary reason that this cleavage event is obscured in the PROTOMAP study is because MYH9 undergoes very limited proteolysis in apoptotic cells (i.e., the majority of the parental protein remains intact in these cells). Thus, the magnitude of cleavage information provided by PROTOMAP is valuable for interpreting the potential functional consequences of such low-magnitude proteolytic events, which might be sufficient to trigger activating events that generate new functional forms of a protein like MYH9 but would be unlikely to reflect inactivating events that disable the parental protein’s function. The opposite conclusion could be ascribed to high-magnitude proteolytic events, which often result in the complete disappearance of the parental forms of cleaved proteins (10). These examples thus underscore the complementary information provided by the Subtiligase and PROTOMAP methods.
Figure 8.

PROTOMAP and Subtiligase provide complementary and synergistic information content-mapping low-magnitude cleavage events in abundant proteins. In this example, it is clear from the peptograph of MYH9 in the soluble fraction that the magnitude of cleavage is small and obscured by the bleeding of this abundant protein into lower molecular weight regions of the gel. An N-terminope was nonetheless detected in the middle of the protein by the Subtiligase method, thereby confirming proteolysis (and persistent fragments corresponding to this site of cleavage can be observed in the particulate fraction; right peptograph). The peptographs generated by PROTOMAP confirm this protelytic event as minor in magnitude with the majority of the parent protein remaining intact.
In summary, we herein describe an in-depth comparison of the data provided by two recently developed mass-spectrometry-based proteomic platforms for characterizing proteolytic events in biological systems. By surveying the complete data sets generated with both methods applied to apoptotic cells, we find that the majority of results are in good agreement. Assuming that there is no shared bias in terms of the types of proteins identified by the Subtiligase and PROTOMAP methods, the substantial overlap in their data sets suggest that we may be approaching a comprehensive description of proteolytic events in apoptosis, at least in Jurkat T cells. The fact that apoptosis was induced by different mechanisms in the Subtiligase and PROTOMAP studies (etoposide and staurosporine, respectively) further indicates a high degree of commonality among the proteolytic events generated by distinct intrinsic stimuli. Whether extrinsic apoptotic stimuli will also produce a similar proteolytic profile remains to be determined. Finally, our analysis argues that unique and complementary functional insights are captured by the Subtiligase and PROTOMAP methods, leading us to advocate combining these platforms for studies in which a truly comprehensive picture of proteolytic events is desired.
Supplementary Material
Acknowledgments
We thank James A. Wells and members of his laboratory for sharing data and insightful comments on this manuscript. This work was supported by the National Institutes of Health (CA087660), the ARCS Foundation (G.M.S.), a Koshland Graduate Fellowship in Enzyme Biochemistry (G.M.S.), and the Skaggs Institute for Chemical Biology.
Footnotes
This material is available free of charge via the Internet at http://pubs.acs.org.
References
- 1.Danial NN, Korsmeyer SJ. Cell death: critical control points. Cell. 2004;116:205–219. doi: 10.1016/s0092-8674(04)00046-7. [DOI] [PubMed] [Google Scholar]
- 2.Van Damme P, Martens L, Van Damme J, Hugelier K, Staes A, Vandekerckhove J, Gevaert K. Caspase-specific and nonspecific in vivo protein processing during Fas-induced apoptosis. Nat Methods. 2005;2:771–777. doi: 10.1038/nmeth792. [DOI] [PubMed] [Google Scholar]
- 3.Lee AY, Park BC, Jang M, Cho S, Lee DH, Lee SC, Myung PK, Park SG. Identification of caspase-3 degradome by two-dimensional gel electrophoresis and matrix-assisted laser desorption/ionization-time of flight analysis. Proteomics. 2004;4:3429–3436. doi: 10.1002/pmic.200400979. [DOI] [PubMed] [Google Scholar]
- 4.Anke Rickers EB, Markus Y Mapara, Albrecht Otto, Bernd Drken, Kurt Bommert. Inhibition of CPP32 blocks surface IgM-mediated apoptosis and D4-GDI cleavage in human BL60 Burkitt lymphoma cells. Eur J Immunol. 1998;28:296–304. doi: 10.1002/(SICI)1521-4141(199801)28:01<296::AID-IMMU296>3.0.CO;2-4. [DOI] [PubMed] [Google Scholar]
- 5.Brockstedt E, Rickers A, Kostka S, Laubersheimer A, Dorken B, Wittmann-Liebold B, Bommert K, Otto A. Identification of apoptosis-associated proteins in a human Burkitt lymphoma cell line. Cleavage of heterogeneous nuclear ribonucleoprotein A1 by caspase 3. J Biol Chem. 1998;273:28057–28064. doi: 10.1074/jbc.273.43.28057. [DOI] [PubMed] [Google Scholar]
- 6.Ricci J-E, Muoz-Pinedo C, Fitzgerald P, Bailly-Maitre B, Perkins GA, Yadava N, Scheffler IE, Ellisman MH, Green DR. Disruption of mitochondrial function during apoptosis is mediated by caspase cleavage of the p75 subunit of complex I of the electron transport chain. Cell. 2004;117:773–786. doi: 10.1016/j.cell.2004.05.008. [DOI] [PubMed] [Google Scholar]
- 7.McDonald L, Robertson DHL, Hurst JL, Beynon RJ. Positional proteomics: selective recovery and analysis of N-terminal proteolytic peptides. Nat Methods. 2005;2:955–957. doi: 10.1038/nmeth811. [DOI] [PubMed] [Google Scholar]
- 8.Mahrus S, Trinidad JC, Barkan DT, Sali A, Burlingame AL, Wells JA. Global sequencing of proteolytic cleavage sites in apoptosis by specific labeling of protein N termini. Cell. 2008;134:866–876. doi: 10.1016/j.cell.2008.08.012. [DOI] [PMC free article] [PubMed] [Google Scholar]
- 9.Schilling O, Overall CM. Proteomic discovery of protease substrates. Curr Opin Chem Biol. 2007;11:36–45. doi: 10.1016/j.cbpa.2006.11.037. [DOI] [PubMed] [Google Scholar]
- 10.Dix MM, Simon GM, Cravatt BF. Global mapping of the topography and magnitude of proteolytic events in apoptosis. Cell. 2008;134:679–691. doi: 10.1016/j.cell.2008.06.038. [DOI] [PMC free article] [PubMed] [Google Scholar]
- 11.Johnson CE, Kornbluth S. Caspase cleavage is not for everyone. Cell. 2008;134:720–721. doi: 10.1016/j.cell.2008.08.019. [DOI] [PubMed] [Google Scholar]
- 12.Luthi AU, Martin SJ. The CASBAH: a searchable database of caspase substrates. Cell Death Differ. 2007;14:641–650. doi: 10.1038/sj.cdd.4402103. [DOI] [PubMed] [Google Scholar]
- 13.Cociorva D, Yates JR. DTASelect 2.0: improving the confidence of peptide and protein identifications. Proceedings of the 54th Annual ASMS Meeting, American Society for Mass Spectrometry; Sante Fe, NM. 2006. [Google Scholar]
- 14.Tabb DL, McDonald WH, Yates JR. DTASelect and Contrast: tools for assembling and comparing protein identifications from shotgun proteomics. J Proteome Res. 2002;1:21–26. doi: 10.1021/pr015504q. [DOI] [PMC free article] [PubMed] [Google Scholar]
- 15.Keller A, Nesvizhskii AI, Kolker E, Aebersold R. Empirical statistical model to estimate the accuracy of peptide identifications made by MS/MS and database search. Anal Chem. 2002;74:5383–5392. doi: 10.1021/ac025747h. [DOI] [PubMed] [Google Scholar]
Associated Data
This section collects any data citations, data availability statements, or supplementary materials included in this article.


