Abstract
We have used site-directed spin labeling and pulsed electron paramagnetic resonance to resolve a controversy concerning the structure of the utrophin–actin complex, with implications for the pathophysiology of muscular dystrophy. Utrophin is a homolog of dystrophin, the defective protein in Duchenne and Becker muscular dystrophies, and therapeutic utrophin derivatives are currently being developed. Both proteins have a pair of N-terminal calponin homology (CH) domains that are important for actin binding. Although there is a crystal structure of the utrophin actin-binding domain, electron microscopy of the actin-bound complexes has produced two very different structural models, in which the CH domains are in open or closed conformations. We engineered a pair of labeling sites in the CH domains of utrophin and used dipolar electron–electron resonance to determine the distribution of interdomain distances with high resolution. We found that the two domains are flexibly connected in solution, indicating a dynamic equilibrium between two distinct open structures. Upon actin binding, the two domains become dramatically separated and ordered, indicating a transition to a single open and extended conformation. There is no trace of this open conformation of utrophin in the absence of actin, providing strong support for an induced-fit model of actin binding.
Keywords: pulsed EPR, spectroscopy, cryo-EM
Utrophin is a homolog protein of dystrophin that has shown high therapeutic promise for the treatment of muscular dystrophy (1). It is endogenously found in fetal or regenerating muscle but is replaced by dystrophin, the defective protein in Duchenne and Becker muscular dystrophies, as the muscle matures (2). Up-regulation of utrophin in mdx mice, which lack dystrophin, has been shown to rescue its dystrophic phenotype, improving muscle morphology and function (1, 3). The full-length protein is not required to improve dystrophic pathology in mdx mice; i.e., substantial internal truncations in utrophin can be tolerated (4). These internally truncated constructs for muscular dystrophy therapeutics support the importance of actin binding by the N-terminal portions of either dystrophin or utrophin (5). Utrophin (395 kD) and dystrophin (427 kD) both contain highly homologous N-terminal actin-binding domains (ABD1), consisting of a pair of calponin homology (CH) domains. Despite additional actin-binding regions identified in the central spectrin-type repeats (6), microutrophin constructs with high potential for clinical applications rely almost exclusively on the N-terminal CH domains for actin interaction (7, 8). Therefore, understanding the structural interaction between utrophin CH domains and actin has become crucial for the rational development of therapeutic constructs.
More generally, there is an urgent need for a structural blueprint of CH domain-actin complexes for the entire spectrin superfamily of actin-binding proteins (e.g., fimbrin and α-actinin), of which dystrophin and utrophin are members. The diversity of crystal structures for these domains, despite high sequence homology, suggests a high degree of dynamics and flexibility and has prevented the development of a reliable structural model for any of these complexes. A major unresolved question concerns the relative disposition of the tandem CH domains (CH1 and CH2) (9, 10). Crystal structures of the tandem CH domains showed a closed conformation for fimbrin (11) and α-actinin (12), but an open conformation for both utrophin (Utr261) (Fig. 1A) and dystrophin (Dys246) (16). The crystal structure of Utr261 suggests that the central helical region connecting CH1 and CH2 is highly flexible. Even for α-actinin, which has a closed crystal structure, computational analysis suggests the potential for a high degree of dynamic flexibility that facilitates actin binding (17). A method is needed that allows high-resolution detection of multiple structural states in the presence of flexibility and disorder, both free and bound to actin. The present study achieves this goal with site-directed spin labeling and dipolar electron–electron resonance (DEER) to resolve the structures of both the actin-bound and unbound states of the utrophin CH domains (Utr261).
Fig. 1.
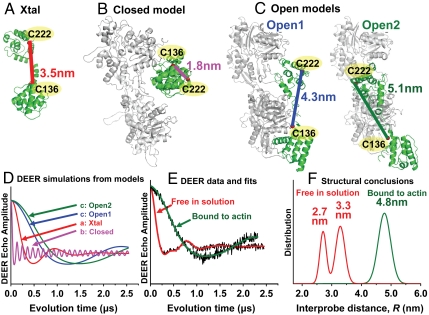
DEER data revealing the structural dynamics of utrophin CH domains and a closed-to-open transition upon actin binding. (A) Utr261 crystal structure 1QAG (13), (B) EM-based closed model (14), (C) EM-based open models (15). Cα-Cα distances between labeling sites (residues 136 and 222) are indicated. (D) Simulations of DEER data based on the Cα-Cα distances show that the four models can be clearly distinguished. (E) Observed DEER waveforms (black) of Utr261 free in solution and bound to actin (4 moles actin per mole Utr261). Colored curves show best fits for Gaussian distance distributions, which are shown in F. When free in solution, Utr261 shows two distinct oscillation frequencies in the DEER waveform (E, red), implying a bimodal structural distribution in which two conformations are clearly resolved (F, red curve). When bound to actin, a single slower oscillation is observed (E, green), implying a single structural population (F, green) that is completely resolved from that free in solution, demonstrating a dramatic opening in conformation upon binding. The bound structure appears to be in excellent agreement with the open 2 conformation (15), and actin binding clearly occurs through an induced-fit mechanism.
Structural analysis of utrophin–actin complexes has been difficult, because filamentous actin does not cocrystallize with its binding partners. Cryoelectron microscopy has been performed on the Utr261-actin complex, but resolution has not been sufficient to distinguish closed and open conformations of the tandem CH domains (9, 10). Sutherland-Smith et al. proposed that the CH domains (CH1 and CH2) are organized in a compact and closed conformation when bound to actin (14) (Fig. 1B). However, based on similar EM data, Galkin et al. proposed an open conformation (15) (Fig. 1C), although they could not distinguish between two possible open conformations—a “half-decorated model” (open 1) in which every Utr261 contacts two actin protomer and a “singly decorated model” (open 2) in which every Utr261 contacts one actin protomer (Fig. 1C). Thus it is clear that cryo-EM does not provide sufficient resolution to distinguish between three very different structural models for the actin–utrophin complex. In the present study, we have resolved this controversy using site-directed spin labeling and high-resolution pulsed EPR spectroscopy (DEER) to measure distances between the CH domains, both free in solution and bound to actin.
Results
Site-Directed Labeling in the CH Domains of Utrophin.
A series of DEER simulations was performed, assuming that spin labels were attached to different pairs of labeling sites on utrophin, to select an optimal pair of labeling sites (Cys mutations) in the endogenously cysteine-free Utr261. The goal was to distinguish the crystal structure (Fig. 1A) and the proposed EM-based atomic models of the closed (Fig. 1B) and open (Fig. 1C) conformations. The simulations show that the pair V136 and L222 is ideal for this study, because the predicted DEER waveforms are clearly distinguishable for all four models (Fig. 1D). Therefore, we engineered a double-cysteine mutant (V136C/L222C) and attached a pair of thio-reactive spin labels to the Utr261 construct. As shown by DEER simulations, a 1.8-nm distance between residues V136C and L222C, as predicted by the closed model for the actin-bound complex (Fig. 1B) should generate an extremely rapid oscillation in the DEER waveform (Fig. 1D, magenta), compared with the slower oscillation (Fig. 1D, red) predicted by the more open crystal structure (Fig. 1A, 3.5 nm). In contrast, the open models for the actin-bound complex (Fig. 1C, 4.3 or 5.1 nm) should produce a much slower oscillation (Fig. 1D, blue and green). Neither the presence of the double-cysteine mutations nor the spin labeling significantly perturbed the α-helical secondary structure, as determined by circular dichroism (Fig. S1); or actin affinity, as determined from cosedimentation assays (Fig. S2).
Utr261 Has Two Resolved Conformations When Free in Solution.
Inspection of the DEER waveform of Utr261 free in solution shows clearly the presence of two oscillations with distinct frequencies (Fig. 1E, red), unambiguously indicating two distinct interspin distances; i.e., two coexisting structural (conformational) states. The slower of the two oscillations, corresponding to the longer distance, is in excellent agreement with the data predicted (Fig. 1D, red) for the crystal structure (Fig. 1A, 3.5 nm). Quantitative analysis (Fig. 1F), based on least-squares minimization (Fig. S3), yielded a bimodal distribution with mean distances of 2.7 nm and 3.3 nm, corresponding to mole fractions of 0.4 and 0.6, respectively. Thus the actin-binding domain of utrophin is in dynamic equilibrium between two structural states of nearly equal free energy, an open one (corresponding to the 3.3-nm distance) that is trapped in the crystal structure (Fig. 1A), and another that is substantially more closed.
Utr261 Binds to Actin in an Open Conformation Through an Induced-Fit Mechanism.
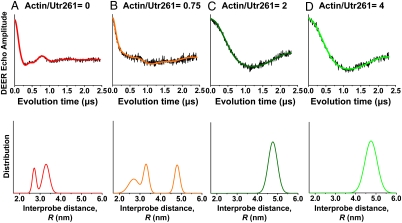
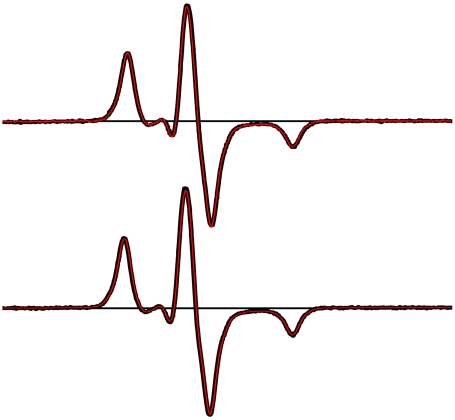
Upon actin binding, the DEER waveform of Utr261 (Fig. 1E, green) undergoes a dramatic change, showing a much slower oscillation, thus indicating a substantial increase in the interdomain distance. Indeed, the observed waveform is in excellent agreement with that predicted (Fig. 1D, green) by an extremely open conformation of Utr261 in the actin-bound complex (Fig. 1C). Quantitative analysis showed clearly that the interprobe distance increased to a well-defined 4.8 nm with a narrow distribution (Fig. 1F, green), which is consistently obtained with different actin content (Fig. 2). As we titrated actin into the labeled Utr261 sample, we detected a distinct shift of population from the bimodal population free in solution (2.7 and 3.3 nm) (Fig. 2A) to the single actin-bound conformation (4.8 nm) (Fig. 2 C and D). Under subsaturating conditions, where the molar ratio of actin to Utr261 is less than 1, we found a mixture of the free and actin-bound populations (Fig. 2B). When we saturated the sample with actin, only a single long distance of 4.8 nm was observed; no conformations with distances less than 4.0 nm were populated (Fig. 2 C and D). Indeed, dipolar continuous wave (CW)-EPR shows that no distances less than 2.5 nm are detected, in either the presence or absence of actin (Fig. 3), indicating that the closed conformation depicted in Fig. 1B is not populated in the presence or absence of actin. Thus it is clear that the CH domains of Utr261 move apart substantially upon actin binding, corresponding very well to the open conformation proposed from some previous EM studies (Fig. 1C), but not to the closed conformation proposed from other EM studies (Fig. 1B). The detected distance of 4.8 nm was in best agreement with the singly decorated open conformation model (15) (Fig. 1C, “open 2”).
Fig. 2.
DEER waveform (Top) and distance distribution (Bottom) between the two CH domains of Utr261, as a function of the molar ratio of actin to Utr261 (spin labeled at C136 and C222). When actin is absent (A), there is a bimodal distribution of short distances that is not observed when actin is in excess (C and D), but when actin is substoichiometric (B), both populations are observed.
Fig. 3.
Dipolar CW-EPR spectra of spin-labeled Utr261. The spectrum of doubly labeled V136C/L222C (red) is overlaid on the spectrum of singly labeled L222C-Utr261 (black). (Top) No actin. (Bottom) Two moles actin per mole Utr261. In each case, there is no difference between red and black spectra (i.e., no dipolar broadening), implying that there is no significant population having an interprobe distance less than 2.5 nm.
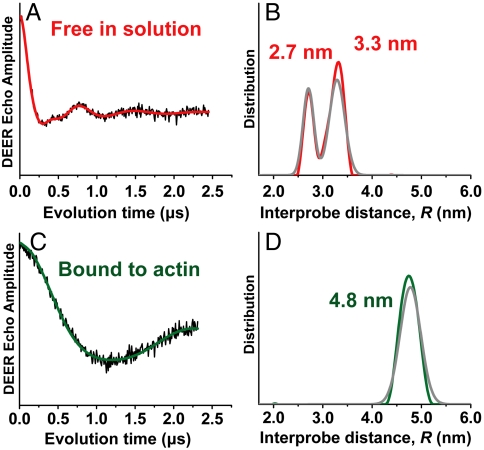
With considerable precision, there is no overlap between the distance distributions determined for free and actin-bound Utr261 (Fig. 1F). This is shown even more rigorously by model-independent analysis using Tikhonov regularization (TR, Fig. 4). Because TR does not insist on a particular functional form, such as Gaussian, for the distance distribution, it is more likely to resolve a small population that deviates from the major component. The TR results agree remarkably well with those determined from Gaussian fits, speaking further to the integrity of the data and fitting analysis (Fig. 1F and Fig. 4 B and D). We conclude that (i) when Utr261 is free in solution, there is no trace (less than 1%) of the open actin-bound conformation (Fig. 4 A and B) and (ii) when Utr261 is bound to actin, there is no trace of the closed conformation (Fig. 4 C and D). These results clearly demonstrate that the structural change in Utr261 is driven by induced fit, not by conformational selection among preexisting conformers (18).
Fig. 4.
Model-independent (Tikhonov) fit to DEER waveform of Utr261, labeled at C136 and C222. (A and B) Utr261 free in solution. (C and D) Utr261 bound to actin. The distance distributions from Tikhonov fits (red and green, B and D) are also nearly identical to those from Gaussian fits (gray, from Fig. 1E). χ2 values (defining the quality of the fit) were virtually identical for Tikhonov and Gaussian fits (Fig. S3). Both methods of analysis show that the distance distribution from the actin-free sample is clearly bimodal (B), and there is no overlap of the two distance distributions in B and D. These results clearly support the induced-fit mechanism.
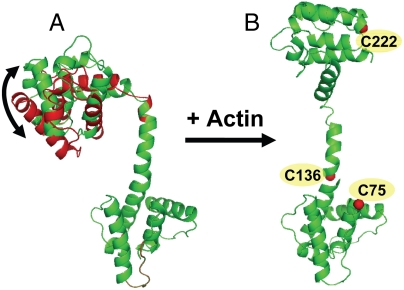
To illustrate the key results of this study, we simulated models using our measured distances as constraints (Fig. 5). We started from the crystal structure of Utr261 (PDB ID code 1QAG) and performed rigid-body rotations of the two heads (CH1 and CH2) relative to one another around a pivot point set at the peptide bond between residues 149 and 150. In the case of the actin-bound state, a total of 21 models with no steric clashes that satisfied our distance constraints were generated, based on both the 4.8-nm distance measured between labeled residues 136 and 222, and the 5.3-nm distance measured between residues 75 and 222 (Figs. S4 and S5). The structural model from our 21 simulated results that fitted best to prior EM data (Fig. S5) was selected to represent the actin-bound state in Fig. 5B, which strongly resembled that of the open 2 EM model (Fig. 1C). The results clearly demonstrate an induced-fit mechanism, where Utr261 is structurally dynamic in solution (Fig. 5A) and opens dramatically upon actin binding (Fig. 5B). Future DEER measurements of distances between other pairs of labeling sites in Utr261, as well as measurements between specific sites on actin and Utr261, will be needed to obtain a detailed atomic model for the utrophin–actin complex.
Fig. 5.
Utrophin binds to actin by an induced-fit mechanism. Model of Utr261 free in solution (A) and bound to actin (B), based on DEER data (see text). In the absence of actin, the Utr261 is in equilibrium between two distinct conformations, corresponding to the 2.7 nm (red) and 3.3 nm (green) distances observed by DEER (Figs. 1F and 4). Upon binding to actin, Utr261 dramatically opens up, corresponding to the 4.8-nm distance observed by DEER (Fig. 1F).
Discussion
Utr261 Binds to Actin in an Open Conformation by an Induced-Fit Mechanism.
We have used pulsed dipolar EPR (DEER) to show that the two CH domains of utrophin’s N-terminal actin-binding domain (Utr261) open dramatically upon actin binding, resolving a controversy regarding EM-based models (Fig. 1). When free in solution, Utr 261 is in equilibrium between two distinct structural states, one consistent with the crystal structure, and one that is more closed, but neither of these conformations is found in the actin-bound structure. Thus, this binding event occurs by an induced-fit mechanism, not by selection of a preexisting conformation (Fig. 5). Both the bimodal distance distribution of free Utr 261 and the large-scale structural change upon actin binding demonstrate the high flexibility of the tandem CH domains.
Implications for Utrophin’s Role in Therapy for Muscular Dystrophy.
Utrophin constructs that include the N-terminal actin-binding domain are under intensive study for possible use in therapeutic replacement of dystrophin for treatment of muscular dystrophy (8), and its localization to the subsarcolemma suggests its essential role in replacing dystrophin’s interactions with cytoskeletal (nonsarcomeric) actin. A previous study showed that utrophin restricts the amplitude of actin’s microsecond torsional flexibility with high cooperativity, while increasing the rate of these flexing motions, and that utrophin is even more effective than dystrophin in this regulation of actin’s dynamic mechanical properties (19). It was proposed that this regulation of flexibility in cytoskeletal actin is crucial for the functions of both utrophin and dystrophin as mechanical stabilizers to diffuse lateral force at the surface of the muscle cell. Our results suggest a mechanism for these effects. The extensive opening of Utr261 upon actin binding (Fig. 5) would bring the two CH domains in contact with adjacent actin protomers, providing a plausible structural explanation for the decreased amplitude of actin’s torsional flexibility. This open conformation probably extends and partially unwinds the central linker between the two CH domains, facilitating the observed increase in the rate of the restricted flexibility that remains in the actin–utrophin complex (19). ABD1’s ability to regulate actin’s torsional flexibility is of great potential interest, because current promising gene therapy constructs have large deletions in the central domain of either utrophin or dystrophin, and thus rely solely on the N-terminal ABD1 for actin interaction (5). Future structural studies with the N-terminal ABD1 of dystrophin, analogous to the present study on utrophin, and additional distance measurements between these actin-binding domains to actin, will provide insight needed to continue this protein engineering project.
Structural Implications for Other Tandem CH Domains.
Based on crystal structures showing a variable linkage between CH domains, it has been proposed that tandem CH domains are highly dynamic in both structure and function (13, 17, 18). Our study provides high-resolution structural information on one of these tandem CH domains in solution, showing that it is in equilibrium between two distinct conformations. Thus we have obtained direct information in solution supporting the hypothesis that the linker between the CH domains is highly flexible (13), establishing the capacity for the versatile structural transitions required for other similar actin-binding proteins such as α-actinin (20) and fimbrin (21).
Structures of actin-bound CH domains have long been elusive. There are no crystal structures containing both actin and tandem CH domains. EM studies have generated controversy, with competing closed (compact) and open (extended) models proposed for Utr261 (Fig. 1), α-actinin (17, 20, 22), and fimbrin (21, 23). The present study provides direct high-resolution measurements on the relative disposition of tandem CH domains bound to actin, clearly resolving the controversy for utrophin and establishing powerful methodology that should be applicable to the other important members of the spectrin superfamily of actin-binding proteins. The extensively open conformation of the CH domains in actin-bound utrophin is a structure not found in crystal or solution, demonstrating dramatically the plasticity of this actin-binding interaction (Fig. 5).
Conclusions
We report a previously undescribed approach, involving site-directed spin labeling and pulsed electron paramagnetic resonance (DEER), for defining the structural dynamics of actin-binding CH domains. DEER provides high-resolution distance measurements, showing clearly that the N-terminal actin-binding domain of utrophin is quite flexible. Its tandem CH domains are arranged in two resolved conformations in the absence of actin, one of which agrees with the crystal structure, and a single distinct conformation when bound to actin, corresponding to a much more open state that has not previously been observed (Fig. 5), clearly indicating an induced-fit mechanism of binding. This approach will be powerful in future studies of utrophin and other actin-binding proteins, with important implications for the molecular pathology and therapy of muscular dystrophy (1).
Materials and Methods
Protein Purification and Spin Labeling.
Utr261 was cloned from mouse utrophin cDNA and ligated as a BamHI-XhoI fragment into pET23a vector. Utr261 contains no native cysteines. Site-directed mutagenesis (Stratagene QuikChange) was performed to engineer a pair of Cys residues into the construct for thio-reactive spin label attachment at chosen sites (either V136C and L222C, or G75C and L222C). The double-Cys mutant construct was transformed into the Escherichia coli BL21 AI cell line and grown at 37 °C in LB media to an absorbance of 0.6–0.8 at 600 nm. Cells were induced with 1 mM IPTG and 0.2% L arabinose and allowed to grow for 3–5 h at 28 °C. Cells were then harvested by centrifugation and lysed with lysozyme for 1 h at 4 °C in 25% sucrose, 1 mM EDTA, 1 mM PMSF, 50 mM Tris (pH 8.0, 4 °C), followed by a freeze–thaw procedure in a dry ice/isopropanol bath. The lysate was treated with 2 U/L DNase I and incubated with the addition of 10 mM MgCl2 and 10 mM MnCl2 for 1 h, then centrifuged at 40,000 × g for 30 min. The supernatant was purified using an anion-exchange column (HiTrap Q XL, GE) equilibrated in 1 mM EGTA, 1 mM DTT, 20 mM Tris (pH 8.0, 4 °C). Protein was eluted with a linear gradient of NaCl from 0 to 0.5 M. Fractions containing the target protein were verified using SDS-PAGE and pooled to run over a gel filtration column (Sephadex S200, GE) in 100 mM NaCl, 2 mM MgCl2, 1 mM DTT, 10 mM Tris (pH 8.0, 4 °C). Fractions containing the target protein were again verified using SDS-PAGE and concentrated. DTT was removed prior to labeling using Zeba desalting columns (Pierce). The protein was labeled with N-(1-oxyl-2,2,6,6-tetramethyl-4-piperidinyl)maleimide (Toronto Research Chemicals). Labeling efficiency was determined by spin counting with using a Bruker E500 spectrometer at X band (9.5 GHz) with an SHQ cavity at a microwave power where there was no saturation (0.03 mW). The molar ratio of spin labels per labeling site was determined to be 0.82 ± 0.02.
DEER and Dipolar CW-EPR.
We performed DEER to measure distances from 2 to 6 nm, and dipolar CW-EPR for distances from 0.5 to 2.5 nm. DEER experiments were performed and analyzed as described previously (24). The concentration of Utr261 was 100 μM. F-actin was prepared from rabbit skeletal muscle (25). Both proteins were dialyzed into a buffer containing 100 mM NaCl, 2 mM MgCl2, 1 mM DTT, 10 mM Tris (pH 8.0, 4 °C). The final actin concentration was 400 to 500 μM. Actin was mixed with Utr261 at the desired molar ratio (typically 2 mol actin per mole Utr261), such that the final Utr261 concentration was 60 to 75 μM. One hundred microliter samples containing 10% glycerol (vol/vol) were flash-frozen in liquid nitrogen in a 5-mm OD quartz NMR tube (Wilmad glass). Samples were stored at -80°C. Pulsed EPR experiments were performed with an Elexsys E580 spectrometer (Bruker Biospin) containing a dielectric resonator (MD-5; Bruker Biospin). Spectra were acquired using a four-pulse sequence, with the pump frequency centered on the central resonance of the nitroxide and the observed frequency set at a low-field resonance > 65 mHz away from the pump frequency. The π/2 pulse was 16 ns and the ELDOR pulse was 40 to 44 ns. Each waveform was recorded at 65 K for 24 to 72 h. The resulting spectra and spin–spin distances were analyzed using DeerAnalysis2008 software suite (26) and software developed in-house (WACY, Edmund Howard). Background subtraction of the DEER waveforms were done using singly labeled Utr261 (26). To account for protein flexibility, fits to the data were done assuming that each conformational state of the protein corresponds to a Gaussian distribution of distances:
 |
where σ is the standard deviation and FWHM is the full width at half maximum of the distribution.
The number of Gaussian components in the fit (n) was determined by varying n such that no improvement in the residual plot and χ2 value was obtained by increasing the number of components to n + 1 (Fig. S3). Distance distributions determined by Tikhonov regularization were consistent with the Gaussian fits (Fig. 4).
Spin–spin distances were also determined by CW-EPR using a Bruker E500 spectrometer at X band (9.5 GHz) with an SHQ cavity, as described previously (27). Spectra were acquired at 200 K with a 200-G field sweep to detect spectral broadening. The modulation amplitude was decreased to 1 G to minimize modulation broadening, and all spectra were acquired under nonsaturating conditions (0.03 mW).
Supplementary Material
Acknowledgments.
EPR and CD experiments were performed at the Biophysical Spectroscopy Facility, University of Minnesota. We thank William Lehman and Edward Egelman for providing unpublished EM coordinates of the Utr261-actin complex. We thank James Ervasti (University of Minnesota, Minneapolis, MN) for the utrophin gene and for helpful discussions. Special thanks go to Octavian Cornea for assistance with manuscript preparation and submission. This study is supported by National Institutes of Health (NIH) Grants AR032961, AR057220 Core C, and AG026160 (to D.D.T.), Muscular Dystrophy Association Grant 4322 (to D.D.T.), and NIH Grant F30AG034033 (to A.Y.L.).
Footnotes
The authors declare no conflict of interest.
This article is a PNAS Direct Submission.
This article contains supporting information online at www.pnas.org/lookup/suppl/doi:10.1073/pnas.1106453108/-/DCSupplemental.
References
- 1.Tinsley J, et al. Expression of full-length utrophin prevents muscular dystrophy in mdx mice. Nat Med. 1998;4:1441–1444. doi: 10.1038/4033. [DOI] [PubMed] [Google Scholar]
- 2.Winder SJ, Knight AE, Kendrick-Jones J. In: Protein Structure. Brown SS, Lucy JA, editors. Cambridge, UK: Cambridge Univ Press; 1997. pp. 27–55. [Google Scholar]
- 3.Amenta AR, et al. Biglycan recruits utrophin to the sarcolemma and counters dystrophic pathology in mdx mice. Proc Natl Acad Sci USA. 2010;108:762–767. doi: 10.1073/pnas.1013067108. [DOI] [PMC free article] [PubMed] [Google Scholar]
- 4.Tinsley JM, et al. Amelioration of the dystrophin phenotype of mdx mice using a truncated utrophin transgene. Nature. 1996;384:349–353. doi: 10.1038/384349a0. [DOI] [PubMed] [Google Scholar]
- 5.Harper SQ, et al. Modular flexibility of dystrophin: Implications for gene therapy of Duchenne muscular dystrophy. Nat Med. 2002;8:253–261. doi: 10.1038/nm0302-253. [DOI] [PubMed] [Google Scholar]
- 6.Rybakova IN, Patel JR, Davies KE, Yurchenco PD, Ervasti JM. Utrophin binds laterally along actin filaments and can couple costameric actin with sarcolemma when overexpressed in dystrophin-deficient muscle. Mol Biol Cell. 2002;13:1512–1521. doi: 10.1091/mbc.01-09-0446. [DOI] [PMC free article] [PubMed] [Google Scholar]
- 7.Sonnemann KJ, et al. Functional substitution by TAT-utrophin in dystrophin-deficient mice. PLoS Med. 2009;6:e1000083. doi: 10.1371/journal.pmed.1000083. [DOI] [PMC free article] [PubMed] [Google Scholar]
- 8.Odom GL, Gregorevic P, Allen JM, Finn E, Chamberlain JS. Microutrophin delivery through rAAV6 increases lifespan and improves muscle function in dystrophic dystrophin/utrophin-deficient mice. Mol Ther. 2008;16:1539–1545. doi: 10.1038/mt.2008.149. [DOI] [PMC free article] [PubMed] [Google Scholar]
- 9.Galkin VE, Orlova A, VanLoock MS, Egelman EH. Do the utrophin tandem calponin homology domains bind F-actin in a compact or extended conformation? J Mol Biol. 2003;331:967–972. doi: 10.1016/s0022-2836(03)00842-8. [DOI] [PubMed] [Google Scholar]
- 10.Lehman W, Craig R, Kendrick-Jones J. An open or closed case for the conformation of calponin homology domains on F-actin. J Muscle Res Cell Motil. 2004;25:351–358. doi: 10.1007/s10974-004-0690-7. [DOI] [PubMed] [Google Scholar]
- 11.Goldsmith SC, et al. The structure of an actin-crosslinking domain from human fimbrin. Nat Struct Biol. 1997;4:708–712. doi: 10.1038/nsb0997-708. [DOI] [PubMed] [Google Scholar]
- 12.Franzot G, Sjöblom B, Gautel M, Carugo KD. The crystal structure of the actin binding domain from α-actinin in its closed conformation: Structural insight into phospholipid regulation of α-actinin. J Mol Biol. 2005;348:151–165. doi: 10.1016/j.jmb.2005.01.002. [DOI] [PubMed] [Google Scholar]
- 13.Keep NH, et al. Crystal structure of the actin-binding region of utrophin reveals a head-to-tail dime. Structure. 1999;7:1539–1546. doi: 10.1016/s0969-2126(00)88344-6. [DOI] [PubMed] [Google Scholar]
- 14.Sutherland-Smith AJ, et al. An atomic model for actin binding by the CH domains and spectrin-repeat modules of utrophin and dystrophin. J Mol Biol. 2003;329:15–33. doi: 10.1016/s0022-2836(03)00422-4. [DOI] [PubMed] [Google Scholar]
- 15.Galkin VE, et al. The utrophin actin-binding domain binds F-actin in two different modes: Implications for the spectrin superfamily of proteins. J Cell Biol. 2002;157:243–251. doi: 10.1083/jcb.200111097. [DOI] [PMC free article] [PubMed] [Google Scholar]
- 16.Norwood FL, Sutherland-Smith AJ, Keep NH, Kendrick-Jones J. The structure of the N-terminal actin-binding domain of human dystrophin and how mutations in this domain may cause Duchenne or Becker muscular dystrophy. Structure. 2000;8:481–491. doi: 10.1016/s0969-2126(00)00132-5. [DOI] [PubMed] [Google Scholar]
- 17.Borrego-Diaz E, et al. Crystal structure of the actin-binding domain of α-actinin 1: Evaluating two competing actin-binding models. J Struct Biol. 2006;155:230–238. doi: 10.1016/j.jsb.2006.01.013. [DOI] [PubMed] [Google Scholar]
- 18.Moores CA, Kendrick-Jones J. Biochemical characterisation of the actin-binding properties of utrophin. Cell Motil Cytoskeleton. 2000;46:116–128. doi: 10.1002/1097-0169(200006)46:2<116::AID-CM4>3.0.CO;2-L. [DOI] [PubMed] [Google Scholar]
- 19.Prochniewicz E, Henderson D, Ervasti JM, Thomas DD. Dystrophin and utrophin have distinct effects on the structural dynamics of actin. Proc Natl Acad Sci USA. 2009;106:7822–7827. doi: 10.1073/pnas.0812007106. [DOI] [PMC free article] [PubMed] [Google Scholar]
- 20.Galkin VE, Orlova A, Salmazo A, Djinovic-Carugo K, Egelman EH. Opening of tandem calponin homology domains regulates their affinity for F-actin. 2010;17:614–616. doi: 10.1038/nsmb.1789. [DOI] [PMC free article] [PubMed] [Google Scholar]
- 21.Galkin VE, Orlova A, Cherepanova O, Lebart M-C, Egelman EH. High-resolution cryo-EM structure of the F-actin-fimbrin/plastin ABD2 complex. Proc Natl Acad Sci USA. 2008;105:1494–1498. doi: 10.1073/pnas.0708667105. [DOI] [PMC free article] [PubMed] [Google Scholar]
- 22.McGough A, Way M, DeRosier D. Determination of the alpha-actinin-binding site on actin filaments by cryoelectron microscopy and image analysis. J Cell Biol. 1994;126:433–443. doi: 10.1083/jcb.126.2.433. [DOI] [PMC free article] [PubMed] [Google Scholar]
- 23.Hanein D, et al. An atomic model of fimbrin binding to F-actin and its implications for filament crosslinking and regulation. Nat Struct Biol. 1998;5:787–792. doi: 10.1038/1828. [DOI] [PubMed] [Google Scholar]
- 24.Agafonov RV, et al. Structural dynamics of the myosin relay helix by time-resolved EPR and FRET. Proc Natl Acad Sci USA. 2009;106:21625–21630. doi: 10.1073/pnas.0909757106. [DOI] [PMC free article] [PubMed] [Google Scholar]
- 25.Prochniewicz E, Zhang Q, Janmey PA, Thomas DD. Cooperativity in F-actin: Binding of gelsolin at the barbed end affects structure and dynamics of the whole filament. J Mol Biol. 1996;260:756–766. doi: 10.1006/jmbi.1996.0435. [DOI] [PubMed] [Google Scholar]
- 26.Jeschke G, et al. Deer analysis 2006: A comprehensive software package for analyzing pulsed ELDOR data. Appl Magn Reson. 2006;30:473–498. [Google Scholar]
- 27.Klein JC, et al. Actin-binding cleft closure in myosin II probed by site-directed spin labeling and pulsed EPR. Proc Natl Acad Sci USA. 2008;105:12867–12872. doi: 10.1073/pnas.0802286105. [DOI] [PMC free article] [PubMed] [Google Scholar]
Associated Data
This section collects any data citations, data availability statements, or supplementary materials included in this article.


