

Abstract
Prolonged use of conventional stereo displays causes viewer discomfort and fatigue because of the vergence-accommodation conflict. We used a novel volumetric display to examine how viewing distance and the sign of the vergence-accommodation conflict affect discomfort and fatigue. In the first experiment, we presented a fixed conflict at short, medium, and long viewing distances. We compared subjects’ symptoms in that condition and one in which there was no conflict. We observed more discomfort and fatigue with a given vergence-accommodation conflict at the longer distances. The second experiment compared symptoms when the conflict had one sign compared to when it had the opposite sign at short, medium, and long distances. We observed greater symptoms with uncrossed disparities at long distances and with crossed disparities at short distances. These findings help define comfortable viewing conditions for stereo displays.
Keywords: stereo display, vergence-accommodation conflict, visual fatigue, comfortable stereo viewing, viewing distance
1. INTRODUCTION
There is currently an explosion of interest in technology for presenting stereo 3D (S3D) imagery in cinema, television, gaming, and mobile devices. The large commercial effort has been accompanied by public concern about potential adverse effects associated with prolonged viewing of stereo imagery. Some of the concern has been rational and some has not. For example, a prominent display manufacturer issued a warning in instructions manuals that some viewers of S3D television could experience eyestrain, confusion, dizziness, nausea and discomfort. The warning went on to recommend against watching S3D television if the viewer feels tired, illness or any discomfort. Clearly, a significant hurdle for the emerging technology is to determine what the potential adverse effects are, and how to reduce or eliminate them.
There are numerous potential causes of visual discomfort when viewing stereo displays. These include discomfort due to the eyewear required to separate the two eyes’ images, ghosting or cross-talk between the two eyes’ images, misalignment of the images, inappropriate head orientation, vergence-accommodation conflict, visibility of flicker or motion artifacts, and visual-vestibular conflicts1. Here we focus on the vergence-accommodation conflict for two reasons. First, it is present in all conventional stereo displays, while the other factors are not present in some instantiations of stereo display technology. Second, the visual discomfort and fatigue associated with the viewing of stereo displays has often been attributed to vergence-accommodation conflicts2–9. Unfortunately, the great majority of those publications did not present persuasive evidence that the reported symptoms were caused specifically by the vergence-accommodation conflict, so one purpose of the current study is to investigate whether such conflicts do indeed cause visual discomfort.
Figure 1 represents a difference between natural viewing and stereo viewing. In natural viewing, vergence and focal distance are equal to one another as shown on the left. The viewer adjusts the vergence of the eyes to look at an object, and the eyes focus to sharpen the retinal image. Because of the tight correlation in natural viewing, vergence and accommodation are neurally coupled. Specifically, accommodative changes evoke changes in vergence (accommodative vergence), and vergence changes evoke changes in accommodation (vergence accommodation)10 In stereo viewing on conventional stereo displays, focal distance is fixed at the distance from the eyes to the display screen, while vergence distance varies depending on the distance being simulated on the display. Thus, vergence-accommodation conflict is created by viewing stereo displays. To see the object clearly and without double vision, the viewer must counteract the neural coupling between vergence and accommodation to accommodate to a different distance than the distance to which he/she must converge. Visual fatigue and discomfort occur as the viewer attempts to adjust vergence and accommodation appropriately.
Figure 1.

Diagram of natural and stereo viewing. The left side of the figure represents natural viewing. In natural viewing, the vergence stimulus and focal stimulus are always at the same distance and therefore are consistent with one another. The middle and right side of figure represent stereo viewing on conventional stereo displays. Stereo viewing creates inconsistencies between vergence and focal distances because the vergence distance varies depending on the image contents while the focal distance remains constant.
S3D’s growing popularity has let to adoption for applications beyond cinema. It is now found in television, mobile phones and cameras, and video game systems. A result of this trend is that people will be viewing stereo images at several different viewing distances. Findings from the optometric literature suggest that the discomfort associated with a given vergence-accommodation conflict may increase with increasing viewing distance, and that discomfort might be greater with uncrossed than with crossed disparity. In this study, we used a volumetric stereo display that presents correct or nearly correct focus cues11 to present stereo images with or without vergence-accommodation conflict. In the first experiment, we measured the discomfort/fatigue associated with vergence-accommodation conflict at different distances. In the second experiment, we investigated the interaction of the sign of the conflict and viewing distance on discomfort and fatigue.
2. EXPERIMENT 1: EFFECTS OF VERGENCE-ACCOMMODATION CONFLICT AT DIFFERENT DISTANCES
We first investigated the effect of viewing distance on the visual discomfort that accompanies a vergence-accommodation conflict of a given magnitude in diopters.
2.1 Methods
Twenty-four subjects, 19 to 33 years of age, participated. We screened them with the Titmus Stereo test and found that they all had normal stereoacuity. Those who normally wear optical correction (15 of 24) wore their correction while doing the experiment (11 contact lens, 4 spectacles; 9 with no correction). We checked that they could accommodate to all the focal distances and converge to all the vergence distances in the experiment. All subjects were unaware of the experimental hypotheses.
The six experimental conditions are depicted in Figure 2. Two distances were presented in each sub-session: a base distance and an increment distance. Three of the conditions were cues-consistent such that the vergence and focal distances were always equal to one another; these conditions simulate real-world viewing. Three of the conditions simulated cues-inconsistent viewing in which the focal distance was constant while the vergence distance changed; these conditions simulate the viewing of stereo displays. The experiment was divided into three sessions conducted on three consecutive days. Each session consisted of two sub-sessions conducted on the same day. A pair of sub-sessions always consisted of a cues-consistent sub-session and a cues-inconsistent sub-session at one base distance. In a cues-consistent sub-session, the base vergence and focal distances were either 10m (0.1D), 77cm (1.3D), or 40cm (2.5D) and the increment vergence and focal distances were respectively at distances of 77cm (1.3D), 40cm (2.5D), or 27cm (3.7D). In a cues-inconsistent sub-session, the base vergence and focal distances were the same as in the cues-consistent sub-session, but the increments were 1.2D for the vergence stimulus and 0D for the focal stimulus. Thus, subjects had to uncouple vergence and accommodation to maximize performance in this condition. Note that the vergence stimuli were the same in the paired sub-sessions: The only difference was the focal stimulus, which was equal to the vergence stimulus in the consistent condition and fixed in the inconsistent condition. The ordering of the cues-consistent and cues-inconsistent conditions was random. Neither the subject nor experimenter knew whether a given sub-session was cues-consistent or -inconsistent.
Figure 2.
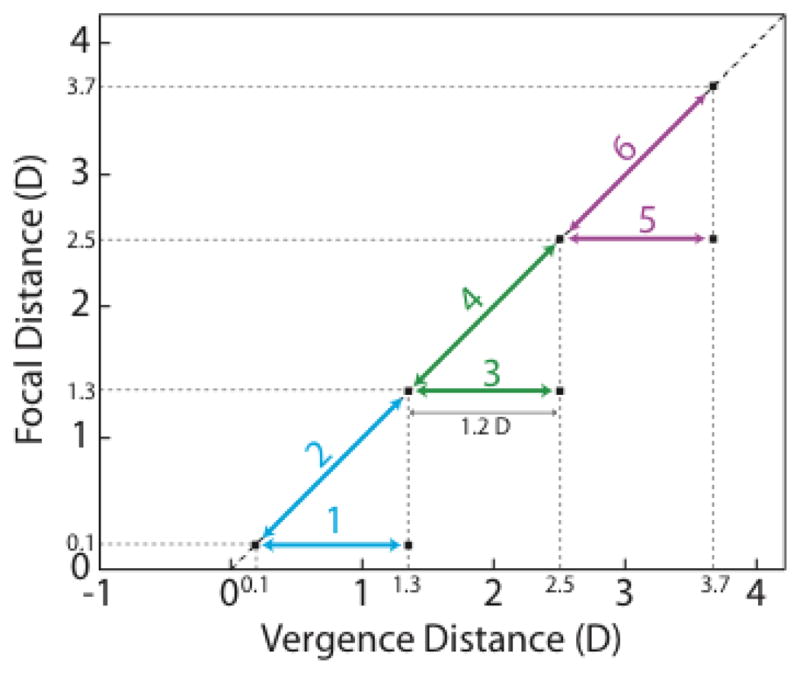
The vergence and focal stimuli in Experiment 1. Vergence distance in diopters is plotted on the abscissa and focal distance in diopters on the ordinate. The diagonal arrows represent the stimuli in the three cues-consistent conditions (2, 4, & 6). In those conditions, the vergence and focal distances were always equal to one another; within the 3-interval trials, they changed by 1.2D as indicated by the arrows. The horizontal arrows represent the stimuli in the three cues-inconsistent conditions (1, 3, & 5). In those conditions, the vergence distance changed in the same way as in the cues-consistent conditions, but the focal distance remained fixed.
Three stimuli were presented sequentially on each trial. The sequence on each trial was base-increment-base or increment-base-increment. Two of the presentations contained one corrugation orientation (+10 or −10° from horizontal) and the other contained the opposite orientation (−10 or +10°). Each presentation interval lasted 1.5s with 1s in between, so the 3-interval sequence lasted 5.5s. The subject’s task was to identify the interval containing the odd orientation; this is a 3-interval, forced-choice oddity task. Auditory feedback was provided at the end of each trial. A sub-session contained 219 trials and lasted ~20 min. We varied the spatial frequency of the stimulus corrugations (1, 1.4, and 2cpd) according to the method of constant stimuli. We recorded percent correct performance in the oddity task for each corrugation frequency and each experimental condition.
At the end of each sub-session, subjects completed a symptom questionnaire. The symptom questionnaire was based on the one used by Hoffman and colleagues4. Observers rated their symptoms on a 5-point Likert scale where 1 indicated no negative symptoms at all and 5 indicated severe symptoms. The questions were:
How tired are your eyes?
How clear is your vision?
How tired and sore are your neck and back?
How do your eyes feel?
How does your head feel?
Then they took a mandatory break that lasted at least 30 min; they took a longer break if they reported residual symptoms from the first sub-session. After the break, subjects participated in the second sub-session of the pair. At the end of a pair of sub-sessions, they completed an additional comparison questionnaire. It had four questions.
Which session was most fatiguing?
Which session irritated your eyes the most?
Which session gave you more headache?
Which session did you prefer?
On a subject’s first day in the experiment, he or she was taken through the consent-to-participate procedure, outfitted with a bite bar, and familiarized with the equipment. They also practiced the oddity task with no vergence-accommodation conflict. Observers were encouraged to complete the entire experiment, but were permitted to stop if they became too uncomfortable; none dropped out early. They were paid for their participation.
2.2 Results
All subjects reported fatigue and/or discomfort after each session. Figure 3 shows the average reported symptoms on the symptom questionnaire. Striped bars represent the reported symptoms after the three cues-inconsistent sessions (conditions 1, 3, and 5), and solid bars represent the reported symptoms after the three cues-consistent session (conditions 2, 4, and 6). The black, gray and off-white bars represent long, middle, and near base viewing distances. The ordinate represent the severity of symptoms which is from the 5-point Likert scale: ‘5’ indicates the most severe symptom, and ‘1’ indicates the observer did not experience symptoms.
Figure 3.

Results from the symptom questionnaire in Experiment 1. The average severity of reported symptoms is plotted for each of the five questionnaire items. The darker bars represent longer base viewing distances. Striped bars represent the reported symptoms after the three cues-inconsistent sessions (conditions 1, 3, and 5), and solid bars represent the reported symptoms after the three cues-consistent session (2, 4, and 6). The ordinate represents the severity of symptoms. Larger values are associated with more severe symptoms. Error bars represent one standard deviation.
For question 1, eye tiredness was significantly more severe in the cues-inconsistent sub-session than the cues-consistent sub-session at 0.1D (10m) (Wilcoxon signed-rank test, p<0.025, one-tailed). For question 2, observers reported significantly more blurriness during the cues-inconsistent session at 1.3D (77cm) (Wilcoxon signed-rank test, p<0.005, one-tailed), and marginally more in the cues-inconsistent session at 0.1D (10m) and 2.5D (40cm) distance sessions (Wilcoxon signed-rank test, p<0.05, one-tailed). For questions 3, 4 and 5, there were no significant differences.
Figure 4 shows the results for the session comparison questionnaire. Higher values indicate more favorable ratings for the cues-consistent session. ‘3’ indicates the two sub-sessions were equally favored. The preference for the cues-consistent condition at the 0.1D (10m) distance was statistically significant for questions 1 and 2 (Wilcoxon signed-rank test, p<0.005, one-tailed), which dealt with general fatigue and eye irritation. For general display preference, there was a marginally significant difference for the 2.5D (40cm) distance (question 4, Wilcoxon signed-rank test, p<0.05, one-tailed).
Figure 4.

Results from the session comparison questionnaire in Experiment 1. The average comparative rating of a pair of sub-sessions (one cues-consistent and one cues-inconsistent) is plotted for each of the four questionnaire items. The ordinate represents which sub-session was more favored. Higher values indicate more favorable ratings for the cues-consistent session. ‘3’ indicates the two sub-sessions were equally favored. Error bars represent one standard deviation.
3. EXPERIMENT 2: EFFECTS OF DIRECTION OF VERGENCE-ACCOMMODATION CONFLICT AT DIFFERENT DISTANCES
We next investigated how the sign of the vergence-accommodation conflict affects visual discomfort at different viewing distances.
3.1 Methods
Fifteen subjects, 20–34 years of age, participated. Many of them had also participated in Experiment 1. Again all were given a stereoacuity test, wore their normal optical correction (9 contacts, 2 glasses, and 4 with no correction), and were unaware of the experimental hypotheses. One additional subject was excluded from participation because she could not diverge sufficiently for one condition.
The same equipment, stimuli, procedure, and response measures were used in Experiment 2 with a few exceptions, which are noted here. There were again two sub-sessions in each session, but both sub-sessions contained a fixed focal distance and were therefore cues-inconsistent. In one sub-session, the vergence-accommodation conflict was positive (vergence distance greater than focal distance in diopters, crossed disparity) while in the other, it was negative (vergence distance less than focal distance in diopters, uncrossed disparity). These conditions are depicted in Figure 5. The change in vergence distance was always ±0.8D, while the focal distance remained constant within a sub-session. Pairs of sub-sessions were presented on consecutive days at focal distances of 0.1D (0.1m), 1.3D (77cm), and 2.5D (40cm). As before, the ordering of sub-sessions and sessions was randomized. Neither the experimenter nor the subject knew if the current sub-session contained positive or negative vergence-accommodation conflict.
Figure 5.

The vergence and focal stimuli in Experiment 2. Vergence distance in diopters is plotted on the abscissa and focal distance in diopters on the ordinate. The horizontal arrows represent the stimuli in the six conditions. Three of those conditions (2, 4, & 6) involved positive vergence-accommodation conflicts in which the vergence distance in diopters was greater than the focal distance in diopters. The other three conditions (1, 3, & 5) involved negative conflicts (vergence distance in diopters less than focal distance in diopters). In all conditions, vergence distance changed, but focal distance remained constant.
3.2 Results
Even with the reduced 0.8D vergence change, all subjects reported fatigue and/or discomfort after each session. Figure 6 shows the average reported symptoms on the symptom questionnaire. Upper-left striped bars represent the reported symptoms after the three negative conflict (uncrossed disparity) sessions (conditions 1, 3, and 5), and upper-right striped bars represent the reported symptoms after the three positive conflict (crossed disparity) session (conditions 2, 4, and 6). As in Figure 3, the darker bars represent longer base viewing distances. We focused on the difference between positive and negative conflicts at each viewing distance in order to examine the distance effect.
Figure 6.

Results from the symptom questionnaire in Experiment 2. The average severity of reported symptoms is plotted for each of the five questionnaire items. Upper-left striped bars represent symptoms after the three negative conflict (uncrossed disparity) sessions (conditions 1, 3, and 5), and upper-right striped bars represent the reported symptoms after the three positive conflict (crossed disparity) sessions (2, 4, and 6). The darker bars represent longer base viewing distances. The ordinate represents the severity of symptoms. Larger values are associated with more sever symptoms. Error bars represent one standard deviation.
For eye tiredness (question 1), negative conflict (uncrossed disparity) was significantly worse for the session at 0.1D (10m) (Wilcoxon signed-rank test, p<0.05, two-tailed). With the smaller vergence change, blurriness (question 2) was generally not reported. Question 4 revealed that the eyes felt significantly worse with negative (uncrossed) conflict when the viewing distance was far, 0.1D (10m) (Wilcoxon signed-rank test, p<0.05, two-tailed), and that the eyes felt significantly better with negative conflict when the viewing distance was near in the 2.5D (40cm) distance session (Wilcoxon signed-rank test, p<0.01, two-tailed). There was generally a minimal amount of head discomfort reported and the only condition with a significant difference was for the 1.3D (77cm) distance (question 5, Wilcoxon signed-rank test, p<0.05, two-tailed), in which the crossed disparities were worse. In our control question, related to neck and back pain, there were no significant differences.
Figure 7 shows the results for the session comparison questionnaire. Higher values indicate more favorable ratings for the positive (crossed disparity) conflict session. As mentioned before, ‘3’ indicates the two sub-sessions were equally favorable. At the far distance (10 m, 0.1D) there was a statistically significant preference for the crossed-disparity viewing situation in terms of general fatigue (questions 1, Wilcoxon signed-rank test, p<0.05, two-tailed), and marginally significant preference for the crossed-disparity viewing situation in terms of eye irritation (question 2, Wilcoxon signed-rank test, p<0.10, two-tailed), headache (question 3, Wilcoxon signed-rank test, p<0.10, two-tailed), and overall preference (question 4, Wilcoxon signed-rank test, p<0.10, two-tailed). At the mid distance, uncrossed disparity caused marginally worse fatigue (question 1) and eye irritation (question 2) (Wilcoxon signed-rank test, p<0.10, two-tailed).
Figure 7.

Results from the session comparison questionnaire in Experiment 2. The average comparative rating of a pair of sub-sessions (one positive conflict and one negative conflict) is plotted for each of the four questionnaire items. The ordinate represents which sub-session is more favored. Higher values indicate more favorable ratings for the positive (crossed disparity) conflict session. ‘3’ indicates the two sub-sessions were equally favored. Error bars represent one standard deviation.
4. DISCUSSION AND CONCLUSIONS
Using a novel volumetric display, we examined how viewing distance and the sign of the vergence-accommodation conflict affect discomfort and fatigue. The results from Experiment 1 show that subjects experienced significantly worse symptoms in cues-inconsistent sessions than in cues-consistent sessions, and that they preferred cues-consistent sessions. Most importantly, the difference in symptoms between cues-consistent and -inconsistent increased with greater viewing distance. The results from Experiment 2 showed that subjects generally experienced greater discomfort with uncrossed than with crossed disparity at the long viewing distance and the reverse at the short viewing distance.
The results reveal that the range of comfortable disparities changes with viewing distance. The range (expressed in diopters) becomes smaller with increasing distance. The results also reveal that the sign of the vergence-accommodation conflict matters; crossed disparities are better tolerated at long distances and uncrossed disparities are better tolerated at short distances. Our findings help define the comfortable viewing conditions for stereo displays. For example, assume that there is S3D content that was designed for a large screen and long viewing distance for cinema, and the content is ported for viewing on a mobile device, and held at a distance such that the angular size remains the same. Therefore, the only difference is viewing distance. Based on our findings in Experiments 1 and 2, we predict that minifying content and viewing at close distance could yield a slightly more comfortable viewing experience, and even more so if the content has mainly uncrossed disparities.
The findings from this work can be valuable in tuning S3D content to be most comfortable for a given display configuration. It also suggests that estimating the comfort of a film should be a process that is repeated under multiple circumstances to ensure that it is comfortable for the full audience, and for a variety of different common display viewing geometries.
Acknowledgments
We are grateful for the financial support of NIH (EY12851), the Japan Society for the Promotion of Science (20-09022), and the Excellent Young Researcher Overseas Visit Program of JSPS.
References
- 1.Kooi FL, Toet A. Visual comfort of binocular and 3D displays. Displays. 2004;25:99–108. [Google Scholar]
- 2.Emoto M, Niida T, Okano F. Repeated vergence adaptation causes the decline of visual functions in watching stereoscopic television. Journal of Display Technology. 2005;1:328–340. [Google Scholar]
- 3.Häkkinen J, Takatalo J, Pölönen M, Nyman G. Simulator sickness in virtual display gaming: A comparison of stereoscopic and non-stereoscopic situations. Proceedings of the 8th conference on Human-computer interaction with mobile devices and services, ACM. 2006;159:227–229. [Google Scholar]
- 4.Hoffman DM, Grishick AR, Akeley K, Banks MS. Vergence-accommodation conflicts hinder visual performance and cause visual fatigue. Journal of Vision. 2008;8(3):1–30. doi: 10.1167/8.3.33. [DOI] [PMC free article] [PubMed] [Google Scholar]
- 5.Lambooij M, Fortuin M, IJsselsteijn WA, Heynderickx I. Measuring Visual Discomfort associated with 3D Displays. Proc SPIE. 2009;7237 [Google Scholar]
- 6.Wann JP, Mon-Williams M. Measurement of visual after effects following virtual environment exposure. In: Stanney KM, editor. Handbook of virtual environments: Design, implementation, and applications. Lawrence Erlbaum Associates; New Jersey: 2002. pp. 731–749. [Google Scholar]
- 7.Ukai K, Howarth PA. Visual fatigue caused by viewing stereoscopic motion images: Background, theories, and observations. Displays. 2008;29(2):106–116. [Google Scholar]
- 8.Yano S, Ide S, Mitsuhashi T, Thwaites H. A study of visual fatigue and visual comfort for 3D HDTV/HDTV images. Displays. 2002;23:191–201. [Google Scholar]
- 9.Yano S, Emoto M, Mitsuhashi T. Two factors in visual fatigue caused by stereoscopic HDTV images. Displays. 2004;25:141–150. [Google Scholar]
- 10.Fincham EF, Walton J. The reciprocal actions of accommodation and convergence. The Journal of Physiology. 1957;137:488–508. doi: 10.1113/jphysiol.1957.sp005829. [DOI] [PMC free article] [PubMed] [Google Scholar]
- 11.Love GD, Hoffman DM, Hands PJW, Gao J, Kirby AK, Banks MS. High-speed switchable lens enables the development of a volumetric stereoscopic display. Opt Express. 2009;17:15716–15725. doi: 10.1364/OE.17.015716. [DOI] [PMC free article] [PubMed] [Google Scholar]