

Abstract
OBJECTIVES
To examine the association between body mass index (BMI) and incident colorectal cancer across the spectrum of BMI, including underweight, because detailed prospective cohort data on this topic in Asians is scarce, as is data on underweight (BMI < 18.5 kg/m2) in any population
RESEARCH DESIGN AND METHODS
Analysis of the Singapore Chinese Health Study included 51,251 men and women ages 45–74 years enrolled in 1993–1998 and followed up through 2007. Incident cancer cases and deaths among cohort members were identified through record linkage and 980 cases were identified. Cox regression models were used to investigate the association of baseline BMI with risk of incident colorectal cancer during mean 11.5 years of follow-up.
RESULTS
A significant U-shaped, quadratic association was observed between BMI and colon cancer risk, with increased risk in BMI’s ≥27.5 and < 18.5 kg/m2. The association was more pronounced in never-smokers; and most prominent when further limiting the sample to those free of diabetes and cases with greater than five years of follow up. Localized cases had a more pronounced association in BMI’s ≥27.5, whereas advanced cases had a more pronounced association in BMI’s < 18.5 kg/m2. No association was found in relation to rectal cancer risk. The association was also stronger among subjects aged 65 years and above.
CONCLUSIONS
BMI displays a U-shaped, quadratic association with colon cancer risk in this Chinese population in Southeast Asia.
Keywords: Body mass index, obesity, underweight, Asians, colorectal cancer
Singapore is historically a low-risk country for colorectal cancer. However, rates of colorectal cancer have doubled among Singapore Chinese in the last three decades. During 1968–1972, the age-standardized (world population) rates in Singapore Chinese men and women were 22.2 and 16.6 per 100,000, respectively. The corresponding rates for 1993–1997 were 45.0 and 32.1 per 100,000, which are higher than comparable rates in US whites (42.2 and 29.5 per 100,000, respectively).1 This increase is primarily due to increasing incidence of colon cancer.1, 2 Incidence of colorectal cancer has been increasing in other economically developed parts of Asia including Hong Kong, Japan, and Korea.3, 4 Excess body weight is considered a risk factor for colorectal cancer in western populations;5 and Asian populations appear to have higher body fat percentages at lower levels of body mass index (BMI kg/m2) relative to western populations.6, 7 However, detailed prospective studies examining the full spectrum of BMI in relation to risk of colorectal cancer in Asians are scarce; as are any meaningful assessments of the low end of the BMI spectrum from any population. Recently, four studies examined the question in Asians, however the results were not conclusive.8–12 Continued investigation will contribute potential insight into the etiology of colorectal cancer and further understanding of a healthful BMI range in Asians.13
The Singapore Chinese Health Study (SCHS) is a prospective cohort investigation of over 63,000 Chinese men and women in Singapore. The SCHS provides a unique Asian population relative to other studies on this topic with its ability to adjust more thoroughly for confounders. We aimed to carry out a comprehensive investigation of the relation between BMI and risk of colorectal cancer in this middle-aged and older Chinese population in Singapore.
Subjects and Methods
Study Population
The design of the Singapore Chinese Health Study has been previously described.14 Briefly, the cohort was drawn from men and women, aged 45 to 74 at enrollment, who belonged to two major dialect groups (Hokkien and Cantonese) of Chinese in Singapore. Between April 1993 and December 1998, 63,257 individuals completed an in-person interview that included questions on demographics, educational attainment, height, weight, use of tobacco and alcohol, usual physical activity, menstrual and reproductive history (women only), medical history, family history of cancer and a 165-item food frequency section assessing usual dietary intake of the previous year. For this study, of the original 63,257 participants we excluded 1,936 subjects with a history of invasive cancer (except non-melanoma skin cancer) or superficial, papillary bladder cancer at baseline since they did not meet study inclusion criteria, and 10,070 participants missing either or both height and weight measures. Hence, the present study included 51,251 participants. Participants excluded due to missing BMI (N=10,070) were not materially different across the noted demographic and lifestyle characteristics compared to participants with full data and included in the analysis (51,251). The institutional review boards at the National University of Singapore and the University of Minnesota approved this study. Written informed consentwas obtained from all participants.
Exposure Assessment
Self reported height and weight were collected at the baseline interview. BMI was calculated as weight (kg) divided by height squared (m). Self-report of body weight has been shown to be highly valid across many populations,15 as well as specifically in Asians.16 Age was defined as age in years at the time of the baseline examination. Education was categorized into no formal education, primary school, and secondary school or above. Cigarette smoking was classified into never smoker, light and heavy smoker as described previously.17 The ‘heavy’ smokers were those who started to smoke before 15 years of age and smoked 13 or more cigarettes per day; all remaining ever smokers were defined as light smokers. A history of physician diagnosed diabetes (yes v. no) was included as well.18
A semi-quantitative food frequency questionnaire specifically developed for this population assessing 165 commonly consumed food items was administered during the baseline interview assessing usual dietary intake of the previous year. The questionnaire has subsequently been validated against a series of 24-hour dietary recall interviews,14 as well as selected biomarker studies.19, 20 Dietary patterns were derived for this study population using principal component analysis as described previously.21 A vegetable, fruit and soy rich pattern characterized by high intake of those respective foods was included as a covariate. Frequency of alcohol intake as the summation of beer, rice wine, other wine and hard liquor was considered as an individual variable and grouped as nondrinker/monthly drinker, weekly drinker, and daily drinker.
Physical activity was assessed using eight continuous categories ranging from never to 31 hours or more in an average week spent doing strenuous sports (e.g. jogging, bicycling on hills, tennis, squash, swimming laps or aerobics); vigorous work (e.g. moving heavy furniture, loading or unloading trucks, shoveling or equivalent manual labor); and moderate activities (e.g. brisk walking, bowling, bicycling on level ground, tai chi and chi kung). Participants reporting any strenuous sporting activity or vigorous work were combined and compared to those reporting no activity for the present analysis due to low levels of activity. Usual sleep duration was assessed by asking participants the following question: "On the average,during the last year, how many hours in a day did you sleep?",with the following response categories: 5 hours or less, 6 hours,7 hours, 8 hours, 9 hours, and 10 hours or more.
Case Ascertainment
Identification of incident colorectal cancer cases and deaths among cohort members were accomplished by record linkage analysis of the cohort database with respective databases from the population-based Singapore Cancer Registry and the Singapore Registry of Births and Deaths. The nationwide cancer registry has been in place since 1968 and has been shown to be comprehensive in its recording of cancer cases.1 As of April 2008, only 27 cases were known to be lost to follow-up due to migration out of Singapore. As of December 31, 2007, 980 participants included in this study had developed invasive colorectal cancer (596 colon cancers and 384 rectal cancers). In the analysis, rectal cancers included cancers of the recto-sigmoid junction. The diagnoses of 951 (97.0 %) colorectal cancer cases were confirmed histologically and the remaining cases were diagnosed clinically (n= 23) or identified through death certificates only (n = 6).
Statistical Analysis
Study participants were initially grouped according to 8 categories of BMI, as reported at the baseline interview (< 18.5, 18.5–19.9, 20.0–21.4, 21.5–22.9, 23.0–24.4, 24.5–25.9, 26.0–27.4, ≥ 27.5). These categories were created to allow for a detailed examination of the association between BMI and colorectal cancer based on the distribution of BMI in the study population with the consideration of BMI cut points recommended by the World Health Organization (WHO) working group for Asian populations (BMI < 18.5 = underweight, 18.5–22.9 = normal weight, 23.0–27.4 = overweight, ≥27.5 = obese).22 We collapsed these categories further based upon similar age and sex standardized cancer rates (<18.5, 18.5–21.4, 21.5–24.4, 24.5–27.4, ≥27.5) to improve the precision of the estimates, and allow for more detailed examination through interaction and stratification. This approach did not alter the results. For each study subject, person-years were counted from the date of baseline interview to the date of cancer diagnosis, the date of death, date of last contact (for the few subjects who migrated out of Singapore) or December 31, 2007, whichever occurred first. Baseline characteristics were calculated for participants across each category of BMI. Age and sex standardized cancer rates were calculated using the person-year weight of the entire cohort during the follow-up by the following age categories: (<50, 50–54, 55–59, 60–64, 65–69, 70+).
Proportional hazards (Cox) regression methods were used to examine the associations between BMI and risk of colorectal cancer. All regression analyses were conducted using SAS statistical software version 9.1 (SAS institute, Cary, NC). We estimated the hazard ratio (HR) of colorectal cancer for levels of BMI and the corresponding 95% confidence interval (CI). There was no evidence that proportional hazards assumptions were violated as indicated by the lack of significant interaction between BMI and a function of survival time in the models. The referent BMI category was chosen based on the lowest age and sex standardized cancer rate. Our primary Cox regression model included the following covariates: Age (<50, 50–54, 55–59, 60–64, ≥65 y), sex, year of interview (1993–95 and 1996–98), dialect (Hokkien vs. Cantonese), level of education (no formal schooling, primary school, secondary school or above), baseline physician diagnosed diabetes mellitus (yes v. no), familial history of colorectal cancer (yes v. no), smoking (never smokers, light smokers, heavy smokers), alcohol intake (never/occasionally, weekly, daily), any vigorous work or strenuous physical activity (yes vs. no), sleep (< 6 or ≥ 9 hr/night v. 6–8 hr/night), quintile of vegetable, fruit, and soy rich dietary pattern score, and total energy intake (Kcal/day). Hormone replacement use by women in the cohort was low(6%), as was use of vitamin supplements (6%) and use of non-steroidalanti-inflammatory drugs (1%) irrespective of gender.
The presence of a linear or quadratic (the U or J-shaped curve) BMI-cancer association was examined by including a linear or linear and quadratic terms of the median BMI value within each BMI category in the Cox regression models. Separate product terms of smoking, age and sex with BMI were included in Cox regression models to examine potential interactions. We also carried out a stratified analysis based on ever v. never smoking since the distribution of BMI and cancer rates differed between ever v. never smokers. To reduce potential bias due to preexisting disease or illness-related weight loss, as well as accounting for the anorectic effects of cigarette smoking,23, 24 an analysis excluding subjects with reported history of diabetes at baseline, history of smoking, and colorectal cancer incidence within the first 5 years post-enrollment was completed. Lastly, we examined the association by localized versus advanced cancer as determined by the Dukes staging system (A and B vs. C and D).
Results
The distribution of selected demographic and lifestyle factors by BMI are presented in Table 1. Of 51,251 participants included in the analysis, 980 developed colorectal cancers. Women comprised 27,881 of the study population and 431 cases. The mean age (SD) at entry into the study was 55.9 (7.9) with mean follow up time (SD) of 11.5 (2.9) years. The mean age (SD) at baseline for those diagnosed with cancer was 60.5 (7.8) with mean follow up time (SD) of 7.0 (3.5) years and the mean age (SD) at baseline was 55.8 (7.9) years with mean follow up time (SD) of 11.6 (2.8) years for those who were not diagnosed with cancer.
Table 1.
Participant characteristics according to body mass index (BMI) at baseline
| Characteristics | <18.5 | 18.5–21.4 | 21.5–24.4 | 24.5–27.4 | ≥27.5 | P Trend |
|---|---|---|---|---|---|---|
| N | 3,850 | 13,705 | 17,730 | 10,650 | 5,316 | < 0.0001 |
| Age | 57.2 | 55.9 | 55.7 | 55.9 | 55.8 | < 0.0001 |
| Sex (% Women) | 51.8 | 54.2 | 54.0 | 53.5 | 59.6 | < 0.0001 |
| Education (% Secondary) | 29.7 | 34.0 | 33.2 | 29.8 | 25.3 | < 0.0001 |
| Diabetes Mellitus (%) | 4.1 | 6.3 | 9.0 | 11.2 | 14.0 | < 0.0001 |
| Ever smoked (%) | 41.3 | 32.5 | 28.8 | 27.6 | 26.6 | < 0.0001 |
| Alcohol (% Daily) | 5.8 | 4.3 | 3.1 | 2.5 | 2.3 | < 0.0001 |
| § Dietary pattern (top 20%) | 18.9 | 20.2 | 20.0 | 20.1 | 20.0 | 0.47 |
| Energy intake (kcal) | 1542 | 1586 | 1582 | 1581 | 1564 | 0.82 |
| ∞ Any physical activity (%) | 12.8 | 15.4 | 16.2 | 15.3 | 13.0 | 0.30 |
| Sleep (hours) | 7.0 | 7.0 | 7.0 | 7.0 | 7.0 | 0.10 |
Any vigorous work or strenuous physical activity
Dietary pattern (top 20%) = Dietary pattern score of greatest conformity in the population to a diet rich in vegetables, fruit and soy foods
Relative risks for colorectal cancer by BMI are given in Table 2 for all cases and by site. Individuals with BMI’s of 21.5–24.4 kg/m2 had the lowest age- and sex-standardized incidence rate of colorectal cancer and colon cancer as well, whereas the lowest incidence rates of rectal cancer were seen in underweight (BMI’s < 18.5) or obese people (BMI’s ≥27.5). BMI’s ≥27.5 were associated with an increased risk of colorectal cancer. This association was driven by colon cancer, which had a strong, positive association with BMI’s ≥27.5 and a suggestive increase in risk in BMI’s < 18.5 for an overall quadratic, U-shaped association (p=0.014). There was no association between BMI and rectal cancer.
Table 2.
Standardized Colorectal cancer rate and hazard ratios according to body mass index (BMI) in SCHS
| <18.5 | 18.5–21.4 | 21.5–24.4 | 24.5–27.4 | ≥27.5 | P trend | ||
|---|---|---|---|---|---|---|---|
| Colorectal Cancer | |||||||
| No. cases/N | 76/3,850 | 273/13,705 | 318/17,730 | 199/10,650 | 114/5,316 | ||
| * Standardized rate | 177 | 174 | 156 | 165 | 188 | Linear | Quadratic |
| HR (95% CI) | 1.03 (0.80–1.32) | 1.12 (0.95–1.31) | 1.0 | 1.05 (0.88–1.25) | 1.25 (1.01–1.55) | 0.44 | 0.23 |
| Colon Cancer | |||||||
| No. cases | 51 | 162 | 181 | 123 | 79 | ||
| * Standardized rate | 119 | 103 | 89 | 103 | 130 | ||
| HR (95% CI) | 1.23 (0.90–1.68) | 1.17 (0.95–1.45) | 1.0 | 1.12 (0.89–1.43) | 1.48 (1.13–1.92) | 0.31 | 0.014 |
| Rectal Cancer | |||||||
| No. cases | 25 | 111 | 137 | 76 | 35 | ||
| * Standardized rate | 58 | 71 | 67 | 63 | 58 | ||
| HR (95% CI) | 0.77 (0.50–1.19) | 1.04 (0.81–1.34) | 1.0 | 0.95 (0.71–1.25) | 0.93 (0.64–1.36) | 0.92 | 0.29 |
SCHS= Singapore Chinese Health Study
P trend: value for linearand quadratic term(U or J shaped) using median of BMI in each category as continuous variable
Standardized rate=Age and sex standardized cancer rate per 100,000 person years using person year time, age & sex distributions of SCHS HR (95% CI) = Hazard Ratio; 95 % confidence interval: Model adjusted for age, sex, year of enrollment, dialect, education, diabetes status, familial history of cancer, smoking, alcohol intake, dietary pattern score, physical activity, sleep and energy intake
Relative risks for colorectal cancer by BMI stratified by smoking status are presented in Table 3. Overall, ever smokers had higher incidence rate of colorectal cancer than never smokers. Among never smokers, there was a stronger quadratic, U-shaped association between BMI and colon cancer. Compared with BMI of 21.5–24.4, HR of colon cancer for BMI <18.5 and BMI ≥ 27.5 were 1.47 (95% CI =0.99–2.20) and 1.59 (95% CI = 1.16–2.16), respectively (P for quadratic =0.004). However, there was no association between BMI and rectal cancer. Among ever smokers, BMI was not associated with either colon or rectal cancer risk. Adjusting for duration and amount of cigarettes smoked did not alter the null association between BMI and cancer risk.
Table 3.
Standardized Colorectal cancer rate and hazard ratios according to BMI stratified by smoking: SCHS
| <18.5 | 18.5–21.4 | 21.5–24.4 | 24.5–27.4 | ≥27.5 | P trend | ||
|---|---|---|---|---|---|---|---|
| Never-smokers N=35,766 | |||||||
| Colorectal Cancer | |||||||
| No. cases/N | 39/2,260 | 153/9,255 | 189/12,632 | 128/7,716 | 80/3,903 | ||
| * Standardized rate | 149 | 141 | 128 | 143 | 177 | Linear | Quadratic |
| HR (95% CI) | 1.17 (0.83–1.66) | 1.16 (0.94–1.44) | 1.0 | 1.08 (0.87–1.36) | 1.35 (1.04–1.76) | 0.46 | 0.056 |
| Colon Cancer | |||||||
| No. cases | 30 | 103 | 115 | 84 | 59 | ||
| * Standardized rate | 115 | 95 | 78 | 94 | 131 | ||
| HR (95% CI) | 1.47 (0.99–2.20) | 1.29 (0.99–1.68) | 1.0 | 1.15 (0.87–1.53) | 1.59 (1.16–2.16) | 0.58 | 0.004 |
| Rectal Cancer | |||||||
| No. cases | 9 | 50 | 74 | 44 | 21 | ||
| * Standardized rate | 34 | 46 | 50 | 49 | 46 | ||
| HR (95% CI) | 0.70 (0.35–1.40) | 0.96 (0.67–1.38) | 1.0 | 0.98 (0.67–1.42) | 0.96 (0.59–1.56) | 0.63 | 0.42 |
| Ever-smokers N=15,485 | |||||||
| BMI | <18.5 | 18.5–21.4 | 21.5–24.4 | 24.5–27.4 | ≥27.5 | ||
| Colorectal Cancer | |||||||
| No. cases/N | 37/1,590 | 120/4,450 | 129/5,098 | 71/2,934 | 34/1,413 | ||
| * Standardized rate | 221 | 248 | 230 | 229 | 219 | Linear | Quadratic |
| HR (95% CI) | 0.87 (0.60–1.26) | 1.04 (0.81–1.33) | 1.0 | 0.98 (0.73–1.31) | 1.08 (0.74–1.58) | 0.61 | 0.78 |
| Colon Cancer | |||||||
| No. cases | 21 | 59 | 66 | 39 | 20 | ||
| * Standardized rate | 126 | 122 | 118 | 127 | 129 | ||
| HR (95% CI) | 0.94 (0.57–1.54) | 0.99 (0.69–1.41) | 1.0 | 1.06 (0.71–1.57) | 1.26 (0.76–2.08) | 0.35 | 0.71 |
| Rectal Cancer | |||||||
| No. cases | 16 | 61 | 63 | 32 | 14 | ||
| * Standardized rate | 96 | 126 | 112 | 102 | 90 | ||
| HR (95% CI) | 0.80 (0.46–1.40) | 1.09 (0.76–1.55) | 1.0 | 0.89 (0.58–1.37) | 0.90 (0.50–1.61) | 0.80 | 0.41 |
SCHS= Singapore Chinese Health Study
P trend: value for linearand quadratic term(U or J shaped) using median of BMI in each category as continuous variable
Standardized rate=Age and sex standardized cancer rate per 100,000 person years using person year time, age & sex distributions of SCHS HR (95% CI) = Hazard Ratio; 95 % confidence interval: Model adjusted for age, sex, year of enrollment, dialect, education, diabetes status, familial history of cancer, alcohol intake, dietary pattern score, physical activity, sleep and energy intake
We examined the BMI/cancer association separately in men versus women. There was no evidence the association differed by sex (p=0.60). Men did have higher rates per 100,000 person-years follow up across the spectrum of BMI compared to women (colon cancer rates men- 151, 113, 105, 120, 138 and women-91, 95, 76, 80, 125) for BMI groups (< 18.5, 18.5–21.4, 21.5– 24.4, 24.5–27.4, ≥ 27.5).
Because BMI is a less reliable marker of adiposity due to differential loss of muscle and bone mass in persons aged 65 years and above, 24, 25 we examined the BMI/cancer association separately among subjects less than 65 years versus those age 65 years or older. In 42,340 participants < age 65 years (384 colon cancer cases), an increased risk was observed in BMI’s ≥27.5, (HR=1.40, 95% CI (1.01–1.93)), and there was suggestive increase in BMI’s < 18.5 (HR=1.25, 95% CI (0.85–1.83)), P value quadratic =0.05. In 8,911 (212 colon cancer cases) participants ≥age 65 years, a stronger risk was observed in BMI’s ≥27.5, (HR=1.66, 95% CI (1.05–2.62)) and a similar suggestive risk was observed in BMI’s < 18.5 (HR=1.21, 95% CI (0.71–2.06)). There was no evidence the BMI/cancer association differed between the two age groups (p=0.37). Greater rates of cancer also were observed in ages 65 years and above (data not reported).
Figure 1 presents the results of a model examining colon cancer risk in participants who never smoked, were free of diabetes at baseline and did not develop colon cancer in the first five years of follow up. BMI’s < 18.5 and ≥27.5 were associated with an increased risk of colon cancer and the point estimates were strengthened compared to the main analysis with a stronger quadratic, U-shaped association (p=0.002). Figure 2 presents data for the same set of participants as Figure 1 and considers localized vs. advanced colon cancers. There is a significant U-shaped quadratic association in both groups with more pronounced point estimates for BMI’s ≥27.5 for localized colon cancer and BMI’s < 18.5 for advanced colon cancer.
Figure 1.
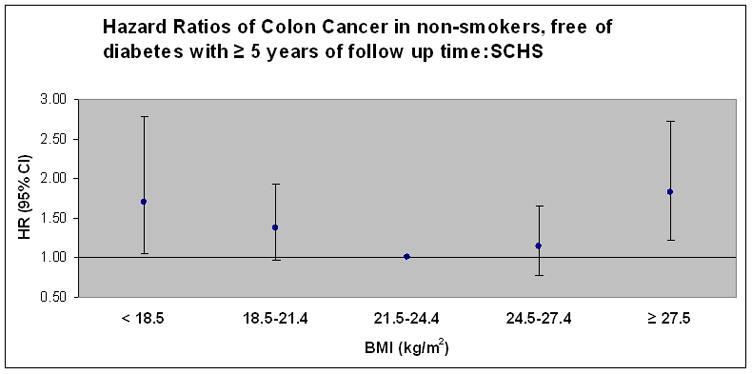
Hazard ratios of colon cancer in never-smokers, without reported diabetes, and excluding persons with less than 5 years of follow up time (N=31,851 and 236 cases colon cancer). Model adjusted for age, sex, year of enrollment, dialect, education, familial history of cancer, alcohol intake, dietary pattern score, physical activity, sleep and energy intake. Points represent hazard ratio (HR) point estimate and error bars represent 95% confidence intervals. P value for quadratic association =0.0016. Respective case counts for colon cancer by BMI (< 18.5, 18.5–21.4, 21.5–24.4, 24.5–27.4, ≥ 27.5): Cancer (21, 65, 67, 48, 37).
Figure 2.

Hazard ratios of colon cancer in never-smokers, without reported diabetes, and excluding persons with less than 5 years of follow up time stratified by staging level (local vs. advanced) of cases (Duke=A or B for local) and (Duke= C or D for advanced) (N=31,670 and 128 cases localized colon cancer, Duke=A or B).and (N=31,706 and 120 cases advanced colon cancer, Duke = C or D). Model adjusted for age, sex, year of enrollment, dialect, education, familial history of cancer, alcohol intake, dietary pattern score, physical activity, sleep, and energy intake. Points represent hazard ratio (HR) point estimate and error bars represent 95% confidence intervals. P value for quadratic association =0.003 for localized and p=0.045 for advanced.
Lastly, we examined weight change in relation to colon cancer in 27,602 (159 cases of colon cancer) never-smokers, without a history of diabetes and free of cancer at follow up I (interviewed 1999–2004), who also provided a weight at follow up I. We did not find significant weight gain ( ≥ +10 % body weight) or loss ( ≥ − 10% body weight) over approximately six years to be associated with colon cancer incidence (data not presented). On the other hand, the U-shaped association between baseline BMI and colon cancer risk persisted (p quadratic =0.0003) (HR= 1.88, 95% CI 1.04–3.39, BMI < 18.5) and (HR=2.23, 95% CI 1.39–3.59, BMI ≥27.5) after further adjustment for percentage of weight change.
Discussion
In this large prospective cohort of Chinese men and women in Singapore we observed a quadratic, U-shaped association between BMI and incidence of colon cancer with increased risk at BMI’s ≥27.5 and BMI’s < 18.5. The association was more pronounced in never-smokers; and most prominent when further limiting the sample to those free of diabetes and cases with greater than five years of follow up. The quadratic association held when considering localized vs. advanced cases with more pronounced associations in BMI’s ≥27.5 for localized cases and BMI’s < 18.5 for advanced cases. There was no association between BMI and rectal cancer. Stratified analyses by sex and age provided no evidence of differential risk although men had greater rates of colorectal cancer and rates were significantly greater in those aged 65 years and above.
Our results are not consistent with the handful of prospective studies on this topic in Asian populations. In approximately 29,000 Japanese men and women, a significant association in men (RR=2.11, 95% CI= 1.26 – 3.53) was observed for colon cancer in comparison of the top tertile of BMI (>23.6 kg/m2) to the 1st tertile (<21.6 kg/m2) while no association was observed in women or either sex with rectal cancer.12 No comparison with underweight BMI’s (< 18.5) was reported. In another Japanese cohort BMI’s > 25.0 kg/m2 were associated with an increased risk of colon cancer in men relative to BMI’s < 25.11 No association was observed in women for colon cancer, and in rectal cancer for either sex. Furthermore, BMI’s < 25 were not categorized and specifically examined in relation to colon cancer. Kuriyama et al. examined over 27,000 middle-aged Japanese women and men and found no significant association between BMI and colon or rectal cancer.9 In this Japanese study the BMI data were grouped and analyzed according to Western cut-points and the majority of participants as well as cases were found in the referent category (BMI 18.5–24.9 kg/m2) giving small case numbers in the specific cancer sites in higher BMI’s. Furthermore, almost 1,600 participants were excluded with a BMI < 18.5, so the low end of the BMI spectrum was not examined.
Two different studies using data from a national insurance registry in Korea examined the association in men,10 and in both sexes.8 Oh et al. observed increased risks for colon cancer in BMI’s 23–26.9, and 30+ kg/m2 relative to BMI’s 18.5–23.0 and no association in BMI’s < 18.5 kg/m2.10 When the analysis was limited to never-smokers the association for colon cancer was only significant in BMI’s 25–26.9. Never-smokers with a BMI > 27.0 also were at increased risk for rectal cancer. A possible reason the findings differ relative to our study is the age range in the Korean study was more heterogeneous since men aged 20 and older were included. Thus, a number of participants were younger and had very low risk of colon or rectal cancer. They also likely had a general difference in body composition at the same BMI level from middle aged and older men who were at greater risk for the cancer. Furthermore, the authors report it is not clear whether cancer ascertainment is complete. If cancer ascertainment differed by level of BMI this could influence the results. Jee et al. observed inverse associations for colon cancer in men aged 30–95 years at BMI’s < 20.0 kg/m2 and 20–22.9 and positive associations at BMI’s 25–29.9 and ≥30 kg/m2 compared to BMI’s 23–24.9 after adjustment for age and smoking habits.8 An inverse association for rectal cancer in men was observed in BMI’s < 20.0 and 20–22.9. In the same analysis in women, there was no association between BMI and rectal cancer and an inverse association with colon cancer in BMI’s < 20.0 and 20–22.9.8 BMI’s < 18.5 were not directly examined due to the categorical grouping. Similar to the other Korean based population study, the wide age range might be a reason for the different shape and relation between BMI and colorectal cancer of our study population from those of Korean study populations.
Numerous studies examined the BMI in relation to incident colorectal cancer in Western populations. A recent meta-analysis on this topic presented a monotonic increase in risk of colon cancer with increasing BMI’s > 23 relative to BMI < 23.26 Of interest, the magnitude of risk estimate for colon cancer for obesity (BMI ≥30) was similar to that for BMI ≥27.5 in Chinese Singaporeans. The meta-analysis did not present the association between underweight (BMI < 18.5) and colon cancer risk since the lowest BMI category presented was < 23.0. Similar to the studies in Asian populations, the majority of studies conducted in Western populations that were included in the meta-analysis26 also combined <18.5 kg/m2 with normal BMI range (<23 kg/m2) or excluded them from their analyses. Thus the data do not refute or support any association of underweight or low BMI with colon cancer.
The exact mechanisms that link excess weight with colon cancer are uncertain. The majority of research points towards insulin and insulin-like growth factor axis being involved. Briefly, the insulin–cancer hypothesis postulates that chronic hyperinsulinemia decreases concentrations of IGF binding protein-1 and IGF binding protein-2, which leads to higher bioavailability or free IGF-1 with cellular changes favoring tumor formation.27 Circulating total IGF-1, a major determinant of free IGF-1 concentrations, is considered a risk factor for colorectal cancer as well.28, 29 However, total IGF-1 levels are lower in underweight and overweight persons relative to normal weight persons.27, 30 Sex hormones and adipokines have also received significant attention for their potential role mechanistically between excess weight and cancer.31 Indeed, there are important limitations to consider with these hypotheses as well as other hypotheses and developing areas of knowledge.31
Similarly, the mechanisms that may link underweight with an increased risk of colon cancer are unclear. Leanness as a risk factor for cancer of different organs has been noted.32, 33 In accordance with the leanness-cancer hypothesis is oxidative DNA stress.34 In a longitudinal study of BMI and a marker of oxidative DNA damage, decreasing levels of BMI, regardless of smoking status, were associated with significantly increased levels of DNA oxidative damage.35 Low grade inflammation has been found to occur in persons with low BMI’s,36 and has been noted as a risk factor for colon cancer independent of BMI37 and as a stronger risk factor in lean vs. heavy persons.38 The ability of low grade inflammation to compromise the immune system and thus affect cancer risk is another consideration.39 Cancer screening practices are another consideration as data has shown underweight persons are more likely to delay screening relative to normal weight persons.40 Cultural hurdles to screening in this population may be an even larger underlying issue.3
Strengths of our study include the assumption that colorectal cancer case ascertainment was complete given Singapore is a small city-state where there is thorough specialized medical care available and the nationwide cancer registry has been in place since 1968 and has been shown to be comprehensive in its recording of cases.1 Furthermore, in our comprehensive analysis we were able to account for many known potential modifiers and confounders of the association between BMI and colorectal cancer. A large sample size and ample amount of events combined with a long follow up time are other strengths as is the ability to account for local vs. advanced case status.
Limitations include the use of self-reported height, weight and other demographic and lifestyle data. Additional data on other measures of body habitus may complement BMI in this population and contribute to further understanding. As well, multiple assessments of relative weight may offer further insight on the topic. Furthermore, despite thorough adjustment for smoking, alcohol, dietary patterns, activity and sleep residual confounding and unmeasured confounding need to be considered in the interpretation. We also did not have information on cohort participant cancer screening practices.
In summary, we found a U-shaped, quadratic association between BMI and colon cancer, and no association of BMI with rectal cancer. The colon cancer association did not differ by sex or age, but greater rates were observed in men and in those aged 65 and above. The association was more pronounced in never-smokers and the association in ever-smokers was null. Smokers, however, did have greater rates of colorectal cancer and a differing distribution of BMI. Furthermore, localized cases had a more pronounced association in BMI’s ≥27.5, whereas advanced cases had a more pronounced association in BMI’s < 18.5 kg/m2. Our comprehensive study is not in general agreement with other prospective studies in Asian populations in terms of the range of BMI where risk begins to increase; however, different methods and analytic approaches in the few other studies preclude any firm conclusions. Our results do generally align with western populations showing an increased risk of colon cancer with population specific obesity; however, our findings of an increased risk with underweight are novel. Further research is needed to examine and understand the association between BMI, colon and rectal cancers in specific Asian populations, and any potential mechanisms involved. Our study especially highlights the need for further investigation into the association between underweight status and colon cancer.
Acknowledgments
We thank Siew-Hong Low of the National University of Singapore for supervising the field work of the Singapore Chinese Health Study, and Kazuko Arakawa and Renwei Wang for the development and maintenance of the cohort study database. We also thank the Singapore Cancer Registry for assistance with the identification of cancer outcomes via database linkages.
Financial support: Financial support: National Institutes of Health, USA (NCI RO1 CA055069, R35 CA053890, R01 CA080205, R01 CA098497, and R01 CA144034).
Footnotes
Competing interest declaration: All authors have no financial or non-financial interests that may be relevant to the submitted work.
References
- 1.Parkin DM, Whelan SL, Ferlay J, Teppo L, Thomas D. IARC Scientific Publications No. 155. VIII. Lyon: International Agency for Research on Cancer; 2002. Cancer Incidence in Five Continents. [Google Scholar]
- 2.de Kok IM, Wong CS, Chia KS, Sim X, Tan CS, Kiemeney LA, Verkooijen HM. Gender differences in the trend of colorectal cancer incidence in Singapore, 1968–2002. Int J Colorectal Dis. 2008;23:461–7. doi: 10.1007/s00384-007-0421-9. [DOI] [PubMed] [Google Scholar]
- 3.Sung JJY, Lau JYW, Goh KL, Leung WK Asia Pacific Working Group on Colorectal Cancer. Increasing incidence of colorectal cancer in Asia: implications for screening. Lancet Oncol. 2005;6:871–6. doi: 10.1016/S1470-2045(05)70422-8. [DOI] [PubMed] [Google Scholar]
- 4.Sung JJ, Lau JY, Young GP, Sano Y, Chiu HM, Byeon JS, Yeoh KG, Goh KL, Sollano J, Rerknimitr R, Matsuda T, Wu KC, Ng S, Leung SY, Makharia G, Chong VH, Ho KY, Brooks D, Lieberman DA, Chan FK. Asia Pacific consensus recommendations for colorectal cancer screening. Gut. 2008;57:1166–76. doi: 10.1136/gut.2007.146316. [DOI] [PubMed] [Google Scholar]
- 5.Renehan A, Tyson M, Egger M, Heller RF, Zwahlen M. Body-mass index and incidence of cancer: a systematic review and meta-analysis of prospective observational studies. Lancet. 2008;371:569–78. doi: 10.1016/S0140-6736(08)60269-X. [DOI] [PubMed] [Google Scholar]
- 6.Deurenberg P, Yap M, Van Staveren WA. Body mass index and percent body fat: a meta analysis among different ethnic groups. Int J Obes Relat Metab Disord. 1998;22:1164–71. doi: 10.1038/sj.ijo.0800741. [DOI] [PubMed] [Google Scholar]
- 7.Deurenberg P, Deurenberg-Yap M, Guricci S. Asians are different from Caucasians and from each other in their body mass index/body fat per cent relationship. Obes Rev. 2002;3(3):141–6. doi: 10.1046/j.1467-789x.2002.00065.x. Available from http://www.ncbi.nlm.nih.gov/entrez/query.fcgi?cmd=Retrieve&db=PubMed&dopt=Citation&list_uids=12164465. [DOI] [PubMed]
- 8.Jee S, Yun JI, Park EJ, Cho ER, Park IS, Sull JW, Ohrr H, Samet JM. Body mass index and cancer risk in Korean men and women. Int J Cancer. 2008;123:1892–96. doi: 10.1002/ijc.23719. [DOI] [PubMed] [Google Scholar]
- 9.Kuriyama S, Tsubono Y, Hozawa A, Shimazu T, Suzuki Y, Koizumi Y, Suzuki Y, Ohmori K, Nishino Y, Tsuji I. Obesity and Risk of Cancer in Japan. Int J Cancer. 2005;113:148–57. doi: 10.1002/ijc.20529. [DOI] [PubMed] [Google Scholar]
- 10.Oh S, Yoon YS, Shin SA. Effects of Excess Weight on Cancer Incidences Depending on Cancer Sites and Histologic Findings Among Men: Korea National Health Insurance Corporation Study. J Clin Oncol. 2005;23:4742–54. doi: 10.1200/JCO.2005.11.726. [DOI] [PubMed] [Google Scholar]
- 11.Otani T, Iwasaki M, Inoue M, Tsugane S. Body mass index, body height, and subsequent risk of colorectal cancer in middle-aged and elderly Japanese men and women: Japan public health center-based prospective study. Cancer Causes Control. 2005;16:839–50. doi: 10.1007/s10552-005-4573-z. [DOI] [PubMed] [Google Scholar]
- 12.Shimizu N, Nagata C, Shimizu H, Kametani M, Takeyama M, Ohnuma T, Matsushita S. Height, weight, and alcohol consumption in relation to the risk of colorectal cancer in Japan: a prospective study. British Journal of Cancer. 2006;88:1038–43. doi: 10.1038/sj.bjc.6600845. [DOI] [PMC free article] [PubMed] [Google Scholar]
- 13.WHO expert, consultation. Appropriate body-mass index for Asian populations and its implications for policy and intervention strategies. Lancet. 2004;363:157–63. doi: 10.1016/S0140-6736(03)15268-3. [DOI] [PubMed] [Google Scholar]
- 14.Hankin JH, Stram DO, Arakawa K, Park S, Low SH, Lee HP, Yu MC. Singapore Chinese Health Study: development, validation, and calibration of the quantitative food frequency questionnaire. Nutr Cancer. 2001;39(2):187–95. doi: 10.1207/S15327914nc392_5. Available from http://www.ncbi.nlm.nih.gov/entrez/query.fcgi?cmd=Retrieve&db=PubMed&dopt=Citation&list_uids=11759279. [DOI] [PubMed]
- 15.Hu FB. Obesity Epidemiology. Vol. 1. New York: Oxford University Press; 2008. [Google Scholar]
- 16.Wada K, Tamakoshi K, Tsunekawa T, Otsuka R, Zhang H, Murata C, Nagasawa N, Matsushita K, Sugiura K, Yatsuya H, Toyoshima H. Validity of self-reported height and weight in a Japanese workplace population. Int J Obes (Lond) 2005;29:1093–9. doi: 10.1038/sj.ijo.0803012. [DOI] [PubMed] [Google Scholar]
- 17.Tsong WH, Koh WP, Yuan JM, Wang R, Sun CL, Yu MC. Cigarettes and alcohol in relation to colorectal cancer: the Singapore Chinese Health Study. British Journal of Cancer. 2007;96(5):821–7. doi: 10.1038/sj.bjc.6603623. Available from http://www.ncbi.nlm.nih.gov/entrez/query.fcgi?cmd=Retrieve&db=PubMed&dopt=Citation&list_uids=17311023. [DOI] [PMC free article] [PubMed]
- 18.Seow A, Yuan JM, Koh WP, Lee HP, Yu MC. Diabetes mellitus and risk of colorectal cancer in the Singapore Chinese Health Study. Journal of the National Cancer Institute. 2006;98(2):135–8. doi: 10.1093/jnci/djj015. [DOI] [PubMed] [Google Scholar]
- 19.Seow A, Shi CY, Chung FL, Jiao D, Hankin JH, Lee HP, Coetzee GA, Yu MC. Urinary total isothiocyanate (ITC) in a population-based sample of middle-aged and older Chinese in Singapore: relationship with dietary total ITC and glutathione S-transferase M1/T1/P1 genotypes. Cancer Epidemiol Biomarkers Prev. 1998;7(9):775–81. Available from http://www.ncbi.nlm.nih.gov/entrez/query.fcgi?cmd=Retrieve&db=PubMed&dopt=Citation&list_uids=9752985. [PubMed]
- 20.Seow A, Shi CY, Franke AA, Hankin JH, Lee HP, Yu MC. Isoflavonoid levels in spot urine are associated with frequency of dietary soy intake in a population-based sample of middle-aged and older Chinese in Singapore. Cancer Epidemiol Biomarkers Prev. 1998;7(2):135–40. Available from http://www.ncbi.nlm.nih.gov/entrez/query.fcgi?cmd=Retrieve&db=PubMed&dopt=Citation&list_uids=9488588. [PubMed]
- 21.Butler LM, Wang R, Koh WP, Yu MC. Prospective study of dietary patterns and colorectal cancer among Singapore Chinese. British Journal of Cancer. 2008;99:1511–16. doi: 10.1038/sj.bjc.6604678. [DOI] [PMC free article] [PubMed] [Google Scholar]
- 22.Appropriate body-mass index for Asian populations and its implications for policy and intervention strategies. Lancet. 2004;363(9403):157–63. doi: 10.1016/S0140-6736(03)15268-3. Available from http://www.ncbi.nlm.nih.gov/entrez/query.fcgi?cmd=Retrieve&db=PubMed&dopt=Citation&list_uids=14726171. [DOI] [PubMed]
- 23.Durazo-Arizu R, Cooper RS. Issues related to modeling the body mass index-mortality association: the shape of the association and the effects of smoking status. International Journal of Obesity. 2008;32:S52–S55. doi: 10.1038/ijo.2008.86. [DOI] [PubMed] [Google Scholar]
- 24.Manson J, Bassuk SS, Hu FB, et al. Estimating the Number of Deaths due to Obesity: Can the Divergent Findings be Reconciled? Journal of Women's Health. 2007;16(2):168–76. doi: 10.1089/jwh.2006.0080. [DOI] [PubMed] [Google Scholar]
- 25.Miller SL, Wolfe RR. The danger of weight loss in the elderly. J Nutr Health Aging. 2008;12(7):487–91. doi: 10.1007/BF02982710. [DOI] [PubMed] [Google Scholar]
- 26.Ning Y, Wang L, Giovannucci EL. A quantitative analysis of body mass index and colorectal cancer: findings from 56 observational studies. Obes Rev. 2010;11(1):19–30. doi: 10.1111/j.1467-789X.2009.00613.x. [DOI] [PubMed] [Google Scholar]
- 27.Renehan AG, Frystyk J, Flyvbjerg A. Obesity and cancer risk: the role of the insulin–IGF axis. Trends Endocrinol Metab. 2006;17:328–36. doi: 10.1016/j.tem.2006.08.006. [DOI] [PubMed] [Google Scholar]
- 28.Wong H-L, Koh WP, Probst-Hensch NM, Van den Berg D, Yu MC, Ingles SA. Insulin-like growth factor-1 promoter polymorphisms and colorectal cancer: a functional genomics approach. Gut. 2008;57:1090–96. doi: 10.1136/gut.2007.140855. [DOI] [PMC free article] [PubMed] [Google Scholar]
- 29.Renehan AG, Zwahlen M, Minder C, O’Dwyer ST, Shalet SM, Egger M. Insulin-like growth factor (IGF)-I, IGF binding protein-3, and cancer risk: systematic review and meta-regression analysis. Lancet. 2004;363:1346–53. doi: 10.1016/S0140-6736(04)16044-3. [DOI] [PubMed] [Google Scholar]
- 30.Yamamoto H, Kato Y. Relationship between plasma insulin-like growth factor I (IGF-I) levels and body mass index (BMI) in adults. Endocr J. 1993;40(1):41–5. doi: 10.1507/endocrj.40.41. [DOI] [PubMed] [Google Scholar]
- 31.Roberts DL, Dive C, Renehan AG. Biological Mechanisms Linking Obesity and Cancer Risk: New Perspectives. Annu Rev Med. 2010;61:301–16. doi: 10.1146/annurev.med.080708.082713. [DOI] [PubMed] [Google Scholar]
- 32.Gallus S, La Vecchia C, Levi F, Simonato L, Dal Maso L, Franceschi S. Leanness and squamous cell oesophageal cancer. Ann Oncol. 2001;12(7):975–9. doi: 10.1023/a:1011104809985. [DOI] [PubMed] [Google Scholar]
- 33.Koh WP, Yuan JM, Wang R, Lee HP, Yu MC. Body mass index and smoking-related lung cancer risk in the Singapore Chinese Health Study. Br J Cancer. 2010;102(3) doi: 10.1038/sj.bjc.6605496. [DOI] [PMC free article] [PubMed] [Google Scholar]
- 34.Ames BN. Endogenous oxidative DNA damage, aging, and cancer. Radic Res Commun. 1989;7:121–8. doi: 10.3109/10715768909087933. [DOI] [PubMed] [Google Scholar]
- 35.Mizoue T, Tokunaga S, Kasai H, Kawai K, Sato M, Kubo T. Body mass index and oxidative DNA damage: a longitudinal study. Cancer Sci. 2007;98(8):1254–58. doi: 10.1111/j.1349-7006.2007.00511.x. [DOI] [PMC free article] [PubMed] [Google Scholar]
- 36.Nakajima K, Yamaoka H, Morita K, Ebata M, Eguchi S, Muneyuki T, Munakata H. Elderly people with low body weight may have subtle low-grade inflammation. Obesity. 2009;17(4):803–8. doi: 10.1038/oby.2008.596. [DOI] [PubMed] [Google Scholar]
- 37.Aleksandrova k, Jenab M, Boeing H, et al. Circulating C-Reactive Protein Concentrations and Risks of Colon and Rectal Cancer: A Nested Case-Control Study Within the European Prospective Investigation into Cancer and Nutrition. Am J Epidemiol. 2010;172(4):407–18. doi: 10.1093/aje/kwq135. [DOI] [PubMed] [Google Scholar]
- 38.Gunter MJ, Stolzenberg-Solomon R, Cross AJ, Leitzmann MF, Weinstein S, Wood RJ, Virtamo J, Taylor PR, Albanes D, Sinha R. A prospective study of serum C-reactive protein and colorectal cancer risk in men. Cancer Res. 2006;66(4):2483–7. doi: 10.1158/0008-5472.CAN-05-3631. [DOI] [PubMed] [Google Scholar]
- 39.Erdman SE, Poutahidis T. Roles for Inflammation and Regulatory T Cells in Colon Cancer. Toxicologic Pathology. 2010;38:76–87. doi: 10.1177/0192623309354110. [DOI] [PMC free article] [PubMed] [Google Scholar]
- 40.Fontaine KR, Heo M, Allison DB. Body weight and cancer screening among women. J Womens Health Gend Based Med. 2001;10(5):463–70. doi: 10.1089/152460901300233939. [DOI] [PubMed] [Google Scholar]