Abstract
The giant cadherin FAT1 is one of four vertebrate orthologues of the Drosophila tumor suppressor fat. It engages in several functions, including cell polarity and migration, and in Hippo signaling during development. Homozygous deletions in oral cancer suggest that FAT1 may play a tumor suppressor role, although overexpression of FAT1 has been reported in some other cancers. Here we show using Northern blotting that human melanoma cell lines variably but universally express FAT1 and less commonly FAT2, FAT3, and FAT4. Both normal melanocytes and keratinocytes also express comparable FAT1 mRNA relative to melanoma cells. Analysis of the protein processing of FAT1 in keratinocytes revealed that, like Drosophila FAT, human FAT1 is cleaved into a non-covalent heterodimer before achieving cell surface expression. The use of inhibitors also established that such cleavage requires the proprotein convertase furin. However, in melanoma cells, the non-cleaved proform of FAT1 is also expressed at the cell surface together with the furin-cleaved heterodimer. Moreover, furin-independent processing generates a potentially functional proteolytic product in melanoma cells, a persistent 65-kDa membrane-bound cytoplasmic fragment no longer in association with the extracellular fragment. In vitro localization studies of FAT1 showed that melanoma cells display high levels of cytosolic FAT1 protein, whereas keratinocytes, despite comparable FAT1 expression levels, exhibited mainly cell-cell junctional staining. Such differences in protein distribution appear to reconcile with the different protein products generated by dual FAT1 processing. We suggest that the uncleaved FAT1 could promote altered signaling, and the novel products of alternate processing provide a dominant negative function in melanoma.
Keywords: Cell Adhesion, Cell Migration, Protein Processing, Proteolytic Enzymes, Tumor Promoter, Tumor Suppressor Gene, FAT1 Cadherin, Furin, Keratinocyte, Melanoma
Introduction
fat was first identified in Drosophila as a giant member of the cadherin superfamily that functioned as a tumor suppressor gene (1). The first vertebrate fat to be cloned (subsequently renamed FAT1) showed considerable homology to Drosophila FAT in encoding a type 1 transmembrane protein containing 34 cadherin repeats, five EGF-like repeats, and a laminin A–G domain in the extracellular region and a cytoplasmic tail that was quite distinct from classical cadherins (2). Limited studies on human tissues indicated that FAT1 expression is developmentally regulated and largely confined to embryonic tissues, findings confirmed in zebrafish, rats, and mice (3–5). Four FAT genes have now been identified in vertebrates, and McNeill and co-workers (6) have shown that FAT4 is the true structural orthologue of Drosophila FAT in mammals.
Despite this, several pieces of experimental data support the notion proposed by Skouloudaki et al. (7) that the functions of Drosophila FAT signaling are shared between FAT1 and FAT4 in vertebrates. Thus, as with Drosophila FAT, which cooperatively regulates planar cell polarity through binding to Atrophin (8), human FAT1 also physically binds Atrophins 1 and 2 to regulate cell orientation in smooth muscle cells (9). In Drosophila, FAT also participates in the Hippo pathway that regulates cell growth and organ size (10, 11), a function likely relating to its role as a tumor suppressor. FAT1 also shares this functional role at least in zebrafish where it binds and coordinates with Scribble to regulate Yes-associated protein 1 (YAP1), a key downstream regulator of the Hippo pathway during pronephros development (7). There are also data to suggest that this shared functionality between Drosophila FAT and FAT1 may extend to a suppressor function for human FAT1. In a study designed to identify the location of candidate tumor suppressor genes in oral cancer, homozygous deletions of FAT1 were identified in a genome-wide screening of a primary oral cancer (12). Further analysis by genomic PCR revealed that 80% of 20 primary oral cancers exhibited exonic homozygous deletions of FAT1. Also, in an immunohistochemical study of 31 cases of intrahepatic cholangiocarcinoma, Settakorn et al. (13) found that FAT1 expression showed a significant inverse association with the Ki67 index and that loss of membrane localization for FAT1 correlated with more aggressive tumors.
Paradoxically, in their original cloning paper, Dunne et al. (2) recorded that human FAT1 mRNA expression was high in epithelial cells from some breast and colorectal cancers, and immunohistochemical studies of ex vivo breast (14) also showed high levels of cytoplasmic FAT1 expression in the tumor cells. In this report, an analysis of the distribution of FAT1 in cell lines found contrasting expression patterns comparing normal keratinocytes with melanoma cells. In keratinocytes, FAT1 was expressed mainly at cell-cell junctions, whereas melanoma cells displayed abundant intracytoplasmic FAT1 staining. Northern blotting analysis did not show greatly increased levels of transcription or obvious splice variants in the melanoma cells compared with keratinocytes; therefore, we considered the post-translational processing of FAT1 in these cells as a possible explanation.
FAT1 processing has not been studied, but the processing of Drosophila FAT and murine FAT4 has been examined in two recent studies (6, 15). It was shown that FAT was intrinsically cleaved in the early secretory pathway before being expressed on the cell surface as a non-covalently associated heterodimer. Further processing to generate an intracellular fragment able to traverse to the nucleus was dependent upon ligand binding, resulting in casein kinase-dependent phosphorylation followed by enzymic cleavage likely involving an ADAM (a disintegrin and metalloprotease) type metalloprotease sequentially followed by further intracytoplasmic cleavage by the γ-secretase complex.
We show here that, in human keratinocyte and melanoma cell lines, FAT1 is processed by a similar intrinsic cleavage pathway and further demonstrate that the enzyme involved is furin. However, in the melanoma cells, we have identified an alternative intrinsic pathway of FAT1 processing that is furin-independent and results in the generation of a membrane-bound fragment (p65) that could account for the cytoplasmic staining for FAT1 seen in these cells. Our interpretation of these findings is that such alternative processing of FAT1 could enable the tumor cells to utilize the advantageous role of FAT1 in cell migration (16–18) while simultaneously negating the suppressive role of FAT1 in the Hippo pathway.
EXPERIMENTAL PROCEDURES
Cell Lines and Culture
Neonatal human foreskin keratinocytes (a kind gift from Dr. Sean Geary and Prof. Leonie Ashman (University of Newcastle)) were cultured in Keratinocyte-SFM (Invitrogen). Normal human melanocytes were kindly provided by Dr. P. Parsons (Queensland Institute of Medical Research, Queensland, Australia) and cultured in medium purchased from Clonetics (Edward Kellar, Victoria, Australia). The immortalized adult human keratinocyte (HaCaT) cell line was obtained under a material transfer agreement from Deutsches Krebsforschungszentrum (German Cancer Research Center) and cultured in DMEM (Lonza) supplemented with 5–10% fetal bovine serum (Sigma-Aldrich). The panel of human melanoma cell lines used was obtained from various sources as described previously (19–21). Where indicated, cells were treated with 25 μm decanoyl-RVKR-chloromethylketone (a cell-permeable compound known to irreversibly inhibit furin at a Ki of ∼1 nm (Ref. 22; Biomol) for 16 h prior to analysis. A 20 mm stock solution of the inhibitor was made in DMSO with the equivalent volume of DMSO used as a control.
Production of Polyclonal and Monoclonal Anti-FAT1 Antibodies
Serum was collected and stored from two rabbits immunized with a GST fusion protein incorporating the entire cytoplasmic tail of human FAT1 cadherin (GST-Fat1-(4203–4588)). Antibodies were affinity-purified from the serum using a GST fusion protein incorporating the last ∼⅓ of the cytoplasmic tail (GST-Fat1-(4454–4588)). Affinity-purified polyclonal antibodies (pAbs)3 recognizing the extracellular domain of FAT1 were similarly prepared from antiserum obtained commercially (AbSea, Beijing, China) from rabbits immunized with a GST fusion protein incorporating amino acids 1162–1326 (GST-Fat1-(1162–1326)). Murine monoclonal antibodies (mAbs) against the extracellular domain or cytoplasmic domain of FAT1 were produced as described previously (23) from mice immunized with either GST-Fat1-(1162–1326) or GST-Fat1-(4203–4588), respectively. Monoclonal antibodies were purified using Protein G HP SpinTrap columns according to the manufacturer's instructions (GE Healthcare). Isotype-matched mAbs (11H5 anti-CD36 mAbs, murine IgG1; Ref. 23) were used throughout as a negative control.
Northern Blotting
Analyses were performed as described previously (24) with minor modifications. Total RNA was isolated from melanoma cells using an Illustra RNAspin Mini Isolation kit (GE Healthcare), and 20 μg/sample was electrophoresed on 1.2% denaturing agarose gels, transferred to Hybond-N+ membranes (GE Healthcare), and subjected to baking and UV cross-linking. Hybridizations were performed in ExpressHyb (Clontech) using [32P]dCTP cDNA probes (1 × 10⁶ cpm/ml) prepared by random priming (Prime-a-Gene kit, Promega) and purified using ProbeQuant G-50 microcolumns (Amersham Biosciences). The FAT1–4 cDNA probes used for hybridization corresponded to the following sequences: FAT1, nucleotides 13091–14751 (GenBankTM accession number NM_005245.3); FAT2, nucleotides 12541–14450 (GenBank accession number NM_001447.2); FAT3, nucleotides 13141–14870 (GenBank accession number NM_001008781.2); and FAT4, nucleotides 13081–14580 (GenBank accession number NM_024582.4).
Preparation of Cell Lysates and Immunoprecipitation
Unless indicated otherwise, soluble cell lysates were prepared using NDE lysis buffer (1% Nonidet P-40, 0.4% sodium deoxycholate, 66 mm EDTA, 10 mm Tris-HCl, pH 7.4) supplemented with protease and phosphatase inhibitors (Complete protease inhibitor mixture and PhosSTOP, respectively; Roche Applied Science) as described previously (25). Cell lysates were precleared twice with 30 μl of Protein A/G Plus-agarose beads (Santa Cruz Biotechnology) for 1–2 h, and lysates were immunoprecipitated with 1–2 μg of the indicated mAbs precoupled to 20 μl of beads. The beads were then washed alternately a total of four times with either SDS radioimmune precipitation assay buffer (1% Nonidet P-40, 0.1% SDS, 0.1% sodium deoxycholate, 150 mm NaCl in 50 mm Tris-HCl, pH 8) or high salt radioimmune precipitation assay buffer (1% Nonidet P-40, 0.5% sodium deoxycholate, 0.5 m NaCl in 50 mm Tris-HCl, pH 7.4) before elution of immunocomplexes using lithium dodecyl sulfate sample buffer. In some experiments, samples were treated with 400 units of λ-protein phosphatase (New England BioLabs) for 2 h at 30 °C prior to analysis.
Tris Acetate Gel Electrophoresis and Western Blotting
To optimally resolve high Mr proteins, samples prepared in lithium dodecyl sulfate sample buffer were applied to commercial acrylamide gels (NuPAGE® Novex 3–8% Tris acetate mini/midigels, Invitrogen). After electrophoresis, proteins were transferred to nitrocellulose membranes using a semidry blotting system (iBlot® Transfer Stack and iBlot device, Invitrogen). Western blotting was then performed as described previously using an ECL-based detection system (23), and the results were recorded using a cooled charge-coupled device camera system (Fuji-LAS-4000, Fujifilm Life Science Systems).
In Vivo Cell Labeling
Pulse-chase labeling experiments with [35S]methionine/cysteine were conducted as described previously (26). Gel images were captured using storage phosphorimaging and densitometric analysis performed using MultiGauge image analysis software (Fujifilm Life Science Systems).
Cell Surface Biotinylation
Where indicated, cell surface proteins were labeled with biotinamidocaproate N-hydroxysuccinimide ester (Sigma-Aldrich) as described previously (20) before preparation of cell lysates and immunoprecipitation as described above. After electrophoresis and transfer, biotinylated proteins were detected using the ECL-based detection system described above after probing with NeutrAvidin-HRP conjugate (ThermoScientific). To perform subsequent Western blotting analysis, HRP activity was first quenched by treatment of membranes with 1 mm NaN3 solution for 1 h at RT.
siRNA-mediated Knockdown and Quantitative RT-PCR Analysis
siRNAs targeting FAT1 were purchased from GenePharma (Shanghai, China). The sense and antisense strands, respectively, of the siRNAs used were as follows: Fat1-1223–1241, 5′-CCAGUUCUCUUCUGUUAAAUU-3′ and 5′-UUUAACAGAAGAGAACUGGUU-3′; Fat1-2473–2491, 5′-AUAGUUGCUUCAUGAUUGAUU-3′ and 5′-UCAAUCAUGAAGCAACUAUUU-3′; and Fat1-13890–13910, 5′-GACGACGGCCACUUCGAAGAGUU-3′ and 5′-CUCUUCGAAGUGGCCGUCGUCUU-3′. Cells were transfected with a pool of three siRNAs using RNAiMAX (Invitrogen) according to the manufacturer's protocol with a final concentration of 50 nm siRNA. The ability of each siRNA to mediate knockdown of FAT1 mRNA was confirmed using quantitative RT-PCR. Total RNA was extracted as described above, and reverse transcription was performed with random hexamers using BioScriptTM (Bioline) according to the manufacturer's instructions. Quantitative RT-PCR was performed using a SensiMixTM SYBR kit (Bioline) with the specific primers for the FAT1 gene (forward, 5′-GTGTGATTCGGGTTTTAGGG-3′; and reverse, 5′-CTGTACTCGTGGCTGCAGTT-3′). The reaction was carried out in an Applied Biosystems RT-PCR 7500 series system for 40 cycles as follows: 95 °C for 15 s followed by 1 min at 60 °C.
Microsome Isolation
Cell monolayers were swelled in situ using HB buffer (250 mm sucrose, 1 mm EDTA, 20 mm HEPES-NaOH, pH 7.4 containing a protease inhibitor mixture (Complete, Roche Applied Science)) after which the cells were collected using a cell scraper. Pooled cell suspensions were then subjected to nitrogen cavitation in a Parr Model 4639 device charged at 550 p.s.i. for 15 min. Disrupted cells were then sequentially centrifuged at 1,000 and 10,000 × g for 10 min each to remove nuclei and mitochondria, respectively. The supernatant was divided and mock-treated for 30 min with HB buffer or buffer containing 200 mm sodium carbonate, pH 10. Samples were ultracentrifuged at 100,000 × g for 30 min (TLA 110, Beckman-Coulter), and the resulting membrane pellets were washed once in HB buffer and centrifuged again for 30 min. Pellets were suspended in HB buffer before undertaking Western blotting analysis against either FAT1, CD36 (Long6; Ref. 23), or Annexin II (sc-1924, Santa Cruz Biotechnology).
Indirect Immunofluorescence Staining and Confocal Microscopy
Immunostaining and confocal microscopy were performed using the rabbit polyclonal anti-FAT1 cytoplasmic antibodies on formaldehyde-fixed, Triton X-100-permeated cells attached to glass coverslips essentially as described previously (19). Controls were stained in parallel with diluted normal rabbit serum.
RESULTS
FAT1 Is the Major FAT Cadherin Expressed by Human Melanoma Cells
To examine the expression of all four vertebrate FAT cadherins in melanoma cells at the mRNA level, Northern blotting using specific probes against FAT1, FAT2, FAT3, and FAT4 was undertaken against a large panel of melanoma cell lines (Fig. 1). This analysis showed that all 16 lines tested express a single major transcript of FAT1 at around 15 kb in size (Fig. 1). No prominent smaller FAT1 transcripts were identified in any of these lines (supplemental Fig. S1). A repeat blot of 15 of the melanoma cell lines showed the same result for FAT1 (not shown), and reprobing for FAT2, FAT3, and FAT4 (Fig. 1) revealed that FAT1 is the major FAT cadherin expressed by human melanoma cell lines. Northern blotting of cultured normal melanocytes and the immortalized keratinocyte cell line HaCaT indicated that these cells expressed the FAT1 transcript at levels that were comparable with many of the melanoma cell lines (Fig. 1).
FIGURE 1.
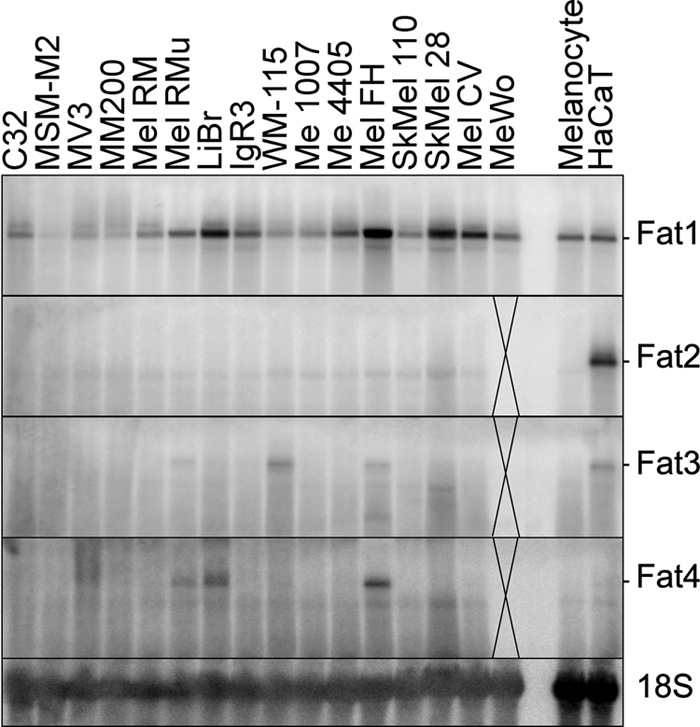
Expression of FAT cadherin family in human melanoma cells, melanocytes, and keratinocytes. A Northern blot analysis of all four FAT family cadherins in a panel of human melanoma cell lines compared with cultured melanocytes and the HaCaT keratinocyte cell line is shown. RNA loading and integrity were confirmed by reprobing each membrane with an 18 S probe. MeWo RNA was not analyzed for FAT2, FAT3, or FAT4 as indicated.
FAT1 Is Proteolytically Processed before Achieving Cell Surface Expression as a Non-covalent Heterodimer in HaCaT Cells
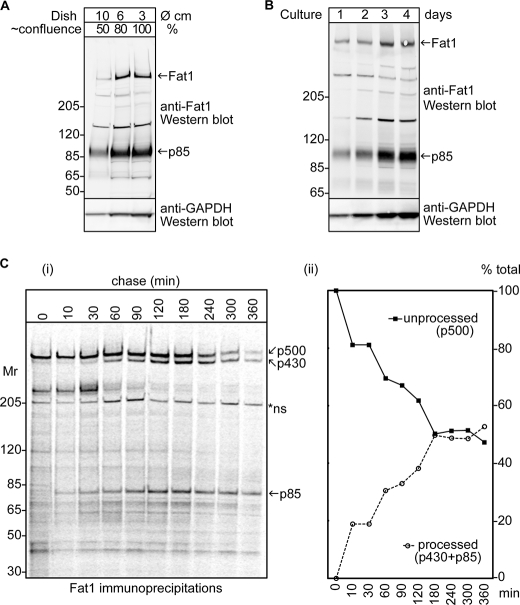
Nothing is known about the processing of FAT1, but both Drosophila FAT and murine FAT4 initially undergo a proteolytic cleavage step in the secretory pathway before cell surface expression (6, 15). This process produces a non-covalent heterodimer comprising a large subunit containing most of the extracellular domain and a smaller subunit that contains the cytoplasmic and transmembrane domains. Apparently similar proteolytic processing of FAT1 was indicated in a series of immunoblotting experiments designed to examine the levels of FAT1 expressed by HaCaT keratinocytes with increasing confluence (Fig. 2A) and time in culture (Fig. 2B). Upon probing the blots with a polyclonal rabbit antibody directed against the cytoplasmic domain of FAT1, a high molecular mass band (∼500 kDa) consistent with a protein encoded by the FAT1 mRNA was observed and found to show increased intensity at higher confluence and with time in culture. A second band at around 85 kDa (p85) showed the same properties, indicating that it may be a cleaved product containing the cytoplasmic domain of FAT1. Because the HaCaT cells progressively form a contiguous epithelial sheet with increasing cell density, the implication of this observation is that FAT1 processing in these cells appears similar regardless of confluence or time of culture.
FIGURE 2.
Proteolytic processing of FAT1 cadherin in keratinocytes. Cell lysates of HaCaT keratinocytes were analyzed for FAT1 expression by Western blotting using the FAT1 C-terminal pAbs after seeding equal numbers of cells into different sized culture dishes and growing for 2 days (A) or seeding equal numbers of cells into the same size culture dish and growing for 1–4 days (B). All cultures were lysed in an equal volume, and an equal proportion of the lysate was applied to the gels. Membranes were then reprobed with anti-GAPDH as a loading control. The high molecular mass band observed at the expected ∼500-kDa size of FAT1 is indicated by an arrow together with a prominent band at ∼85 kDa. C, HaCaT keratinocytes were pulse-labeled with [35S]cysteine/methionine and subjected to chase in unlabeled medium for 0–360 min. At each indicated time point, cells were collected, lysed, and immunoprecipitated using a mixture of anti-FAT1 mAbs (NTD-7 and CTD-7). Panel i, the samples were then resolved on 3–8% Tris acetate gels that were subsequently dried and subjected to storage phosphorimaging. The asterisk indicates a nonspecific (ns) band also observed in control immunoprecipitates throughout the chase (not shown). Panel ii, densitometric analysis demonstrating the relative expression of p500 to the p430 and p85 bands that reflects the proteolytic processing events occurring in FAT1 (see text for further details).
To provide further evidence that FAT1 undergoes proteolytic processing, we carried out pulse-chase experiments in HaCaT cells using pooled mAbs against both the extracellular domain and the cytoplasmic domain of FAT1 (see supplemental Fig. S2 for details of mAbs) to precipitate the labeled proteins before fluorographic and densitometric analysis. The results shown in Fig. 2C clearly reveal such proteolytic processing. After 10 min of chase, faint bands were first detected at around 430 (p430) and 85 kDa (p85), and the progressive appearance of these bands reciprocated the relative loss of the 500-kDa (p500) FAT1 band as a proportion of the total, indicating a precursor-product relationship. An unknown protein of 210 kDa also co-precipitated in the early period of the chase appears to complex with FAT1, likely prior to cleavage, because it appears to disassociate from FAT1 after cleavage begins to occur (see “Results” below). The nature of this associated protein remains unknown at this time, but it did not blot for FAT1.
Next, we sought to establish whether p430 and p85 formed a heterodimer at the cell surface of HaCaT cells. Cells were surface-labeled with biotin before lysis and immunoprecipitation with mAbs directed against an epitope on the extracellular domain (NTD) or the cytoplasmic domain (CTD). Probing the blot with NeutrAvidin to reveal surface proteins identified a single prominent band at around 430 kDa (p430), and this band was precipitated with both the NTD and CTD mAbs (Fig. 3A). Reprobing the blot with a rabbit antibody against the C-terminal region of FAT1 illuminated the p500 FAT1 and also a prominent p85 band; both bands were also precipitated with both the NTD and CTD mAbs (Fig. 3A). Note that if p430 on the cell surface represents full-length FAT1 (p500) after cleavage of the cytoplasmic domain, then this band would not be illuminated with the rabbit antibody against the C terminus (CTD pAb). Similarly, if the p85 band comprised the cleaved cytoplasmic fragment, then it would not be expected to display significant labeling with biotin. Indeed, both predictions are supported by the data (Fig. 3A).
FIGURE 3.
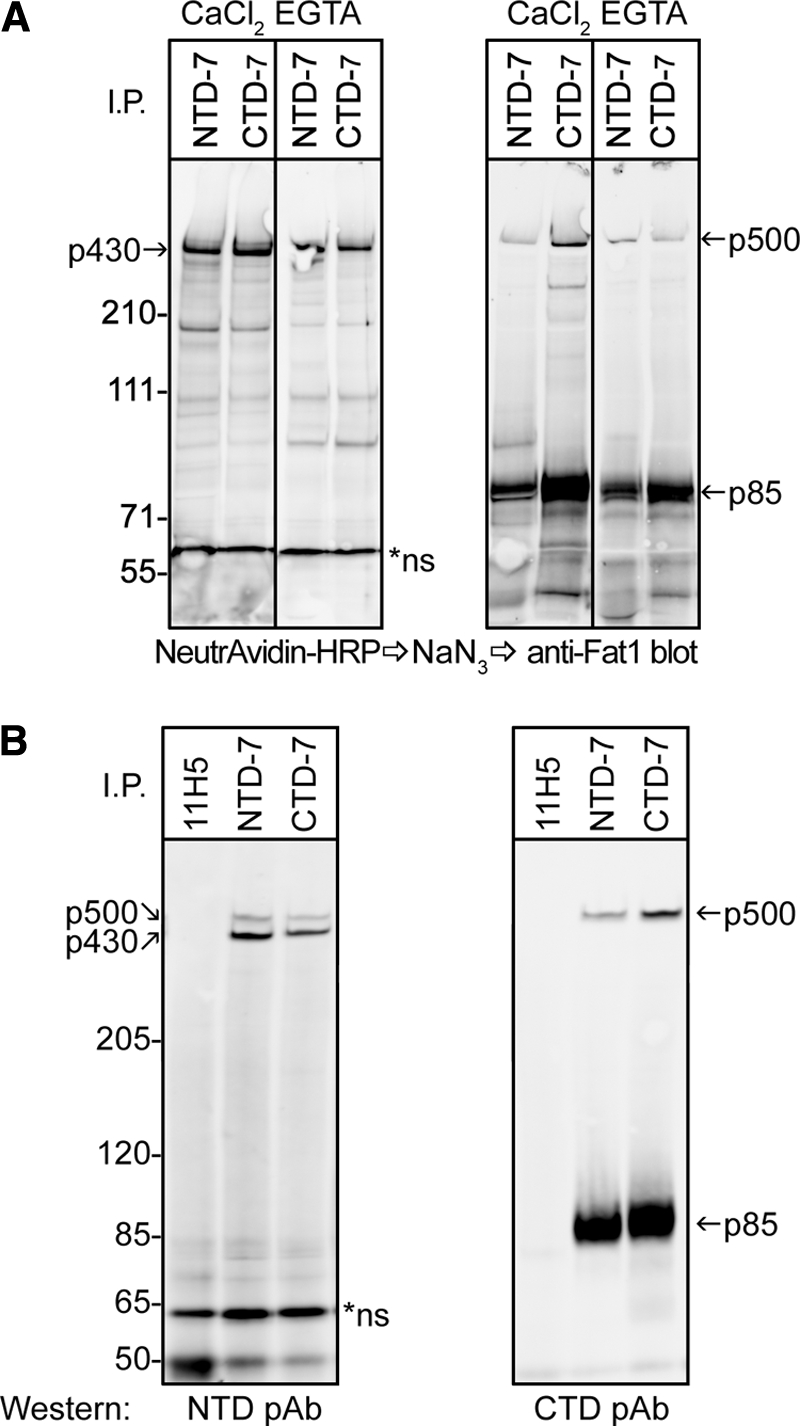
FAT1 cadherin is cleaved and expressed as a heterodimer on cell surface of keratinocytes. A, cell surface proteins of HaCaT keratinocytes were labeled in situ with biotin before being subjected to lysis and immunoprecipitation (I.P.) using mAbs directed against epitopes in the extracellular domain and cytoplasmic tail of FAT1, NTD-7 and CTD-7, respectively. CaCl2 and EGTA indicate the presence (2 mm CaCl2) or absence (5 mm EGTA) of calcium ions in the immunoprecipitation buffers used. Membranes were first probed with NeutrAvidin-HRP to reveal cell surface proteins (left panels) followed by quenching HRP activity with azide and subsequently reprobing membranes with FAT1 C-terminal pAbs by Western blot (right panels). Both mAbs precipitated a band at ∼430 kDa (p430) on the cell surface, whereas reblotting using the C-terminal pAbs showed a ∼500-kDa reactive band (p500) and a strong ∼85-kDa band (p85). B, cell lysates of HaCaT cells immunoprecipitated with NTD-7, CTD-7, and control mAbs (11H5) were subjected to Western blotting with either FAT1 N-terminal pAbs or C-terminal pAbs. The N-terminal pAbs recognize both p430 and p500 bands in both NTD-7 and CTD-7 immunoprecipitates in contrast to the C-terminal pAbs that recognize only p500 and p85.
These concepts were further explored when similar immunoprecipitates from HaCaT cell lysates were subjected to Western blotting using rabbit antibodies against extracellular epitopes (N-terminal pAbs; see supplemental Fig. S2), and the results compared with those using the C-terminal pAbs (Fig. 3B). These experiments showed that both the N-terminal and C-terminal pAbs illuminated p500 representing full-length FAT1. However, only the N-terminal pAbs revealed p430 (Fig. 3B, left panel) in contrast to the C-terminal pAbs that specifically decorated the p85 band (right panel). Collectively, these data establish that, like Drosophila FAT and murine FAT4, human FAT1 in HaCaT cells is cleaved to form a heterodimer before being expressed on the cell surface.
The experiments shown in Fig. 3A were carried out under reducing conditions; thus, the precipitation of both p430 and p85 by the NTD and CTD mAbs indicates a non-covalent association between the subunits. Experiments in which calcium ions were added or chelated before immunoprecipitation did not affect the co-precipitation of the dimeric subunits (Fig. 3A) nor did lysis in radioimmune precipitation assay buffer containing 0.1% SDS (w/v) and warming (supplemental Fig. S3 and data not shown), conditions that have been reported to be sufficient to disrupt the Notch heterodimer (27). However, increasing the concentration of SDS in the cell lysis to 1% showed that the p430 and p85 bands could be individually precipitated by the NTD and CTD mAbs, respectively, indicating the dissociation of the FAT1 heterodimer (supplemental Fig. S3). Although the biophysical mechanism of the association between the chains of the FAT1 heterodimer has yet to be established, this experiment substantiates the occurrence of a non-covalent heterodimer formed between the N-terminal and C-terminal domains of FAT1 after proteolytic cleavage.
Additional FAT1 Cleavage Product, p65, Identified in Melanoma Cells
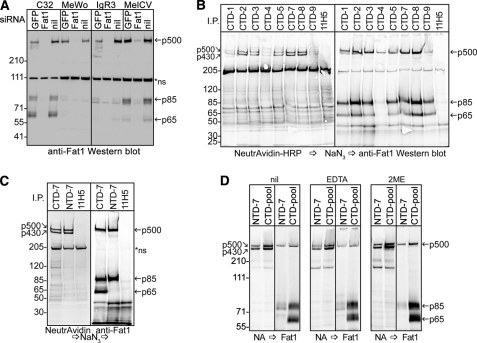
We then analyzed FAT1 protein in melanoma cells by Western blotting cell lysates with the rabbit antibody against the cytoplasmic domain. Of seven cell lines tested, all displayed p500 and p85 but also a prominent band at around 65 kDa (p65) not seen in the keratinocytes (data not shown). To ensure that this additional band was derived from FAT1, siRNA was used successfully to knock down FAT1 expression in four of these cell lines before again blotting with the rabbit anti-FAT1 antibody; this treatment greatly reduced the expression of all three bands (Fig. 4A). We raised a panel of mAbs against different epitopes that encompass the entire cytoplasmic tail of human FAT1 (supplemental Fig. S2). These mAbs were used in immunoprecipitation experiments to substantiate the FAT1 origin of this product and to determine whether p65 contains the entire cytoplasmic region of FAT1. In addition, we examined the cell surface FAT1 precipitated by these mAbs with prior biotin labeling and NeutrAvidin blotting. Fig. 4B reveals that all nine mAbs precipitated p65 as well as p500, p430, and p85, suggesting that either p65 encompasses the entire cytoplasmic domain of FAT1 or that it co-precipitates with p500 or p85. In addition, blotting with NeutrAvidin indicated that in these cells, in addition to the cleaved heterodimeric subunit (p430), full-length FAT1 (p500) also achieves cell surface expression.
FIGURE 4.
FAT1 cadherin occurs as both unprocessed and heterodimeric forms on cell surface of melanoma cells. A, four different human melanoma cell lines expressing FAT1 were treated with siRNA duplexes against either FAT1 or a GFP control. After 72 h, the cells were lysed, and together with similarly prepared untreated control cells (nil), the cell lysates were subjected to Western blot analysis using the FAT1 C-terminal pAbs. In addition to the p500 band, two smaller FAT1-related bands were observed at 85 and 65 kDa. B, MelCV melanoma cells were biotinylated on the cell surface, lysed, and subjected to immunoprecipitation (I.P.) analysis using the panel of anti-FAT1 C-terminal mAbs (CTD-1–CTD-9) together with control mAbs (11H5). Biotinylated proteins were then detected using NeutrAvidin-HRP followed by quenching with azide and reprobing the same membrane by Western blotting using the FAT1 C-terminal pAbs. The immunoprecipitation analysis in B was repeated except now directly comparing the results obtained using the N-terminal anti-FAT1 mAbs (NTD-7) with representative C-terminal mAbs (CTD-7) (C) or a pool of all nine C-terminal mAbs (CTD-1–CTD-9) (D). As indicated, duplicate samples were subjected to treatment with either 5 mm EDTA or 0.25 mm 2-mercaptoethanol (2ME) in the immunoprecipitation buffers. Samples were sequentially analyzed as for B with NeutrAvidin-HRP (NA), quenching with azide (arrow) and Western blotting against FAT1. Nonspecific (ns) bands are denoted by an asterisk. The results show that both the processed p430/p85 heterodimer along with the uncleaved p500 form of FAT1 occur on the cell surface of melanoma cells. Additionally, the p65 FAT1 band was selectively captured with the FAT1 C-terminal but not N-terminal mAbs.
Next, we assessed whether p65, like p85 in keratinocytes, forms a heterodimer with p430/p85 or p500 by immunoprecipitation with mAbs specific for an epitope in the extracellular domain (NTD-7) or in the cytoplasmic domain (CTD-7). Again these blots were sequentially developed for cell surface expression and for the FAT1 cytoplasmic domain. The results (Fig. 4C) revealed that both mAbs precipitated both p500 and p430 from the labeled cell surface, and both also precipitated p85 as anticipated; however, only the CTD mAbs precipitated p65. Hence, these data, together with the results in Fig. 4B, indicate that p65 contains the entire cytoplasmic region of FAT1 but no longer forms a stable association with the extracellular domain. As with the keratinocytes, neither the addition of CaCl2 (not shown) or β-mercaptoethanol nor calcium chelation with EDTA at room temperature apparently influenced association between p430 and p85, and no treatments influenced the relative amount of p65 precipitated by the C-terminal mAbs (Fig. 4D).
In Drosophila, after the initial processing step that occurs as part of its normal maturation, FAT can be subjected to further cleavage to yield a smaller product that contains the cytoplasmic domain but no longer associates with the extracellular domain fragment (15). However, prior to this process, the cytoplasmic tail of the heterodimer is phosphorylated by the Drosophila homologue of casein kinases 1δ and 1ϵ, an event that is stimulated by ligand binding (6, 15). By analogy with the processing of the Notch receptor, Feng and Irvine (15) describe the initial processing step as S1 cleavage. Therefore, it seems reasonable to propose that (again analogous to the processing of the Notch receptor) an S2 cleavage of the p85 subunit of FAT1 could result in the generation of the p65 fragment seen in the human melanoma cells. However, the ligand for FAT1 has not been identified; therefore, it cannot be established whether such postulated S2 cleavage is ligand-induced or spontaneous in these cells. Notably, the broad bands seen for both p85 and p65 could occasionally be seen to run as a doublet in Western blots that were slightly underexposed (see Fig. 4D), suggesting the possibility that a proportion of these cleavage products is phosphorylated. This was confirmed by treatment of the immunoprecipitates with λ-protein phosphatase after which the diffuse p85 and p65 bands collapsed into single sharp bands that shared the mobility of the lower band of the doublet (Fig. 5).
FIGURE 5.
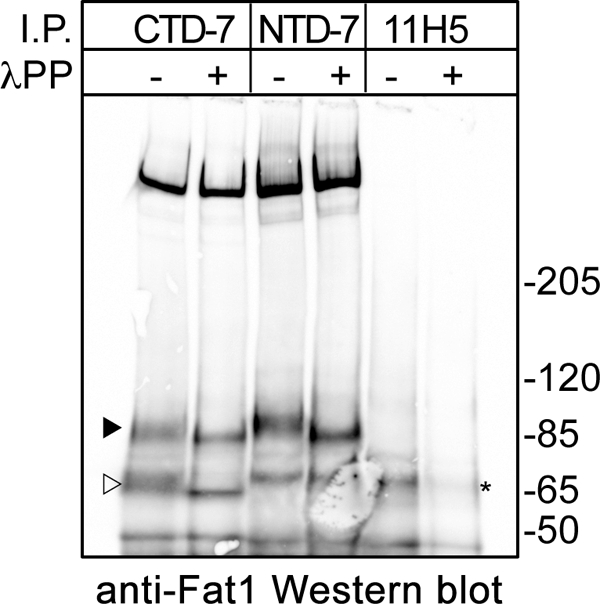
Proteolytic cleavage and phosphorylation of FAT1 cadherin in melanoma cells. MelCV cells were lysed and subjected to immunoprecipitation (I.P.) with either the FAT1 CTD-7 or the NTD-7 mAbs together with a control. Samples were then subjected to digestion with λ-protein phosphatase (λPP) or mock-digested without enzyme prior to Western blotting using the FAT1 C-terminal pAbs. This analysis shows that both the p85 band (black arrowhead) and p65 band (open arrowhead) are phosphorylated as indicated by the increased mobility after phosphatase digestion. A nonspecific band is denoted by an asterisk.
p65 Cleavage Product Is Derived from Full-length FAT1
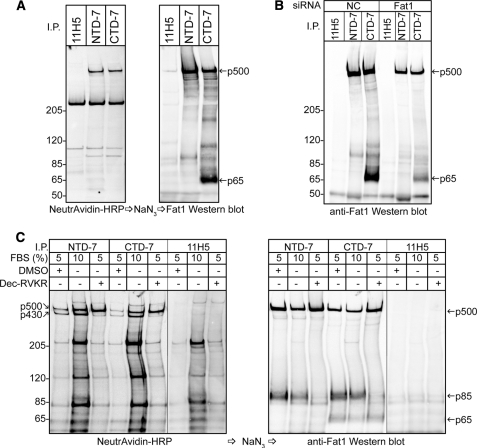
An in silico analysis of the FAT1 protein showed that it contained a number of predicted furin and general proprotein convertase cleavage motifs (supplemental Table S1). To investigate whether the proteolytic processing of FAT1 is furin-mediated as is the case for other cadherins, we utilized the colon carcinoma cell line LoVo, which expresses only a non-functional furin mutation. In these experiments as before, cells were labeled on the surface with biotin before precipitation of lysates with mAbs against an extracellular (NTD) or a cytoplasmic (CTD) epitope of FAT1 (together with irrelevant control mAbs, 11H5) and blotted for surface proteins with NeutrAvidin and for FAT1 with a rabbit antibody against the cytoplasmic tail of FAT1. As illustrated in Fig. 6A, blotting with the rabbit antibody showed the absence of a specific p85 band, demonstrating that p500 FAT1 had not been processed to form the heterodimer found in keratinocytes and thereby implicating furin in the cleavage process. The NeutrAvidin blot from the same experiment showed clearly that in these cells uncleaved FAT1 achieved surface expression as p500. However, quite unexpectedly, in the rabbit anti-FAT1 blot, in addition to the p500 band, there was a prominent band at about 65 kDa that was precipitated by the CTD mAbs but not by the NTD mAbs. The specific nature of this p65 band was confirmed by knocking down FAT1 with siRNA in the LoVo cells (Fig. 6B). In these experiments, FAT1 knockdown was less than complete, but the reduction seen in the p500 band was mimicked by the reduction in the p65 band. This result suggests that if the p65 band identified in the LoVo cells is the same as p65 in melanoma cells then this band originates from uncleaved rather than processed FAT1.
FIGURE 6.
Furin is necessary for production of p430/p85 FAT1 heterodimer, whereas p65 is a cleavage product derived from unprocessed p500 molecule. A, furin-deficient LoVo cells were biotinylated on the cell surface and subjected to immunoprecipitation (I.P.) using the anti-FAT1 CTD-7 and NTD-7 mAbs together with a control (11H5). Detection of cell surface proteins with NeutrAvidin-HRP and subsequent reprobing of the same membrane with the FAT1 C-terminal pAbs decorated a specific high Mr protein band (p500). No p85 band was observed as in previous experiments with HaCaT cells, but a p65 band was precipitated but only using the CTD-7 mAbs. B, Western blot analysis of immunoprecipitates from LoVo cells treated with siRNA duplexes against either FAT1 or a control sequence (NC). Both the p500 and p65 reactive bands revealed using the FAT1 C-terminal pAbs were diminished after FAT1 knockdown, indicating that both are FAT1-related products. C, MelCV melanoma cells were subjected to the same immunoprecipitation analysis used in A except that cells were first pretreated with either the proprotein convertase inhibitor (decanoyl-RVKR-CMK) or DMSO that was used as a carrier substance for the inhibitor. As indicated, some cells were grown in 10% FBS before harvesting the cell lysates. Treatment with the inhibitor resulted in the greatly diminished expression of both p430 on the cell surface (left panel) and the p85 band detected by Western blot using the FAT1 C-terminal pAbs. In contrast, inhibition using decanoyl (Dec)-RVKR-CMK did not reduce the amount of p65 immunoprecipitated using the CTD-7 mAbs.
We addressed this possibility by treating melanoma cells with the peptide decanoyl-RVKR-CMK, which is an efficient inhibitor of furin function (Fig. 6C). In these experiments, decanoyl-RVKR-CMK almost completely abrogated the appearance of p430 at the cell surface, but the cell surface expression of full-length p500 was not affected. In the rabbit anti-FAT1 blots, p500 was relatively unaffected by this treatment, but the appearance of p85 was almost totally abrogated, confirming a role for furin in the cleavage process. Significantly, however, the p65 band precipitated only with the CTD mAbs was unaffected by treatment with this peptide.
In addition to this, in the same experiment, we also tested the effect of growth factor stimulation by increasing the concentration of serum because the expression of FAT1 can be stimulated by serum in vascular smooth muscle cells (16). Fig. 6C additionally shows that melanoma cells similarly responded with increased FAT1 expression, but this did not alter the ratio of p500:p430 (uncleaved:cleaved) FAT1 on the cell surface of melanoma cells or the relative amount of the p65 product. Collectively, these data establish that an alternative, furin-independent pathway of FAT1 processing exists in the melanoma (and LoVo) cells that results in the generation of an intracellular p65 fragment that contains the entire cytoplasmic region of FAT1 but no longer associates with the extracellular domains.
p65 C-terminal Fragment of FAT1 Is Membrane-associated
We next sought to determine the fate of the fragments of FAT1 generated by dual processing in the melanoma cells. Immunofluorescence staining of permeabilized cells with rabbit antibodies against the extracellular domain of FAT1 showed a messy picture with apparent staining of the extracellular matrix observed in addition to cell-specific staining (data not shown). This alerted us to the possibility that the extracellular product may have been cleaved at the cell surface and released or secreted after cleavage within the secretory pathway. Western blotting experiments undertaken with the FAT1 N-terminal pAbs in MelCV melanoma cells showed that both FAT1 N-terminal and C-terminal mAbs immunoprecipitated the expected p500 and p430 bands from cell lysates. In contrast, immunoprecipitations from the cell supernatant identified two weak bands of higher motility that were specifically precipitated by only the N-terminal mAbs (supplemental Fig. S4). Therefore, this result suggests the release of the cleaved extracellular FAT1 fragment, which may possibly be subjected to progressive cleavage at its C-terminal end. Because no similar fragments could be detected in HaCaT cell supernatants (data not shown), these data suggest that alternative FAT1 cleavage may be responsible for the appearance of these FAT1 fragments. However, given that this process is catalyzed by an unknown enzyme(s), it will be necessary to establish the identity of the cleavage enzyme(s) before further work can be pursued.
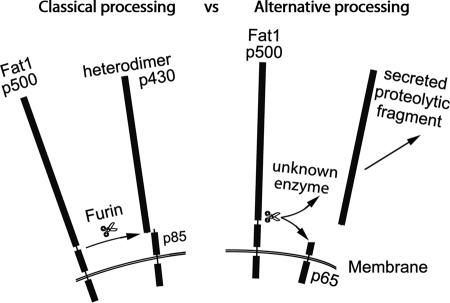
To determine whether cleavage also releases the p65 product from membranes, we prepared microsomes from C32 melanoma cells and extracted these with high pH carbonate buffer, a treatment that releases the contents of microsomes and removes non-integral membrane proteins, including those that peripherally associate with membranes. As anticipated, Western blotting with the rabbit anti-C-terminal antibody showed that both full-length p500 FAT1 and the p85 fragment pelleted with the membranes and so did p65. Upon carbonate extraction, none of these bands was significantly reduced (Fig. 7, left panel). The extraction conditions were verified using blotting against CD36, an integral membrane protein (25), and Annexin II, a protein known to peripherally associate with membranes (28). As shown in Fig. 7 (right panel), CD36 was not removed by carbonate treatment, whereas Annexin II was effectively depleted by carbonate extraction. Therefore, these data indicate that p65 is predominantly integrated into the membrane, a supposition in keeping with its observed size. A summary comparing the dual mechanisms of FAT1 processing is presented in Fig. 8.
FIGURE 7.
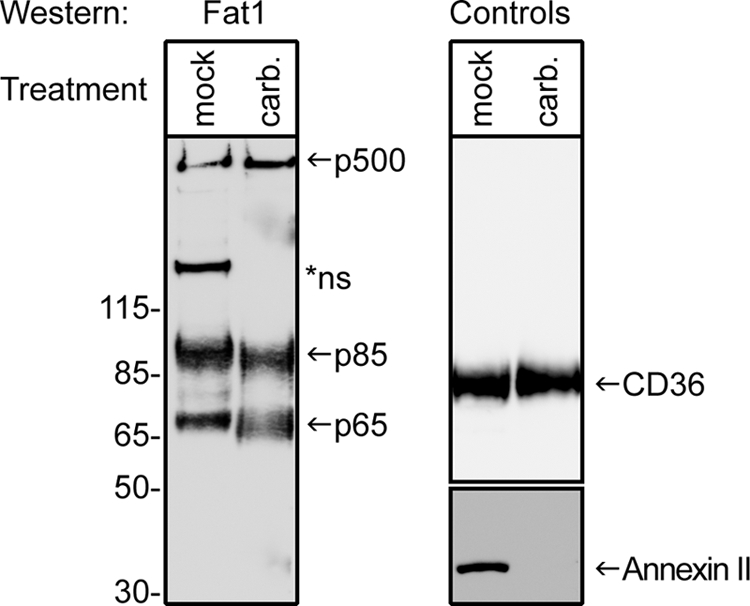
p65 cleavage product of FAT1 associated with alternative processing pathway is membrane-associated. Microsomal membranes prepared from C32 melanoma cells were subjected to either mock extraction or extraction with high pH carbonate buffer (carb.) as described under “Experimental Procedures.” Samples were subjected to Western blotting using either the FAT1 C-terminal pAbs (left panel) or antibodies against the integral membrane protein CD36 (25) or the membrane-associated protein Annexin II (28) (right panel). Full-length FAT1 (p500) and the heterodimer-associated p85 chain were detected in microsomes and resisted carbonate extraction. The p65 band was also detected in microsomes and was resistant to carbonate extraction. This suggests that p65 is also an integral membrane protein, but consistent with our depiction in Fig. 8 below, the cleavage that generates p65 may be very close to the juxtamembrane transmembrane region. *ns, nonspecific band.
FIGURE 8.
Schematic illustrating dual processing of mammalian FAT1 cadherin deduced from preceding experimental data. Classical processing of FAT1 occurs as for Drosophila FAT, whereas “alternative” processing has been shown to occur in melanoma cells (see text for further details).
Cellular Distribution of FAT1 Cadherin May Reconcile with Products of Dual Proteolytic Processing
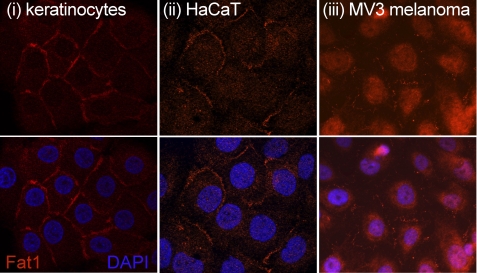
Neonatal human keratinocytes, HaCaT keratinocytes, and MV3 melanoma cells were stained in situ with a rabbit polyclonal antibody against the cytoplasmic tail of FAT1 to examine its localization (Fig. 9). This analysis showed that both the ex vivo keratinocytes and those from the HaCaT cell line displayed almost exclusively cell-cell junctional staining. The melanoma cells also exhibited a degree of cell junctional staining, but most staining was distributed throughout the cytoplasm with occasional nuclear localization. Similar patterns were found in a number of different melanoma cell lines (data not shown). Given the similarities in the distribution of FAT1 in melanoma cells and the major differences in comparison with keratinocytes, these data suggest that the intracellular accumulation of FAT1 by melanoma cells may represent the novel FAT1 proteolytic product (p65) identified in our preceding biochemical experiments.
FIGURE 9.
Distribution of FAT1 cadherin in vitro. Immunofluorescence microscopy images show the distribution of FAT1 in cultured neonatal keratinocytes (panel i), HaCaT keratinocytes (panel ii), and the MV3 melanoma cell line (panel iii). The analysis shows optical sections of cells stained with the FAT1 C-terminal pAbs in combination with an Alexa Fluor 594 secondary conjugate. Cell nuclei were counterstained using DAPI.
DISCUSSION
There have been relatively few studies conducted on FAT cadherins in mammals despite their undoubted importance in development and their relevance to cancer progression (29). In part, this likely reflects the difficulties encountered in working with such large molecules. Magg et al. (30) circumvented this problem by examining FAT1 processing in transfection studies with a chimeric fusion protein in which the extracellular domain of E-cadherin was fused to the transmembrane domain and cytoplasmic tail of FAT1. These authors demonstrated a two-step cleavage process resulting in the release of the E-cadherin extracellular domain and then, following cleavage by γ-secretase, the release of the intracellular domain, which traveled to the nucleus. Based upon the more recent work on endogenous Drosophila FAT and murine FAT4 (6, 15), it can be suggested that Magg et al. (30) were observing S2/3 cleavage, an event that does not normally occur spontaneously but is driven by ligand binding (6, 15). Extrapolating from studies of spontaneously cleaved Notch mutations (31, 32), it can be suggested that the S2/3 cleavage seen with the FAT1 chimera was the result of the aberrant exposure of a proteolytic cleavage site that is normally cryptic until ligand engagement induces a conformational change. In the present study, we found no evidence of spontaneous S2/3 cleavage of endogenous FAT1 in the two cell types studied. Whether or not such an event can be similarly induced awaits the discovery of the ligand for FAT1.
Our work has shown that the initial intrinsic processing of FAT1 involving S1 cleavage appears to be the same as that shown previously for Drosophila FAT and murine FAT4 (6, 15), and we have extrapolated upon these reports by demonstrating that the enzyme involved is furin. This result was not unexpected given the structural homology seen in the different FAT molecules. Quite unexpected was our discovery of an alternative spontaneous pathway of cleavage in the melanoma cells that resulted in the generation of protein products that were entirely distinct from those of the “classical” pathway. This finding raises a number of questions requiring discussion. For example, where does cleavage occur; what is the enzyme involved; is such alternative processing specific to tumor cells, and if so how does it benefit tumor metastasis; and can this finding be exploited toward a novel therapy?
Whether the products of alternative processing (released extracellular domain, intact cell surface FAT1, and p65) have any specific functions that differ from “classically” processed FAT1 is not known. However, it is interesting to note that Bush et al. (33) have recorded that Notch1, which like the FATs generally undergoes intrinsic cleavage by a furin-like convertase, can also be expressed on the cell surface as an intact molecule. Furthermore, the uncleaved Notch1 at the surface was able to participate in signal transduction that differed from cleaved Notch1, and the authors proposed a novel paradigm in signal transduction in which two isoforms of the same cell surface receptor could mediate two distinct signaling pathways in response to ligand. It is conceivable, therefore, that the full-length surface FAT1 identified on the surface of melanoma cells can engage in an alternative signal pathway.
Notably, the experimental protocols that enabled Bush et al. (33) to readily identify uncleaved Notch included the use of a furin inhibitor and also the introduction by mutation of furin target sequences within Notch1 itself. Related to these findings is our result that cells from the LoVo colon carcinoma cell line, which contains an inactive furin mutation, also expressed full-length, uncleaved FAT1 at the cell surface. However, there are no data to suggest that melanoma cells contain defective furin, since our results show classical FAT1 processing in the same cells. This might suggest that the melanoma cells may be expressing an isoform of FAT1 that resists furin cleavage by splicing or mutation. In regard to the former possibility, there are several predicted furin and general proprotein convertase cleavage sites (see supplemental Table S1) that could relate to the cleavage that produces p85. However, there were no obvious multiple transcripts in our Northern analysis (Fig. 1) to indicate that regions of FAT1 may have been spliced out, but the absence of a small exon in the large FAT1 ∼15-kb mRNA would likely evade detection. Three distinct splice isoforms of FAT1 distributing to different locations in migrating cells have been reported (34), but whether any of these resists furin cleavage is not known.
Part of our evidence establishing that the p65 product was derived from uncleaved FAT1 and not from the further proteolytic processing of the cleaved FAT1 heterodimer was obtained by the use of the furin-defective LoVo cells. These results also illustrate that alternative FAT1 processing is not restricted to melanoma cells but is also seen in this colon cancer cell line. We have also examined FAT1 processing in two breast cancer cell lines because most in vivo breast cancers also exhibit strong cytoplasmic staining for FAT1 (14), and immunoprecipitation and blotting experiments with these cells have shown them to be indistinguishable from the melanoma cells in prominently displaying both forms of processing.4 Thus, dual FAT1 processing appears to be a feature of some cancer cells and furthermore suggests that this process also occurs in vivo. No immunohistochemical analyses of FAT1 expression in melanoma tissues have currently been reported, so it will therefore be important to determine both the expression and distribution of FAT1 for in situ melanomas as well as to define the proteolytic processing patterns of FAT1 in this setting.
Whether normal cells also can process FAT1 by the alternative pathway has been difficult to evaluate because of the very low levels of FAT1 expressed by most cell types; such studies are also hampered by the very large size of FAT1, making transfection studies a technical challenge, and the fact that our antibody reagents are human-specific. Our work with the keratinocyte lines in this report shows that alternative processing of FAT1 is not a prominent feature in these cells. However, careful examination of overexposed gels sometimes revealed the presence of low amounts of both full-length FAT1 at the cell surface and p65. This is an inconsistent finding that we cannot always replicate under different conditions of cell culture and is quite reminiscent of a similar inconsistently observed p70 band that Sopko et al. (6) recorded in their study of FAT processing in Drosophila. These data together suggest that there are perhaps isoforms of both FAT1 and Drosophila FAT that can undergo alternative processing in normal cells, but these are generally expressed only at very low levels relative to classically cleaved FAT1.
Finally, the question arises as to how alternative processing might explain the paradox of the high expression of FAT1, a putative tumor-suppressor gene, by some tumor cells, particularly melanoma. FAT1 directly binds the ENA/VASP proteins that activate the actin polymerization complex (17, 18). Loss of FAT1 by knockdown (9, 17, 18) causes slowed cell migration in vitro, and added endogenous FAT1 promotes cell migration (34) in a number of different cell types. Therefore, this function of FAT1 could promote tumor metastasis. The ENA/VASP interaction with FAT1 occurs at the plasma membrane at the leading edge of lamellipodia, filopodia, and microspike tips (17). Hence, we suggest that intracellularly localized p65 generated by alternative processing, although having the capacity to bind ENA/VASP, would not interfere with this interaction because it is at the wrong site. Conversely, the role of FAT1 in the Hippo pathway and likely in growth control and tumor suppression involves direct binding to the PDZ-containing protein Scribble at an unknown location (7). We hypothesize that intracellularly located p65 is able to interfere with this process by sequestering Scribble and thereby acting as a dominant negative. We are in the process of testing this hypothesis in zebrafish and have already shown that an approximate p65 construct indeed acts as a dominant negative to FAT1 in this model of development, mimicking the effects of FAT1 knockdown.5 Confirmation of these hypotheses would suggest that the unknown enzyme that catalyzes FAT1 cleavage in the alternative pathway will provide an attractive therapeutic target for novel drugs in the treatment of melanoma.
Supplementary Material
This work was supported in part by grants from the National Health and Medical Research Council of Australia and the Hunter Medical Research Institute (to R. F. T., X. D. Z., P. H., A. W. B., and G. F. B.).

The on-line version of this article (available at http://www.jbc.org) contains supplemental Table 1 and Figs. S1–S4.
E. Sadeqzadeh, C. E. de Bock, S. Alley, and R. F. Thorne, unpublished data.
C. E. de Bock, M. Down, S. I. Smith, X. D. Zhang, T. Yeadon, A. W. Boyd, G. F. Burns, and R. F. Thorne, manuscript in preparation.
- pAb
- polyclonal antibody
- NTD
- N-terminal domain
- CTD
- C-terminal domain
- VASP
- vasodilator-stimulated phosphoprotein.
REFERENCES
- 1. Mahoney P. A., Weber U., Onofrechuk P., Biessmann H., Bryant P. J., Goodman C. S. (1991) Cell 67, 853–868 [DOI] [PubMed] [Google Scholar]
- 2. Dunne J., Hanby A. M., Poulsom R., Jones T. A., Sheer D., Chin W. G., Da S. M., Zhao Q., Beverley P. C., Owen M. J. (1995) Genomics 30, 207–223 [DOI] [PubMed] [Google Scholar]
- 3. Cox B., Hadjantonakis A. K., Collins J. E., Magee A. I. (2000) Dev. Dyn. 217, 233–240 [DOI] [PubMed] [Google Scholar]
- 4. Down M., Power M., Smith S. I., Ralston K., Spanevello M., Burns G. F., Boyd A. W. (2005) Gene Expr. Patterns 5, 483–490 [DOI] [PubMed] [Google Scholar]
- 5. Ponassi M., Jacques T. S., Ciani L., ffrench Constant C. (1999) Mech. Dev. 80, 207–212 [DOI] [PubMed] [Google Scholar]
- 6. Sopko R., Silva E., Clayton L., Gardano L., Barrios-Rodiles M., Wrana J., Varelas X., Arbouzova N. I., Shaw S., Saburi S., Matakatsu H., Blair S., McNeill H. (2009) Curr. Biol. 19, 1112–1117 [DOI] [PMC free article] [PubMed] [Google Scholar]
- 7. Skouloudaki K., Puetz M., Simons M., Courbard J. R., Boehlke C., Hartleben B., Engel C., Moeller M. J., Englert C., Bollig F., Schäfer T., Ramachandran H., Mlodzik M., Huber T. B., Kuehn E. W., Kim E., Kramer-Zucker A., Walz G. (2009) Proc. Natl. Acad. Sci. U.S.A. 106, 8579–8584 [DOI] [PMC free article] [PubMed] [Google Scholar]
- 8. Fanto M., Clayton L., Meredith J., Hardiman K., Charroux B., Kerridge S., McNeill H. (2003) Development 130, 763–774 [DOI] [PubMed] [Google Scholar]
- 9. Hou R., Sibinga N. E. (2009) J. Biol. Chem. 284, 6955–6965 [DOI] [PMC free article] [PubMed] [Google Scholar]
- 10. Bennett F. C., Harvey K. F. (2006) Curr. Biol. 16, 2101–2110 [DOI] [PubMed] [Google Scholar]
- 11. Silva E., Tsatskis Y., Gardano L., Tapon N., McNeill H. (2006) Curr. Biol. 16, 2081–2089 [DOI] [PubMed] [Google Scholar]
- 12. Nakaya K., Yamagata H. D., Arita N., Nakashiro K. I., Nose M., Miki T., Hamakawa H. (2007) Oncogene 26, 5300–5308 [DOI] [PubMed] [Google Scholar]
- 13. Settakorn J., Kaewpila N., Burns G. F., Leong A. S. (2005) J. Clin. Pathol. 58, 1249–1254 [DOI] [PMC free article] [PubMed] [Google Scholar]
- 14. Kwaepila N., Burns G., Leong A. S. (2006) Pathology 38, 125–131 [DOI] [PubMed] [Google Scholar]
- 15. Feng Y., Irvine K. D. (2009) Proc. Natl. Acad. Sci. U.S.A. 106, 11989–11994 [DOI] [PMC free article] [PubMed] [Google Scholar]
- 16. Hou R., Liu L., Anees S., Hiroyasu S., Sibinga N. E. (2006) J. Cell Biol. 173, 417–429 [DOI] [PMC free article] [PubMed] [Google Scholar]
- 17. Moeller M. J., Soofi A., Braun G. S., Li X., Watzl C., Kriz W., Holzman L. B. (2004) EMBO J. 23, 3769–3779 [DOI] [PMC free article] [PubMed] [Google Scholar]
- 18. Tanoue T., Takeichi M. (2004) J. Cell Biol. 165, 517–528 [DOI] [PMC free article] [PubMed] [Google Scholar]
- 19. Jiang C. C., Chen L. H., Gillespie S., Kiejda K. A., Mhaidat N., Wang Y. F., Thorne R., Zhang X. D., Hersey P. (2007) Cancer Res. 67, 5880–5888 [DOI] [PubMed] [Google Scholar]
- 20. Thorne R. F., Marshall J. F., Shafren D. R., Gibson P. G., Hart I. R., Burns G. F. (2000) J. Biol. Chem. 275, 35264–35275 [DOI] [PubMed] [Google Scholar]
- 21. Wang Y. F., Jiang C. C., Kiejda K. A., Gillespie S., Zhang X. D., Hersey P. (2007) Clin. Cancer Res. 13, 4934–4942 [DOI] [PubMed] [Google Scholar]
- 22. Jean F., Stella K., Thomas L., Liu G., Xiang Y., Reason A. J., Thomas G. (1998) Proc. Natl. Acad. Sci. U.S.A. 95, 7293–7298 [DOI] [PMC free article] [PubMed] [Google Scholar]
- 23. Thorne R. F., Zhang X., Song C., Jin B., Burns G. F. (2006) DNA Cell Biol. 25, 302–311 [DOI] [PubMed] [Google Scholar]
- 24. de Bock C. E., Lin Z., Itoh T., Morris D., Murrell G., Wang Y. (2005) FEBS J. 272, 3572–3582 [DOI] [PubMed] [Google Scholar]
- 25. Thorne R. F., Meldrum C. J., Harris S. J., Dorahy D. J., Shafren D. R., Berndt M. C., Burns G. F., Gibson P. G. (1997) Biochem. Biophys. Res. Commun. 240, 812–818 [DOI] [PubMed] [Google Scholar]
- 26. Thorne R. F., Ralston K. J., de Bock C. E., Mhaidat N. M., Zhang X. D., Boyd A. W., Burns G. F. (2010) Biochim. Biophys. Acta 1803, 1298–1307 [DOI] [PubMed] [Google Scholar]
- 27. Rand M. D., Grimm L. M., Artavanis-Tsakonas S., Patriub V., Blacklow S. C., Sklar J., Aster J. C. (2000) Mol. Cell. Biol. 20, 1825–1835 [DOI] [PMC free article] [PubMed] [Google Scholar]
- 28. Liu L., Tao J. Q., Zimmerman U. J. (1997) Cell. Signal. 9, 299–304 [DOI] [PubMed] [Google Scholar]
- 29. Reddy B. V., Irvine K. D. (2008) Development 135, 2827–2838 [DOI] [PubMed] [Google Scholar]
- 30. Magg T., Schreiner D., Solis G. P., Bade E. G., Hofer H. W. (2005) Exp. Cell Res. 307, 100–108 [DOI] [PubMed] [Google Scholar]
- 31. Grabher C., von Boehmer H., Look A. T. (2006) Nat. Rev. Cancer 6, 347–359 [DOI] [PubMed] [Google Scholar]
- 32. Roy M., Pear W. S., Aster J. C. (2007) Curr. Opin. Genet. Dev. 17, 52–59 [DOI] [PubMed] [Google Scholar]
- 33. Bush G., diSibio G., Miyamoto A., Denault J. B., Leduc R., Weinmaster G. (2001) Dev. Biol. 229, 494–502 [DOI] [PubMed] [Google Scholar]
- 34. Braun G. S., Kretzler M., Heider T., Floege J., Holzman L. B., Kriz W., Moeller M. J. (2007) J. Biol. Chem. 282, 22823–22833 [DOI] [PubMed] [Google Scholar]
Associated Data
This section collects any data citations, data availability statements, or supplementary materials included in this article.


