Abstract
The transcription factor p53 plays a critical role in maintaining homeostasis as it relates to cellular growth, proliferation, and metabolism. In an effort to identify novel p53 target genes, a microarray approach was utilized to identify DHRS3 (also known as retSDR1) as a robust candidate gene. DHRS3 is a highly conserved member of the short chain alcohol dehydrogenase/reductase superfamily with a reported role in lipid and retinoid metabolism. Here, we demonstrate that DHRS3 is an endoplasmic reticulum (ER) protein that is shuttled to the ER via an N-terminal endoplasmic reticulum targeting signal. One important function of the ER is synthesis of neutral lipids that are packaged into lipid droplets whose biogenesis occurs from ER-derived membranes. DHRS3 is enriched at focal points of lipid droplet budding where it also localizes to the phospholipid monolayer of ER-derived lipid droplets. p53 promotes lipid droplet accumulation in a manner consistent with DHRS3 enrichment in the ER. As a p53 target gene, the observations of Dhrs3 location and potential function provide novel insight into an unexpected role for p53 in lipid droplet dynamics with implications in cancer cell metabolism and obesity.
Keywords: Endoplasmic Reticulum (ER), Lipid Droplet, Metabolism, p53, Tumor Suppressor Gene
Introduction
The MDM2-p53 stress response pathway is an important regulator of cellular homeostasis. A variety of mitogenic and genotoxic stressors converge on this pathway to elicit a protective p53-dependent stress response resulting in cell cycle arrest, apoptosis, DNA repair, or replicative senescence (1). Research over the past decade has begun to emphasize the role of p53 in regulating cell metabolism under “nonstressed” conditions. Specifically, p53 has been implicated in regulating a number of target genes involved in energy metabolism, including phosphoglycerate mutase (2), a glycolytic enzyme that catalyzes the reversible conversion of 3-phosphoglycerate to 2-phosphoglycerate, Synthesis of cytochrome c oxidase 2 (3), which regulates the cytochrome c oxidase complex of the electron transport chain, TIGAR (TP53-induced glycolysis and apoptosis regulator), a gene that inhibits glycolysis by lowering fructose-2.6-bisphosphate levels(4), and guanidinoacetate methyltransferase, an enzyme critical for creatine biosynthesis (5). Here, we expand the metabolic spectrum for p53 by reporting a novel target gene, DHRS3, as a lipid droplet protein with potential ramifications for lipid and retinoid metabolism.
DHRS3 is a highly conserved member of the short chain alcohol dehydrogenase/reductase superfamily and has been implicated in retinol (vitamin A) metabolism. Retinol comprises one member of the retinoid family of chemical compounds that influence several aspects of cellular biology, including proliferation and differentiation, primarily through regulation of gene expression (6). Retinoic acid (RA),4 one of the major biologically active molecules of the retinoid family, is primarily derived from oxidation of all-trans-retinaldehyde (retinal), an unstable intermediate that fluxes between retinol and RA. Because retinol cannot be synthesized in mammalian systems, it must be absorbed and esterified as retinyl esters to facilitate storage in cytoplasmic lipid droplets (6). The primary storage depots in humans are hepatocytes and adipocytes, where retinyl esters are estimated to account for ∼70 and 20% of retinyl ester accumulation, respectively (7, 8). DHRS3 was first identified as having similar enzymatic activity to all-trans-retinol dehydrogenases and subsequently shown to facilitate the reduction of retinal to retinol in the visual cycle of cone photoreceptors (9). Furthermore, ectopic expression of DHRS3 in neuroblastoma cells was reported to increase retinyl ester concentrations, supporting the role of DHRS3 as a retinal reductase in generating storage forms of retinol (10). Retinoic acid signaling also regulates body patterning and morphogenesis, where in Xenopus, DHRS3 was demonstrated to be expressed during various stages of embryonic development and neurulation (11).
Lipid droplets have been appreciated previously as inert storage vesicles for triacylglycerol, as well as cholesterol, sterol, and retinyl esters (12). However, recent evidence has begun to highlight the role of the lipid droplet as a functional and dynamic organelle. Despite controversy regarding the precise mechanistic details surrounding lipid droplet biogenesis, a common thread among all models maintains that triacylglycerol synthesis in the lumen of the endoplasmic reticulum forces budding of the outer, cytosolic ER leaflet, which subsequently forms into an independent droplet with a singular ER-derived phospholipid monolayer (12). Although lipid droplets have been largely studied in the context of steroidigenic and lipid storage tissues, they are found in essentially all cell types.
Here, we identify Dhrs3 as a novel p53 target gene that is localized to the endoplasmic reticulum and lipid droplets. DHRS3 is selectively transported to the ER where it appears to concentrate at regions of lipid droplet accumulation. Given that lipid droplets are synthesized from the outer ER membrane, DHRS3 also localizes to lipid droplets both in an endogenous and induced manner. DHRS3 expression is enhanced in retinol storing tissues where it may be involved in promoting retinyl ester storage in nascent lipid droplets. Finally, a previously unidentified and novel role for p53 in promoting lipid droplet accumulation is demonstrated to correlate to Dhrs3 transactivation.
EXPERIMENTAL PROCEDURES
Cell Culture and Reagents
U2OS, ZR-75–1, MDA-MB-175VII, MCF-7, HepG2, and mouse embryo fibroblasts (MEF) cell lines were maintained in Dulbecco's modified Eagle's medium supplemented with 10% fetal bovine serum, l-glutamine, 100 μg/ml penicillin, and 100 μg/ml streptomycin at 5% CO2 in a humidified chamber. 3T3-L1 preadipocytes were maintained in Dulbecco's modified Eagle's medium supplemented with 10% Colorado calf serum, 100 μg/ml penicillin, and 100 μg/ml streptomycin at 5% CO2 in a humidified chamber. Cell transfections were carried out with Fugene HD (Roche Applied Science) reagents. 4-Hydroxytamoxifen, 3-isobutyl-1-methylxanthine, dexamethasone, and oleic acid were purchased from Sigma. Bovine insulin was purchased from Invitrogen. Mammalian protein extraction reagent purchased from Thermo Scientific. Primary MEF were isolated on embryonic day 13.5 and grown in a 37 °C incubator with 5% CO2 in DMEM supplied with 10% FBS and penicillin-streptomycin.
Plasmids and Adenovirus
To generate a human Dhrs3-GFP fusion expression construct, the full-length DHRS3 cDNA (Open Biosystems) was amplified by PCR and cloned into pEGFP-NI (Clontech). The ADEASY XL system (Stratagene) was used for creating adenovirus. DNA sequences were subcloned into pShuttle-CMV, recombined with pADEASY-1 vector, and transfected into 293 QBT cells to generate an adenovirus.
Microarray Analysis
Total RNA was isolated from MEFs treated with 4-hydroxytamoxifen (4-OHT) for 12 and 24 h using an RNeasy kit (Qiagen). 1 μg of total RNA was amplified and labeled using the low RNA input linear amplification kit (Agilent Technologies), and hybridization was performed on Agilent 4 × 44 K mouse whole genome DNA microarrays at UNC Genomics and Bioinformatics core facility. Arrays were washed and scanned using an Agilent scanner (Agilent Technologies). Data are stored in the University of North Carolina Microarray Database. Genes that were significantly up- or down-regulated were identified using significance analysis of microarrays.
Adipocyte Differentiation Assay
3T3-L1 preadipocytes (passages 9–12) were grown to 2 days post-confluence. Adipocyte differentiation media containing 10% FBS, 4 μg/ml bovine insulin, 1 μm dexamethasone, and 0.5 mm isobutylmethylxanthine was added to the cells for 2 days, switched to media containing only 10% FBS and insulin for two more days, and then maintained in media with 10% FBS for 4–5 days.
Transmission Electron Microscopy
HepG2/U2OS cells were fixed with 4% buffered paraformaldehyde in 0.15 m sodium phosphate buffer (PB), pH 7.4, for 45 min. Following permeabilization with 0.01% digitonin in PB for 30 min at RT, the cells were washed in PB and blocked using Aurion blocking solution for 30 min. Cells were incubated overnight at 4 °C in primary antibody (rabbit anti-DHRS3, diluted to 3 μg/ml in PB/0.2% acetylated BSA). After PB/BSA washes, the cells were incubated overnight at 4 °C in colloidal gold antibody diluted to 1:50 in PB/BSA. Following silver enhancement to enlarge gold particles for 90 min, the cells were post-fixed in 0.5% PB-buffered osmium tetroxide for 15 min, dehydrated in ethanol, and embedded in PolyBed-812 epoxy resin (Polysciences, Inc., Warrington, PA). 80-nm Ultrathin sections were cut with a diamond knife, mounted on grids and stained with 4% aqueous uranyl acetate and Reynolds' lead citrate. Samples were observed using a LEO EM910 transmission electron microscope operating at 80 kV (Carl Zeiss SMT, Inc., Peabody, MA) and digital images were acquired using a Gatan Orius SC1000 CCD digital camera with digital micrograph software (version 3.11.0; Gatan, Inc., Pleasanton, CA). Immunostaining reagents (all from Electron Microscopy Sciences, Fort Washington, PA) used in this study were as follows: Aurion blocking solution for goat gold conjugates (catalog no. 25596), Aurion acetylated BSA-c (catalog no. 25558), Aurion goat anti-rabbit IgG (H+L) Ultrasmall EM grade 0.8 nm colloidal gold (catalog no. 25101), and Aurion R-Gent SE-EM silver enhancement kit (catalog no. 25521).
Immunofluorescence and Confocal Microscopy
Monolayer cells were fixed with formaldehyde, permeabilized by 0.2% Triton X-100 (for endoplasmic reticulum staining) or 0.01% digitonin (for lipid droplets) and stained with primary anti-DHRS3 (PTG 15393-1-AP) antibody. Goat anti-rabbit Cy2 secondary antibody was purchased commercially (Jackson ImmunoResearch Laboratories). LipidTOX Red (Invitrogen) was used for neutral lipid staining, and DAPI was used for nuclear demarcation. Immunostained cells were analyzed using an Olympus IX-81 microscope fitted with a SPOT camera and software.
For confocal microscopy, cells were grown on in 35-mm glass-bottomed dishes (MatTek) and processed in an identical manner for immunofluorescence staining. Samples were analyzed on a Zeiss 710 LSM confocal laser-scanning microscope with a 40 or 63× oil immersion objective. Raw image data were deconvolved using AutoDeblur (version X1.4.1) and imaged in Imarus X64 (version 7.1.1).
Antibodies
The following antibodies were purchased commercially: mouse anti-Mdm2 2A10 (University of North Carolina Tissue Culture and Molecular Biology Support Facility), mouse anti-actin (Neomarkers), mouse anti-p53 DO.1 (Neomarkers), rabbit anti-DHRS3 (ProteinTech Group 15393-1-AP for immunostaining, Sigma HPA010844 for Western blot), rabbit anti-CALR (ProteinTech Group 10292-1-AP), and goat anti-p21 (C-19) (Santa Cruz Biotechnology).
LipidTOX Red and Oil Red O Staining
Cells were fixed in formalin, washed with PBS, and incubated with a 60% isopropanol/dH2O solution for 5 min. An Oil Red O stock solution (0.5 g/100 ml isopropyl alcohol), diluted to 60% in water and filtered through 0.45 μm syringe filter, was added to the cells for 10 min, then washed with water until the rinse was clear. For LipidTOX staining, cells were fixed, washed in PBS, and incubated with a 1:1000 dilution of LipidTOX in PBS for a minimum of 30 min.
Biochemical Fractionations
An optimized differential detergent fractionation procedure was utilized as described previously (13).
RESULTS
Dhrs3 Is a p53-inducible Gene
A previous study by our laboratory (14) aimed at dissecting the function of MDM2 required the generation of mice bearing Mdm2 WT, null, or RING finger C462A point mutation alleles. In addition, to preserve viability of the mice for further study, they were introduced with the switchable p53ERTAM (p53ER) allele (15) to facilitate modulation of p53 function. p53ER expresses a WT p53 protein fused at the C terminus to the hormone binding domain of the estrogen receptor and is transcriptionally regulated in the same manner as the WT allele. In the absence of 4-OHT ligand binding, p53ER does not bind to DNA and therefore exhibits little transactivation function. However, in the presence of ligand binding, the p53ER fusion protein functions relatively normally, transcribing downstream target genes.
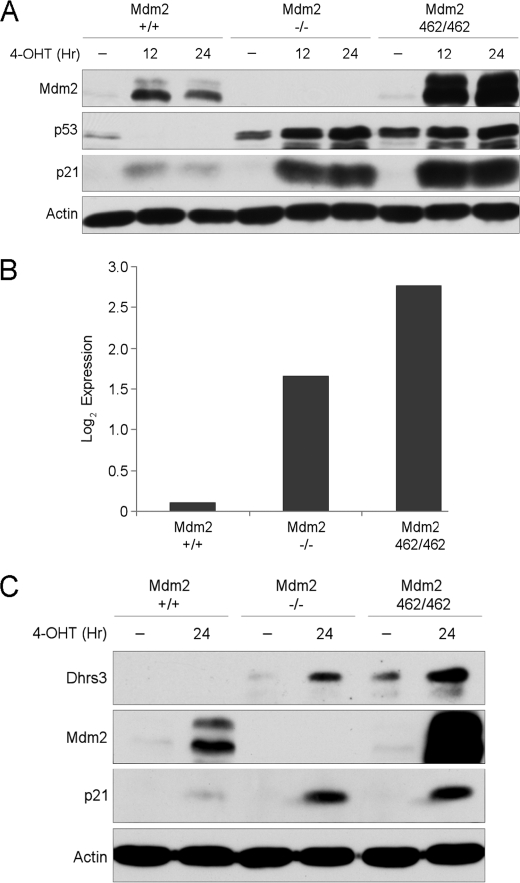
During our studies with MEF harboring the p53ER fusion protein with the three indicated Mdm2 alleles, we observed differential p53 transactivation potential. As expected, following 4-OHT treatments for 12 or 24 h, Mdm2 WT MEF cells induced Mdm2, subsequently reducing total p53 levels with modest induction of p21 levels over the time course. The Mdm2 knock-out MEF exhibited sustained p53 stability with greater levels of p21 induction, a result that was expected due to the complete absence of MDM2 protein. Surprisingly, p53 activation in the Mdm2 C462A MEF, where an E3 ligase-deficient MDM2 is expressed, resulted in not only p53 activation as shown previously (14), but even higher levels of p53 transactivation as compared with the complete Mdm2 knock-out (Fig. 1A). Based on these observations, it was clear that p53ER transactivation potential could be represented as low, moderate, and high across Mdm2 WT, null, and C462A MEF, respectively.
FIGURE 1.
Dhrs3 is a p53-inducible gene. A, mouse embryonic fibroblasts harboring a single p53ER fusion allele and a single p53 null allele (p53 ER/-MEF) cell lines with the indicated Mdm2 genotypes were treated for 12 and 24 h with 4-OHT. Cells were harvested and analyzed by Western blot. B, corresponding microarray Log2 expression values of p53 ER/-MEF cell lines following 24 h treatment with 4-OHT. C, p53 ER/-MEF cell lines with the indicated Mdm2 genotypes were treated for 24 h with 4-OHT. Cells were harvested and analyzed by Western blot.
Because the MEF cell lines provided a unique system to study physiological levels of differential p53 transactivation potential without the confounding variables of genotoxic or cytotoxic stress normally required to stabilize p53, we performed a microarray experiment screening for novel p53 candidate target genes. As a means of validation of the screening, we identified a large number of the genes identified previously in a ChIP-chip array (16). The most robust candidates also met the arbitrary low-moderate-high Log2 expression threshold we observed in our MEF Western analysis for p21.
One robust candidate gene was Dhrs3, an oxidoreductase with significant homology to SDR (short-chain alcohol dehydrogenase/reductase) enzymes. Although Dhrs3 induction was low in the Mdm2 WT MEF after p53 activation, the Mdm2 null and C462A MEF had moderate-to-high expression of Dhrs3, respectively (Fig. 1B). The induced protein levels mirrored the Log2 expression values indicated by the microarray (Fig. 1C), thereby providing a strong correlation between transcript and protein levels. After our identification of Dhrs3 as a potential p53 target gene, another group published similar findings providing evidence for Dhrs3 as a bona fide direct p53 target gene (17). Given their findings, we sought to further characterize the localization and function of DHRS3.
DHRS3 Is an Endoplasmic Reticulum Protein
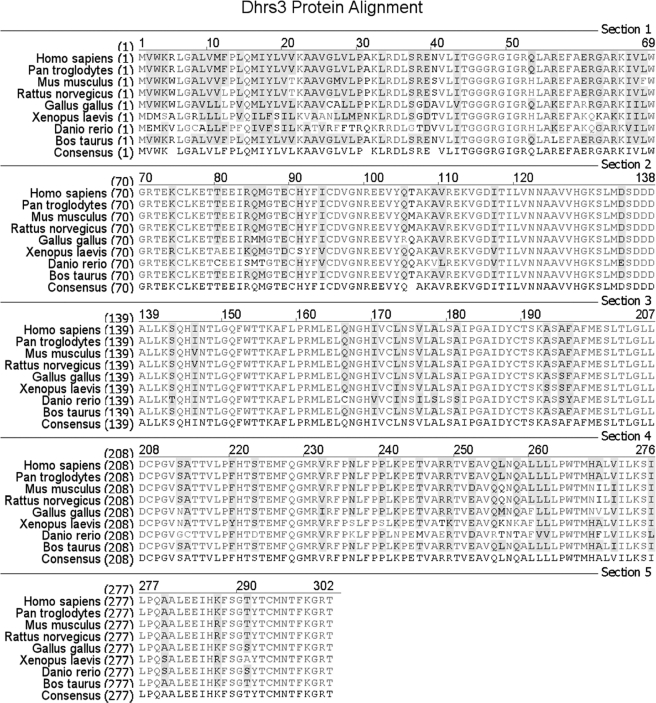
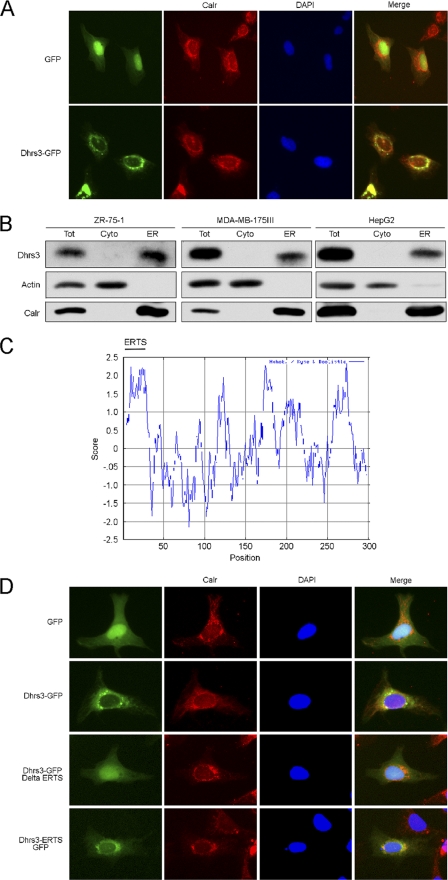
The DHRS3 protein sequence alignment among all known species specific alleles reveals a high degree of conservation with 98.7% homology and 70.2% identity down to zebrafish (Fig. 2), suggesting that DHRS3 is well conserved with a potential recent evolutionary divergence in eukaryotic organisms. Prediction of DHRS3 subcellular localization by computer algorithm (18) placed DHRS3 in the endoplasmic reticulum. To gain further insight into potential DHRS3 localization, a DHRS3-GFP fusion construct was generated expressing GFP at the C terminus of WT DHRS3. Expression of GFP alone was diffuse throughout the cell with a heavy concentration to the nucleus and did not co-localize with the ER protein calreticulin. DHRS3-GFP exhibited significant perinuclear expression with punctuate structures present within the same region. The diffuse perinuclear staining co-localized with calreticulin, suggesting that DHRS3 is an ER protein (Fig. 3A). Furthermore, HepG2 cells and two breast cancer cell lines ZR-75–1 and MDA-MB-175III were subjected to differential detergent fractionation (13) to separate cytosolic from ER proteins. All three cell types carry a WT p53 allele and express relatively high levels of DHRS3. DHRS3 was enriched with the calreticulin fraction and did not appear with actin in the cytosolic fraction (Fig. 3B). Thus, we identify DHRS3 is primarily an ER protein.
FIGURE 2.
DHRS3 is a highly conserved protein. The eight annotated protein sequences of species-specific DHRS3 were aligned for sequence similarity analysis.
FIGURE 3.
DHRS3 is an endoplasmic reticulum protein. A, U2OS cells were transfected with constructs expressing GFP or a DHRS3-GFP fusion protein for 24 h. Calreticulin (Calr) is an ER marker, and DAPI demarcates the nucleus. B, ZR-75-1, MDA-MB-175III, and HepG2 cells were partitioned into total (Tot), cytosolic-enriched (Cyto), or ER-enriched fractions and analyzed by Western blot. Actin is a cytosolic marker; calreticulin is an ER marker. C, a hydropathy plot of human DHRS3. The x axis represents amino acid position and the y axis represents amino acid hydropholicity (negative score) and hydrophobicity (positive score). The predicted endoplasmic reticulum targeting signal (ERTS) is shown. D, U2OS cells were transfected with GFP alone or the indicated DHRS3 fusion constructs for 24 h. The cells were immunostained for calreticulin, an ER control, and stained for DAPI to demarcate the nucleus.
Proteins destined for the ER generally require transport in the form of a selective sorting signal. In the case of ER proteins, many undergo translocation to the ER during translation in a process requiring an N-terminal targeting signal with approximate length of 20–30 amino acids containing an internal hydrophobic patch of residues (19). Although a high degree of conservation was found in terms of amino acid homology among species-specific DHRS3, the greatest degree of heterogeneity occurred in the N terminus (Fig. 2). A hydropathy plot of human DHRS3 exposed a stretch of strongly hydrophobic residues at the N terminus (Fig. 3C), consistent with a putative functional ER targeting signal. In addition, the subcellular prediction tool TargetP 1.1 (18) predicted an N-terminal sorting signal of 23 amino acids. To determine if the N-terminal 23 amino acids of DHRS3 could function as an ER sorting signal, GFP fusion constructs were expressed to track DHRS3 localization. As expected, full length DHRS3-GFP localized to the ER in a manner consistent with the calreticulin signal (Fig. 3D). Expression of the N-terminal 23-amino acid truncation mutant of DHRS3-GFP (DHRS3-GFP ΔERTS) resulted in a more diffuse cytosolic signal, as well as nuclear accumulation, that was similar to GFP expression alone. Furthermore, expression of an N-terminal GFP fusion protein containing exclusively the first 23 amino acids of DHRS3 showed partial localization to the ER and enhanced nuclear exclusion. Taken together, this suggests that the N-terminal 23 amino acids of DHRS3 are primarily necessary and sufficient to support translocation to the ER membrane.
DHRS3 Associates with Lipid Droplets in Hepatocytes
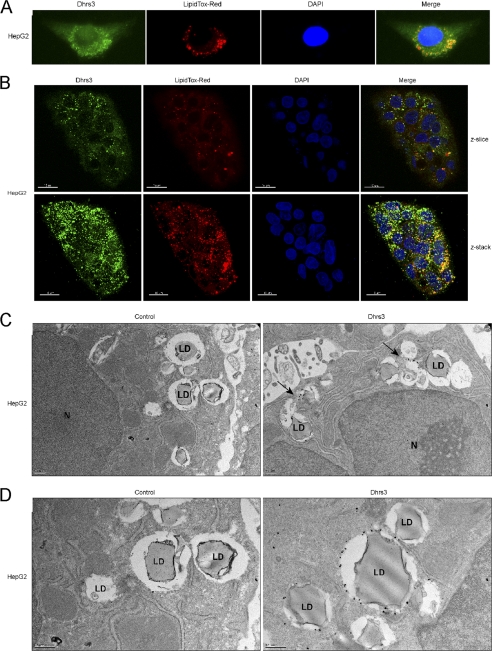
The liver serves as the primary storage tissue for retinoids, accounting for ∼70% of whole body retinoid storage (7). Specifically, a subfraction of hepatocytes, termed hepatic stellate cells, store retinol, in the form of retinyl esters, in cytoplasmic lipid droplets. Lipid droplets are considered to be primarily storage organelles for intracellular triacylglycerol, as well as cholesterol, sterol, and retinyl esters (20). The biosynthesis of lipid droplets occurs at the outer, cytosolic leaflet of the endoplasmic reticulum, where increasing concentrations of newly synthesized triacylglycerol in the ER lumen is thought to force “budding” at the ER, ultimately resulting in a neutral lipid droplet comprised of an ER-derived phospholipid monolayer (12). In conjunction with the observations of DHRS3-GFP at the ER, additional punctuate, spherical structures were present that did not co-localize with the ER marker. Given that DHRS3 is highly expressed in the hepatocellular carcinoma cell line HepG2 (Fig. 3C) and is reported to be a retinal reductase (9, 10), thereby promoting increased retinol substrate for esterification and storage, we reasoned that the additional observed localization may be concentrated to lipid droplets. After validating the antibody, immunostaining for endogenous DHRS3 in HepG2 revealed consistent halo structures that were concentrated to the perinuclear space (Fig. 4A). Neutral lipids are most abundant in cytoplasmic lipid droplets, so using a neutral lipid stain, LipidTOX Red, it was apparent that the concentrated DHRS3 halo structures extensively co-localized with lipid droplets (Fig. 4A). To gain further insight into the association of DHRS3 with lipid droplets, confocal scanning laser microscopy was performed on endogenous DHRS3 in HepG2 cells. A single cross-section (z-slice) of a HepG2 colony reveals that DHRS3 expression is concentrated to regions where lipid droplets are found (Fig. 4B). In addition, DHRS3 is also localized to the droplet monolayer in a fraction of lipid droplets observed. The composite Z-stack reveals significant overlap of the DHRS3 and LipidTOX Red signal, indicating that DHRS3 is indeed concentrated to regions of lipid droplet formation and may be directly associated with a subfraction of nascent droplets. Finally, immunogold labeling of endogenous DHRS3 indicates significant enrichment to both the ER foci of lipid droplet formation (Fig. 4C) but also to the outer phospholipid monolayer of lipid droplets (Fig. 4D). These results consistently demonstrate that DHRS3 is an ER protein concentrated to potential focal points of lipid droplet budding where it can also localize to the phospholipid monolayer of newly synthesized droplets.
FIGURE 4.
DHRS3 associates with lipid droplets in hepatocytes. A, immunofluorescence staining of endogenous DHRS3 in HepG2 cells. LipidTOX Red marks the lipid droplets, and DAPI marks the nucleus. B, confocal scans of endogenous DHRS3 in HepG2 cells. Both a single z-slice and the composite z-stack are shown. LipidTOX Red marks the lipid droplets, and DAPI marks the nucleus. Scale bar, 15 μm. C and D, transmission electron microscopy of immunogold-labeled endogenous DHRS3 in HepG2 cells. HepG2 monolayers were fixed, probed with secondary antibody alone (left) or α-DHRS3 primary antibody (right), and visualized by transmission electron microscopy. Representative lipid droplets (LD) and nucleus (N) are indicated. Arrows denote point of interest.
DHRS3 Is Expressed in Mature Adipocytes
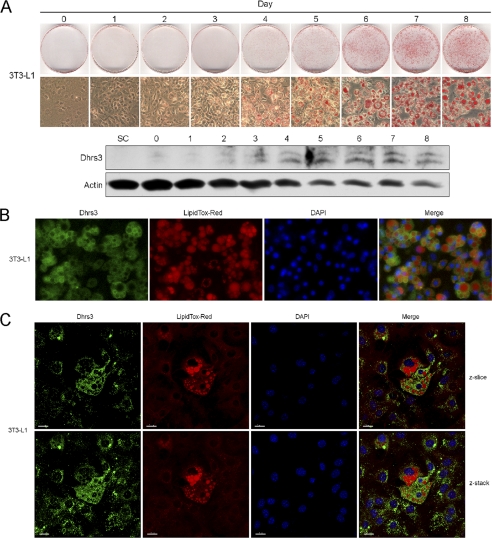
Adipocytes are secondary only to the liver in terms of retinoid storage, accounting for upwards of 15–20% of total body retinol (8). Given the observations that DHRS3 was expressed and concentrated to regions of lipid droplets in retinoid-storing hepatocytes, we investigated the expression and localization of DHRS3 in adipocytes. Using the standard murine 3T3-L1 preadipocyte cell line (21), we induced adipocyte differentiation over an 8-day period to assess DHRS3 expression. Differentiation was validated by staining the cells with the neutral lipid stain Oil Red O. Minimal protein expression was observed prior to day 3, including the subconfluent population. By days 4–8, coinciding with the onset of visible lipid accumulation and lipid droplet formation, DHRS3 levels gradually increased (Fig. 5A). Despite the overall decrease in actin levels, DHRS3 levels continue to go up, signifying enhanced expression in mature adipocytes. Immunofluorescent labeling of endogenous DHRS3 in mature adipocytes illustrates enrichment of DHRS3 in the cytosolic space, consistent with up-regulated ER localization. In addition, halo structures, correlating to the lipid droplets, were also observed (Fig. 5B), suggesting that DHRS3 may be associated with adipocyte lipid droplets as well. 3T3-L1 cells at terminal stages of differentiation were subjected to confocal microscopy to further gauge DHRS3 association with lipid droplets (Fig. 5C). The cells with the largest lipid droplets, indicative of a mature adipocyte phenotype, had the greatest saturation of DHRS3 signal in a manner consistent with the differentiation assay. In contrast, cells at more immature or intermediate stages of differentiation with little to no large lipid droplets, illustrated significantly decreased signal intensity for DHRS3. Together, the data suggest that enhanced DHRS3 expression at the ER is correlated to increased size and frequency of lipid droplet formation in mature adipocytes.
FIGURE 5.
DHRS3 is expressed in mature adipocytes. A, 3T3-L1 preadipocytes were induced to differentiate over an 8-day period. Representative samples were fixed and stained each day with Oil Red O and analyzed under phase-contrast microscopy. Cells were also harvested and analyzed by Western blot. Subconfluent (SC) and days 0–8 were probed for DHRS3 expression. B, immunofluorescence staining of endogenous DHRS3 in mature 3T3-L1 adipocytes. Preadipocytes were induced to differentiate over 8 days and processed for analysis. LipidTOX Red marks the lipid droplets, and DAPI marks the nucleus. C, confocal scans of endogenous DHRS3 in mature 3T3-L1 adipocytes. Both a single z-slice and the composite z-stack are shown. LipidTOX Red marks the lipid droplets, and DAPI marks the nucleus.
Lipid Droplet Formation Induces Delocalization of DHRS3 from ER to Lipid Droplets
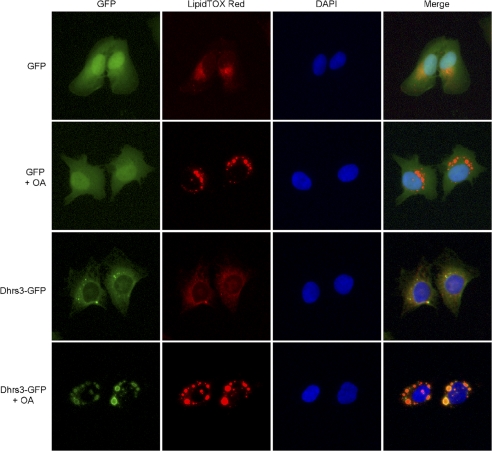
As the primary storage depot for newly synthesized triacylglycerol, lipid droplet biogenesis is sensitive to the degree of fatty acid availability. De novo triacylglycerol synthesis is catalyzed by a suite of enzymes localized to the ER and outer mitochondrial membranes (22). Excessive free fatty acid levels are known to induce lipid droplets (23), in part, through enhanced triacylglycerol synthesis and storage. Because endogenous DHRS3 localizes to concentrated regions of the ER where lipid droplets are located and is also found directly on lipid droplets themselves, we sought to determine whether induction of lipid droplet biogenesis would cause DHRS3 to concentrate to nascent lipid droplet monolayers. Stable polyclonal U2OS cells lines expressing either GFP or DHRS3-GFP were subjected to oleic acid treatment for 12 h to induce triacylglycerol synthesis and lipid droplet accumulation. DHRS3-GFP expression demonstrated a marked concentration to lipid droplets following treatment with oleic acid, with almost complete diminishment of the ER signal intensity, whereas GFP showed no alteration in localization (Fig. 6). These data support the notion that DHRS3 is concentrated to regions of lipid droplet budding on the ER and will localize to the monolayer of de novo lipid droplets.
FIGURE 6.
Lipid droplet formation induces delocalization of DHRS3 from the ER to lipid droplets. U2OS stable cell lines expressing GFP or DHRS3 GFP were treated for 12 h with oleic acid to induce lipid droplet formation and accumulation. LipidTOX Red marks the lipid droplets, and DAPI marks the nucleus.
Ectopic DHRS3 Expression Enhances Lipid Droplet Accumulation
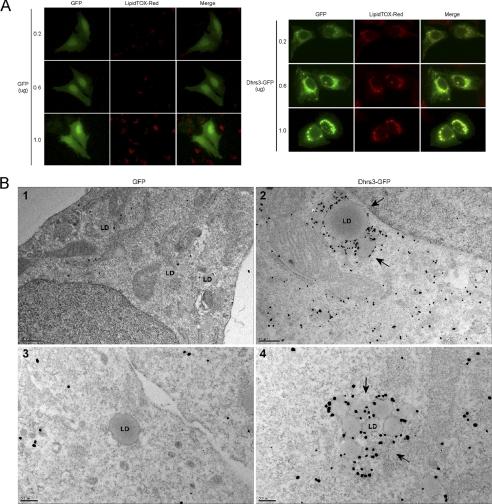
Because DHRS3 is localized to lipid droplets with expression correlating to cell types with significant lipid droplet accumulation, we investigated the contribution of DHRS3 expression to lipid droplet formation. U2OS cells, which have undetectable endogenous levels of DHRS3 (data not shown), were transfected with increasing levels of either GFP or DHRS3-GFP and assessed for neutral lipid levels and lipid droplet accumulation by LipidTOX Red staining. Expression levels of GFP had no effect on lipid droplet size, whereas DHRS3-GFP expression resulted in increasingly larger perinuclear structures that were positive for neutral lipid staining (Fig. 7A). Although the most intense LipidTOX punctuate staining appeared to coincide with lipid droplets, it was less clear what the larger irregular bodies represented. To gain further insight into the nature of the neutral lipid positive bodies, transmission electron microscopy was utilized to visualize both lipid droplets and DHRS3 in the GFP and DHRS3-GFP stable cell lines. Consistent with the immunofluorescence data, GFP-expressing cells had small, singular lipid droplets that stained negative for DHRS3 (Fig. 7B, panels 1 and 3). Interestingly, the DHRS3-GFP expressing cells also contained small, singular droplets, but more so, there were significant numbers of aggregated lipid droplets that were highly enriched for DHRS3 labeling (Fig. 7B, panels 2 and 4). In some cases, the droplets appeared to be of a more uniform size (Fig. 7B, panel 4), and, in other cases, there was a clear size discrepancy among the aggregated droplets (Fig. 7B, panel 2). The aggregated bodies of droplets from the transmission electron microscopy micrographs likely explain the irregular, neutral lipid bodies present in the immunofluorescence data of DHRS3-GFP expression. These results suggest that DHRS3 may have a contributing role to lipid droplet biogenesis and/or regulation.
FIGURE 7.
Ectopic DHRS3 expression enhances lipid droplet accumulation. A, U2OS cells were transfected with three different concentrations of GFP or DHRS3-GFP and analyzed for lipid droplet accumulation. LipidTOX Red marks the lipid droplets. B, transmission electron microscopy of immunogold-labeled ectopic DHRS3 in U2OS stable cell lines. U2OS monolayers were fixed, probed with α-DHRS3 primary antibody, and visualized by transmission electron microscopy. Representative lipid droplets (LD) are indicated. Panels 1 and 2 are 25,000× magnification and panels 3 and 4 are 50,000× magnification, respectively.
p53 Induction of DHRS3 Correlates to Greater Lipid Droplet Levels
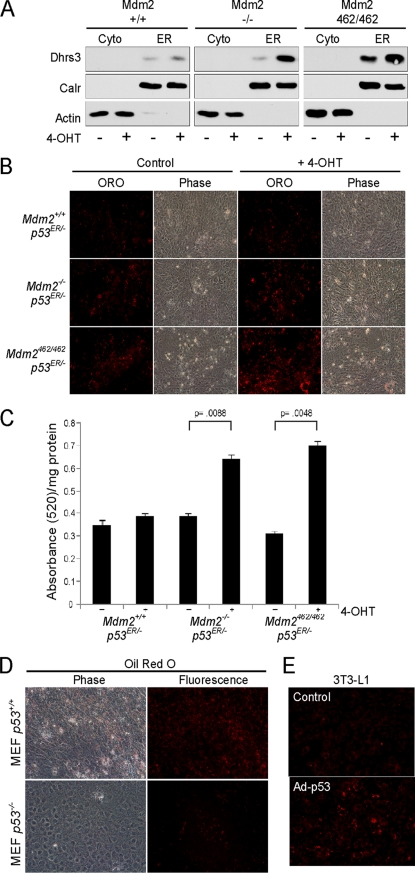
Given the observations supporting DHRS3 as an ER protein, the induction and accumulation of DHRS3 at the ER by p53 was assessed. MEF cells containing a p53ER allele and variable Mdm2 status (Mdm2 WT, null, or carrying the C462A allele) were fractionated biochemically into cytosolic and ER enriched fractions in the absence or presence of the p53ER agonist 4-OHT. Basal levels of DHRS3 were low in Mdm2 WT cells, modestly higher in Mdm2 null cells, and significantly higher in the Mdm2 C462A cells. Induction of p53 over 24 h in the ER enriched fractions resulted in increased DHRS3 levels in all three genotypes, whereas levels of calreticulin exhibited no change (Fig. 8A), providing further support for DHRS3 as a p53-inducible endoplasmic reticulum protein. Next, the contribution of p53 induction to lipid droplet accumulation was assessed. The same p53ER MEF cell lines were grown to confluence and either treated with 4-OHT for 24 h or left untreated. Visually, Mdm2 WT cells demonstrated no significant difference in lipid droplet accumulation when assessed by the degree of Oil Red O staining (Fig. 8B). However, Mdm2 null cells exhibited increased staining, and strikingly, the Mdm2 C462A cells showed an even greater increase over all the genotypes, particularly when contrasted to the Mdm2 WT cells. The Oil Red O was extracted from the samples and measured by spectrophotometry to quantitate total Oil Red O uptake. When normalized to the protein extracted from each sample, the quantified values showed a similar pattern to the microscopy results. Mdm2 WT had only a modest increase in lipid accumulation, whereas the Mdm2 null and Mdm2 C462A cell lines netted statistically significant intermediate and high levels of neutral lipid accumulation following p53 activation, respectively (Fig. 8C). Interestingly, the levels of Oil Red O across the three types of MEF cells with different Mdm2 genotypes, an indication of increased neutral lipid staining, are consistent with the observed levels of p53 transactivation and DHRS3 expression (Fig. 1C).
FIGURE 8.
p53 induction of DHRS3 correlates to greater lipid droplet levels. A, mouse embryonic fibroblasts harboring a single p53ER fusion allele and a single p53 null allele (p53 ER/- MEF) cell lines with the indicated Mdm2 genotypes were treated for 24 h with 4-OHT. Cells were harvested and partitioned into cytosolic-enriched (Cyto) or ER-enriched fractions and analyzed by Western blot. Actin is a cytosolic marker, and calreticulin (Calr) is an ER marker. B, p53 ER/- MEF cell lines with the indicated Mdm2 genotypes were treated for 24 h with 4-OHT and stained with Oil Red O (ORO). Cells were visualized for Oil Red O uptake by fluorescence microscopy. Phase contrast image (Phase) is shown for cell density control. C, Oil Red O was extracted from samples in B and analyzed by spectrophotometry. The ratio of total Oil Red O absorbance per milligram of protein was used to quantitate total values. p values are shown for statistically significant samples. Error bars represent S.E. D, p53 +/+ and −/− MEF cells were grown to confluence and stained with Oil Red O. Stain uptake was visualized by phase-contrast and fluorescence microscopy. E, 3T3-L1 preadipocytes were either transduced with adenovirus expressing p53 or left untreated. Cells were stained with Oil Red O 24 h post-transduction.
To further assess the correlation of p53 to lipid droplet formation, p53 WT and null MEF cells were grown to confluence and then stained with Oil Red O. In the presence of p53, significantly more Oil Red O uptake was observed (Fig. 8D). This pattern was consistent with 3T3-L1 cells that were transiently infected with adenovirus overexpressing p53, where increased neutral lipid staining was evident (Fig. 8E). Based on the observations that DHRS3 is an ER-derived lipid droplet protein involved in the lipid droplet-mediated storage of retinol, it is possible induction of Dhrs3 may be a component of a broader p53-mediated metabolic program that modulates lipid accumulation and lipid droplet biosynthesis. Future investigation is necessary to further explore and validate these findings.
DISCUSSION
To date, p53 has been reported to be involved in a number of aspects of normal cellular metabolism. Here, we report an unexpected and novel role for p53 in retinoid metabolism with implications for lipid droplet accumulation. As a novel metabolic target gene of p53, DHRS3 is a well conserved protein that is actively targeted to the endoplasmic reticulum. DHRS3 appears to concentrate to ER foci of lipid droplet formation, where upon budding, DHRS3 is delocalized from the ER to the ER-derived monolayer of nascent lipid droplets. Interestingly, the degree of lipid droplet accumulation is dependent on the relative activity of p53, which mirrors DHRS3 expression.
As the biologically active form of vitamin A, all-trans RA exerts effects on cell proliferation, survival, and differentiation by modulating gene expression through the retinoic acid receptors and retinoic X receptors (24). Retinol dehydrogenases oxidize retinol to all-trans-retinaldehyde, which can be further oxidized to RA via retinaldehyde degydrogenases (6). Conversely, retinol can be esterified to retinyl esters primarily by the enzyme lecithin:retinol acyltransferase (LRAT) (25). Hence, the bioavailability of free RA is, in part, regulated by the fluctuation of oxidized and reduced forms of retinol. The compartmentalization and sequestration of retinol in lipid droplets may provide a mechanism for regulating retinol concentrations. Because DHRS3 is a retinaldehyde reductase that promotes retinol storage (10), modulating expression levels may be one way of limiting the activity of RA.
The liver contains a specialized cell population, hepatic stellate cells (HSCs), which are largely responsible for storing the majority of liver retinol (7). One characteristic feature of HSCs is the presence of large cytoplasmic lipid droplets, where retinyl esters are estimated to comprise upwards of 50% of the total droplet content (26). HSCs are also maintained in a temporarily arrested, or quiescent, phase of the cell cycle. Following liver injury, HSCs are activated and primed to enter the cell cycle where depletion of cytoplasmic lipid droplets coincides with HSC proliferation and potentially contributes, in an unknown manner, to the development of hepatic fibrosis (27). Interestingly, p53 has been reported to play a role in cellular quiescence where modest and transient activation, in the absence of overt genotoxic stress, can trigger a reversible arrest from the cell cycle (28, 29). To date, there is no known role for p53 in HSC cell cycle dynamics. However, low level activation of p53 could have a 2-fold effect by regulating cell cycle related genes to promote HSC quiescence, as well as driving DHRS3 expression where the subsequent increase in retinol levels would contribute to the observed increase in cytoplasmic lipid droplet volume and number (30). Sequestration of retinol in cytoplasmic lipid droplets may also potentially limit activity of biologically active retinoids, which have been implicated in promoting liver fibrosis (31), thereby providing potential indirect crosstalk between p53 and retinoid activated nuclear receptors.
As mentioned previously, adipocytes are the second most abundant storage site for retinoids, where they are estimated to harbor upwards of 20% of total body retinol. Retinoids play an important role in adipogenesis (32), where the primary oxidation products of retinol, retinaldehyde, and retinoic acid, have both been demonstrated to suppress adipocyte differentiation in the early stages of maturation (33, 34). Interestingly, another oxidoreductase associated with retinoid metabolism and adipogenesis is retinol saturase; a direct target gene of peroxisome proliferator-activated receptor γ, one of the master regulators of adipogenesis, with expression induced during the initial phase of differentiation (35). Retinol saturase is an enzyme that catalyzes the conversion of all-trans-retinol to all-trans-13,14-dihydroretinol and, similar to DHRS3, is also an endoplasmic reticulum protein (36). Given our observations that DHRS3 is induced during adipogenesis and is a component of the ER and lipid droplets, it may be possible that DHRS3 is part of a suite of retinoid modulating enzymes that are specific to a subset of specialized lipid droplets that regulate cytosolic retinol concentrations in an effort to control the adipogenic program.
The mechanisms surrounding lipid droplet formation, accumulation, and homeostasis are relatively unclear. Here, we present the surprising finding that p53 activation promotes lipid droplet accumulation in the subset of cell types examined. This observation is supported by evidence in rat glioma C6 cells, which harbor WT p53, where growth compromised cells were shown to accumulate intracellular lipid droplets (37). LRAT knock-out mice, which are deficient in retinol storage, were found to be completely absent of lipid droplets in hepatic stellate cells (25). Here, we demonstrate that DHRS3 overexpression also increased lipid droplet numbers. In conjunction with the LRAT study, this suggests that the enzymes promoting retinol storage may be implicated in promoting lipid droplet formation. In addition, dietary retinoid levels have a profound effect on neutral lipid uptake in lipid droplets (26), suggesting that increased retinol levels promote enhanced triacylglycerol storage in lipid droplets. Taken together, p53 mediated induction of DHRS3 may promote formation of retinol specific lipid droplets by increasing intracellular retinol levels and enhancing triacylglycerol storage to coincide with a proper stoichiometric balance of retinyl esters in nascent lipid droplets. During conditions where cells are not proliferating, lipid droplet storage of retinol could act as a holding phase for biologically active retinoids that may otherwise function during an active cell cycle to modulate gene expression. In addition, p53-directed storage of neutral lipids could provide a means to accumulate lipid substrates, which become important for the biosynthesis of new daughter cell membranes, as well as serving as a potential energy source, during phases of active cell growth and division.
The same aspects of cell proliferation and differentiation that are modulated by retinoids in normal cells are also regulated in cancer cells. DHRS3 expression was shown to be up-regulated in transformed buccal keratinocytes (38), papillary thyroid carcinomas (39, 40), and neuroblastomas (41). The up-regulated expression may limit the activity of RA, which is generally thought to have an inhibitory effect on the cell cycle and promote apoptosis in some cancer cell lines (6), thereby exerting a prosurvival effect. However, despite the enhanced expression, DHRS3 was negatively correlated with metastasis in papillary thyroid carcinomas (39), associated with better prognosis in neuroblastoma (41), and found to have a methylated promoter, an indicator of gene silencing, in a subset of human malignant melanomas (42), all consistent with a potential favorable role in tumor suppression. Given the well established role of p53 in tumor suppression and the validation of DHRS3 as a bona fide p53 target gene (17), it will be worthwhile to investigate any potential cross-talk between p53, DHRS3, and retinoid signaling as they relate to inhibition or promotion of tumor initiation and progression.
Acknowledgment
We thank Rosalind Coleman for inspirational discussions.
This work was supported, in whole or in part, by grants from the National Institutes of Health and the American Cancer Society (2R01-CA100302, 1R01-CA127770, and 1RC2CA148487-01, to Y. Z.).
- RA
- retinoic acid
- ER
- endoplasmic reticulum
- MEF
- mouse embryo fibroblast(s)
- 4-OHT
- 4-hydroxytamoxifen
- PB
- sodium phosphate buffer
- HSC
- hepatic stellate cell
- LRAT
- lecithin:retinol acyltransferase.
REFERENCES
- 1. Levine A. J. (1997) Cell 88, 323–331 [DOI] [PubMed] [Google Scholar]
- 2. Kondoh H., Lleonart M. E., Gil J., Wang J., Degan P., Peters G., Martinez D., Carnero A., Beach D. (2005) Cancer Res. 65, 177–185 [PubMed] [Google Scholar]
- 3. Matoba S., Kang J. G., Patino W. D., Wragg A., Boehm M., Gavrilova O., Hurley P. J., Bunz F., Hwang P. M. (2006) Science 312, 1650–1653 [DOI] [PubMed] [Google Scholar]
- 4. Bensaad K., Tsuruta A., Selak M. A., Vidal M. N., Nakano K., Bartrons R., Gottlieb E., Vousden K. H. (2006) Cell 126, 107–120 [DOI] [PubMed] [Google Scholar]
- 5. Ide T., Brown-Endres L., Chu K., Ongusaha P. P., Ohtsuka T., El-Deiry W. S., Aaronson S. A., Lee S. W. (2009) Mol. Cell 36, 379–392 [DOI] [PMC free article] [PubMed] [Google Scholar] [Retracted]
- 6. Tang X. H., Gudas L. J. (2011) Annu. Rev. Pathol. 28, 345–364 [DOI] [PubMed] [Google Scholar]
- 7. Blaner W. S., O'Byrne S. M., Wongsiriroj N., Kluwe J., D'Ambrosio D. M., Jiang H., Schwabe R. F., Hillman E. M., Piantedosi R., Libien J. (2009) Biochim. Biophys. Acta 1791, 467–473 [DOI] [PMC free article] [PubMed] [Google Scholar]
- 8. Tsutsumi C., Okuno M., Tannous L., Piantedosi R., Allan M., Goodman D. S., Blaner W. S. (1992) J. Biol. Chem. 267, 1805–1810 [PubMed] [Google Scholar]
- 9. Haeseleer F., Huang J., Lebioda L., Saari J. C., Palczewski K. (1998) J. Biol. Chem. 273, 21790–21799 [DOI] [PubMed] [Google Scholar]
- 10. Cerignoli F., Guo X., Cardinali B., Rinaldi C., Casaletto J., Frati L., Screpanti I., Gudas L. J., Gulino A., Thiele C. J., Giannini G. (2002) Cancer Res. 62, 1196–1204 [PubMed] [Google Scholar]
- 11. Kam R. K., Chen Y., Chan S. O., Chan W. Y., Dawid I. B., Zhao H. (2010) Int. J. Dev. Biol. 54, 1355–1360 [DOI] [PMC free article] [PubMed] [Google Scholar]
- 12. Martin S., Parton R. G. (2006) Nat. Rev. Mol. Cell Biol. 7, 373–378 [DOI] [PubMed] [Google Scholar]
- 13. Ramsby M. L., Makowski G. S. (1999) Methods Mol. Biol. 112, 53–66 [DOI] [PubMed] [Google Scholar]
- 14. Itahana K., Mao H., Jin A., Itahana Y., Clegg H. V., Lindström M. S., Bhat K. P., Godfrey V. L., Evan G. I., Zhang Y. (2007) Cancer Cell 12, 355–366 [DOI] [PubMed] [Google Scholar]
- 15. Christophorou M. A., Martin-Zanca D., Soucek L., Lawlor E. R., Brown-Swigart L., Verschuren E. W., Evan G. I. (2005) Nat. Genet. 37, 718–726 [DOI] [PubMed] [Google Scholar]
- 16. Smeenk L., van Heeringen S. J., Koeppel M., van Driel M. A., Bartels S. J., Akkers R. C., Denissov S., Stunnenberg H. G., Lohrum M. (2008) Nucleic Acids Res. 36, 3639–3654 [DOI] [PMC free article] [PubMed] [Google Scholar]
- 17. Kirschner R. D., Rother K., Müller G. A., Engeland K. (2010) Cell Cycle 9, 2177–2188 [DOI] [PubMed] [Google Scholar]
- 18. Emanuelsson O., Nielsen H., Brunak S., von Heijne G. (2000) J. Mol. Biol. 300, 1005–1016 [DOI] [PubMed] [Google Scholar]
- 19. Hegde R. S., Bernstein H. D. (2006) Trends Biochem. Sci 31, 563–571 [DOI] [PubMed] [Google Scholar]
- 20. Brasaemle D. L. (2007) J. Lipid Res. 48, 2547–2559 [DOI] [PubMed] [Google Scholar]
- 21. Green H., Meuth M. (1974) Cell 3, 127–133 [DOI] [PubMed] [Google Scholar]
- 22. Coleman R. A., Lee D. P. (2004) Prog. Lipid Res. 43, 134–176 [DOI] [PubMed] [Google Scholar]
- 23. Pol A., Martin S., Fernandez M. A., Ferguson C., Carozzi A., Luetterforst R., Enrich C., Parton R. G. (2004) Mol. Biol. Cell 15, 99–110 [DOI] [PMC free article] [PubMed] [Google Scholar]
- 24. Lefebvre P., Martin P. J., Flajollet S., Dedieu S., Billaut X., Lefebvre B. (2005) Vitam. Horm. 70, 199–264 [DOI] [PubMed] [Google Scholar]
- 25. O'Byrne S. M., Wongsiriroj N., Libien J., Vogel S., Goldberg I. J., Baehr W., Palczewski K., Blaner W. S. (2005) J. Biol. Chem. 280, 35647–35657 [DOI] [PMC free article] [PubMed] [Google Scholar]
- 26. Moriwaki H., Blaner W. S., Piantedosi R., Goodman D. S. (1988) J. Lipid Res. 29, 1523–1534 [PubMed] [Google Scholar]
- 27. Friedman S. L. (2006) J. Gastroenterol. Hepatol. 21, S79–83 [DOI] [PubMed] [Google Scholar]
- 28. Leontieva O. V., Gudkov A. V., Blagosklonny M. V. (2010) Cell Cycle 9, 4323–4327 [DOI] [PubMed] [Google Scholar]
- 29. Korotchkina L. G., Demidenko Z. N., Gudkov A. V., Blagosklonny M. V. (2009) Cell Cycle 8, 3777–3781 [DOI] [PubMed] [Google Scholar]
- 30. Friedman S. L. (2008) Physiol. Rev. 88, 125–172 [DOI] [PMC free article] [PubMed] [Google Scholar]
- 31. Okuno M., Kojima S., Akita K., Matsushima-Nishiwaki R., Adachi S., Sano T., Takano Y., Takai K., Obora A., Yasuda I., Shiratori Y., Okano Y., Shimada J., Suzuki Y., Muto Y., Moriwaki Y. (2002) Front Biosci. 7, D204–218 [DOI] [PubMed] [Google Scholar]
- 32. Xue J. C., Schwarz E. J., Chawla A., Lazar M. A. (1996) Mol. Cell. Biol. 16, 1567–1575 [DOI] [PMC free article] [PubMed] [Google Scholar]
- 33. Ziouzenkova O., Orasanu G., Sharlach M., Akiyama T. E., Berger J. P., Viereck J., Hamilton J. A., Tang G., Dolnikowski G. G., Vogel S., Duester G., Plutzky J. (2007) Nat. Med. 13, 695–702 [DOI] [PMC free article] [PubMed] [Google Scholar]
- 34. Schwarz E. J., Reginato M. J., Shao D., Krakow S. L., Lazar M. A. (1997) Mol. Cell. Biol. 17, 1552–1561 [DOI] [PMC free article] [PubMed] [Google Scholar]
- 35. Schupp M., Lefterova M. I., Janke J., Leitner K., Cristancho A. G., Mullican S. E., Qatanani M., Szwergold N., Steger D. J., Curtin J. C., Kim R. J., Suh M. J., Albert M. R., Engeli S., Gudas L. J., Lazar M. A. (2009) Proc. Natl. Acad. Sci. U.S.A. 106, 1105–1110 [DOI] [PMC free article] [PubMed] [Google Scholar]
- 36. Moise A. R., Kuksa V., Imanishi Y., Palczewski K. (2004) J. Biol. Chem. 279, 50230–50242 [DOI] [PMC free article] [PubMed] [Google Scholar]
- 37. Barba I., Cabañas M. E., Arús C. (1999) Cancer Res. 59, 1861–1868 [PubMed] [Google Scholar]
- 38. Staab C. A., Ceder R., Roberg K., Grafström R. C., Höög J. O. (2008) Cell Mol. Life Sci. 65, 3653–3663 [DOI] [PMC free article] [PubMed] [Google Scholar]
- 39. Oler G., Camacho C. P., Hojaij F. C., Michaluart P., Jr., Riggins G. J., Cerutti J. M. (2008) Clin. Cancer Res. 14, 4735–4742 [DOI] [PMC free article] [PubMed] [Google Scholar]
- 40. Stein L., Rothschild J., Luce J., Cowell J. K., Thomas G., Bogdanova T. I., Tronko M. D., Hawthorn L. (2010) Thyroid 20, 475–487 [DOI] [PubMed] [Google Scholar]
- 41. Kamei N., Hiyama K., Yamaoka H., Kamimatsuse A., Onitake Y., Sueda T., Hiyama E. (2009) Pediatr. Surg. Int. 25, 931–937 [DOI] [PubMed] [Google Scholar]
- 42. Furuta J., Nobeyama Y., Umebayashi Y., Otsuka F., Kikuchi K., Ushijima T. (2006) Cancer Res. 66, 6080–6086 [DOI] [PubMed] [Google Scholar]


