Abstract
Two Drosophila myosin II point mutations (D45 and Mhc5) generate Drosophila cardiac phenotypes that are similar to dilated or restrictive human cardiomyopathies. Our homology models suggest that the mutations (A261T in D45, G200D in Mhc5) could stabilize (D45) or destabilize (Mhc5) loop 1 of myosin, a region known to influence ADP release. To gain insight into the molecular mechanism that causes the cardiomyopathic phenotypes to develop, we determined whether the kinetic properties of the mutant molecules have been altered. We used myosin subfragment 1 (S1) carrying either of the two mutations (S1A261T and S1G200D) from the indirect flight muscles of Drosophila. The kinetic data show that the two point mutations have an opposite effect on the enzymatic activity of S1. S1A261T is less active (reduced ATPase, higher ADP affinity for S1 and actomyosin subfragment 1 (actin·S1), and reduced ATP-induced dissociation of actin·S1), whereas S1G200D shows increased enzymatic activity (enhanced ATPase, reduced ADP affinity for both S1 and actin·S1). The opposite changes in the myosin properties are consistent with the induced cardiac phenotypes for S1A261T (dilated) and S1G200D (restrictive). Our results provide novel insights into the molecular mechanisms that cause different cardiomyopathy phenotypes for these mutants. In addition, we report that S1A261T weakens the affinity of S1·ADP for actin, whereas S1G200D increases it. This may account for the suppression (A261T) or enhancement (G200D) of the skeletal muscle hypercontraction phenotype induced by the troponin I held-up2 mutation in Drosophila.
Keywords: Cardiac Muscle, Drosophila, Enzyme Kinetics, Enzyme Mutation, Myosin, Skeletal Muscle, Dilated Cardiomyopathy, Restrictive Cardiomyopathy, Troponin I
Introduction
Myosins are a large family of actin-based molecular motor proteins, of which at least 35 different classes are known (1). They show a wide variety of different mechanical activities, such as muscle contraction, phagocytosis, cell motility, tension maintenance, and vesicle transport (2). Striated muscle myosin is a class II molecular motor and consists of two myosin heavy chains (MHC), two essential light chains, and two regulatory light chains. Muscle contraction results from cyclic interactions between myosin II motors and actin filaments, also known as the cross-bridge cycle. These force-generating interactions are driven by the hydrolysis of ATP at the myosin active site (3). Mutations in human myosin II domains have been associated with both skeletal and cardiac myopathies (4).
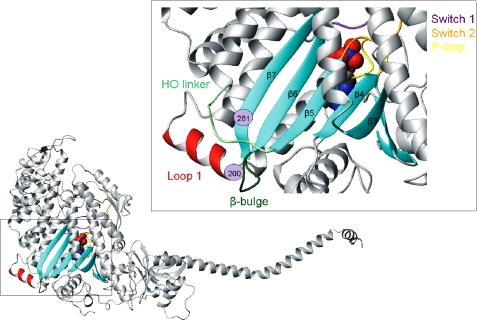
Drosophila melanogaster has been described as a useful model system to study cardiomyopathies (5, 6). A recent study of myosin heavy chain mutations in Drosophila has shown that two mutations in the myosin motor domain generate defects in the Drosophila heart. The mutation known as D454 (point mutation A261T) has a phenotype similar to human dilated cardiomyopathy (DCM),5 whereas Mhc5 (point mutation G200D) has a restrictive cardiomyopathy phenotype (RCM, a subset of hypertrophic cardiomyopathies (HCMs)) (7). The two myosin mutations identified are localized in the transducer region (Fig. 1), which is encoded by constitutive exons of the alternatively spliced Mhc transcript. D45 (A261T) is located on one of the β-strands (β7) close to the β-bulge between β6 and β7, whereas Mhc5 (G200D) is at the N-terminal side of loop 1 (using chicken skeletal myosin residue numbers as introduced by Kronert et al. (8); the analogous Drosophila residues are Gly200 and Ala258). The transducer region is thought to integrate the structural changes from different parts of the motor domain and includes the seven-stranded β-sheet plus various flexible elements such as loop 1, the β-bulge between β6 and β7, the HO-linker, and the nucleotide-sensing elements such as the phosphate binding loop (P-loop), switch-1, and switch-2 (11). The seven-stranded β-sheet becomes distorted when myosin switches between the rigor-like and post-rigor states, and this distortion is facilitated by the flexible elements.
FIGURE 1.
Location of the transducer in the myosin motor domain of Drosophila. Shown is a homology model of Drosophila myosin S1 built using the crystal structure of scallop myosin (pre-powerstroke conformation) as a template (PDB code 1qvi). The transducer region in the myosin head of Drosophila is indicated and expanded in a separate panel. The locations of the two point mutations, S1G200D and S1A261T, are indicated (purple circles), and the position of the nucleotide (space-filling model) is also shown.
In an earlier study, D45 and Mhc5 were shown to interact with a mutation in troponin I (held-up2 (hdp2)) that causes hypercontractility of the indirect flight muscle (IFM) (8). D45 is a suppressor of the TnI mutation (A116V) in the IFM, and in Drosophila hearts, it leads to a DCM-like phenotype in the presence of normal troponin I, whereas Mhc5 leads to RCM in the heart and is lethal in combination with hdp2. This suggests the likelihood of opposite effects of the two myosin mutations in regard to TnI interaction and that such differential activity may lead to the observed alternative cardiomyopathies.
Although a large number of human cardiomyopathies have been linked with specific mutations in sarcomeric proteins, including myosins, the causal relationship is not well understood. For mutations in the thin filament proteins tropomyosin (Tm) and troponin (Tn), there is an emerging paradigm that mutations that increase calcium sensitivity of the thin filament regulation of contraction result in HCM, whereas a decrease in calcium sensitivity is associated with DCM (9, 10). Because the held-up2 TnI mutation leads to over-contraction, the myosin mutation may reduce calcium sensitivity (D45) to compensate for the TnI mutation or increase it further (Mhc5) to cause lethality. Indeed, Drosophila D45 myosin has reduced ATPase activity and reduced in vitro motility, whereas Mhc5 myosin displays an increase in both ATPase activity and in vitro motility (7). It was argued that this is consistent with D45 suppressing the TnI mutation and Mhc5 enhancing it. However, the molecular mechanism for this interaction remains to be explored.
In this study, we used myosin subfragment 1 (S1) to investigate the transient and steady-state kinetics of the two transducer mutants of myosin S1 that suppress (A261T) or enhance (G200D) the TnI defect (A116V). We will use S1A261T and S1G200D nomenclature for the two mutants throughout this study, and the properties and nomenclature of these mutants are summarized in Table 1. The kinetic data show that the two point mutations have an opposite effect on the enzymatic activity of S1 myosin as compared with wild type, resulting in a less active myosin (S1A261T) or more active myosin (S1G200D). These observations are consistent with the induced cardiac phenotypes for the two mutants. In addition, we report that the two mutations change the affinity of S1·ADP for actin in opposite directions and that these changes can account for the differential interaction of the two mutations with the TnI held-up2 mutation in Drosophila.
TABLE 1.
Overview of the two Drosophila myosin transducer mutants
| Mhc5 | D45 | |
|---|---|---|
| Point mutation | G200D | A261T |
| Location in transducer | Loop 1 | β7 |
| Interaction with flightless TnI (A116V) held-up2 allele | Lethal | Rescued |
| Drosophila cardiac phenotype | RCM | DCM |
EXPERIMENTAL PROCEDURES
Myosin Isolation and Generation of Its S1
Myosin was isolated from IFM of less than 1-day-old wild-type and D45(A261T) or Mhc5(G200D) mutant flies as described previously (12). The original procedure has been modified so that all dilutions were carried out with water containing 10 mm DTT and all solution volumes were reduced to 75% (7). Digestion of the S1 subfragment was carried out with chymotrypsin as described previously (13–15) with the following modifications. The final myosin pellet obtained after centrifugation was resuspended in digestion buffer (120 mm NaCl, 20 mm Na2PO4, pH 7.0, 1 mm EDTA, and 20 mm DTT). Samples were incubated on ice for ∼6 min. The myosin solution was then placed in a 20 °C water bath for 5 min for temperature equilibration. The addition of α-chymotrypsin (0.2 mg/ml final concentration from 10 mg/ml stock solution) to the myosin solution was carried out in the 20 °C water bath followed by incubation for 6 min. To quench the reaction, 1.5 mm (final concentration) of phenylmethylsulfonyl fluoride (PMSF) was added. To pellet undigested myosin or myosin rod, the sample was immediately centrifuged at 68,000 rpm (250,000 × g, TLA 100.3 rotor) for 30 min in a Beckman ultracentrifuge. The supernatant was removed and diluted 10-fold with low salt buffer (30 mm KCl, 5 mm MgCl2, 20 mm MOPS, pH 7.0, and 4 mm DTT) and incubated for 30 min on ice. Any remaining uncut myosin or rod contamination was eliminated by centrifugation at 68,000 rpm for 20 min. For S1 concentration, the samples were centrifuged at 12,000 × g in a Sorvall MC 12 V at 4 °C using a Millipore Ultrafree 0.5-μm centrifugal Biomax-5 filter with a 5-kDa cutoff. The final volume of the supernatant was 40–60 μl. S1 concentration was determined from A280 (= 0.75 cm−1 for 1 mg of S1 per ml) and a molecular mass of 115 kDa. A single band of S1 was detected on SDS polyacrylamide gels for all samples. All steady-state kinetic measurements were performed with freshly prepared S1, and transient kinetics experiments were performed within 1 week after S1 preparation.
G- and F-actin Preparation
G-actin was isolated from acetone powder of chicken skeletal muscle as described previously (1–4). After multiple cycles of polymerization-depolymerization, soluble G-actin was obtained after dialysis against 2 mm Tris-Cl (pH 8), 0.2 mm ATP, 2 mm CaCl2, and 1 mm DTT and quantified spectrophotometrically using an extinction coefficient of 0.62 cm− (A310 nm–A290 nm) for 1 mg of actin ml−1. To obtain a G-actin solution of 150–250 μm, the G-actin solution was concentrated using a Millipore Biomax-5 filter as described above. F-actin was prepared by adding 1 volume of 10× polymerization buffer (50 mm Tris-Cl, pH 8, 0.5 m KCl, 20 mm MgCl2, and 10 mm ATP) to 9 volumes of G-actin. Actin was stored on ice at 4 °C and used within 1 month of preparation for actin-activated Mg2+-ATPase assays.
Steady-state ATPase Activity
ATPase activities were determined using [γ-32P]ATP as described previously in detail for full-length myosin (7). Ca2+ ATPase was carried out as per full-length myosin, but basal Mg2+ and actin-activated Mg2+-ATPase procedures involved some modifications. Briefly, 2 μg of S1 were added to Mg-ATPase solution without KCl (10 mm imidazole, 0.1 mm CaCl2, 1 mm MgCl2, 1 mm [γ-32P]ATP), in the absence or in the presence of increasing concentrations of F-actin. After 30 min at room temperature (21–23 °C), the reaction was quenched using 1.8 n HClO4. Extraction and scintillation counting were carried out essentially as for full-length myosin (7, 13). Basal Mg2+-ATPase activities obtained in the absence of actin were subtracted from all data points. Actin-activated Vmax and Km values for actin were obtained by fitting all data points from several preparations of wild-type or mutant S1 with the Michaelis-Menten equation using SigmaPlot. Values were averaged to give mean ± S.D. Statistical differences of Ca2+ ATPase, Mg2+ ATPase, Vmax, and Km between wild-type and mutant S1 were carried out using Student's t tests.
Chemicals
Caged ATP (cATP) was purchased from Molecular Probes. Coumarin-labeled ATP (3′-O-{N-[2-(7-diethylamino-coumarin-3-carboxamido)ethyl]carbamoyl}-ATP, abbreviated to eda-deac-ATP) was a gift from Martin Webb (National Institute for Medical Research, Mill Hill, London, UK) and was prepared for use in the transient kinetic studies according to methods described previously (16, 17).
Flash Photolysis System
Due to the small amount of protein available and the relatively poor fluorescence signal changes observed with pyrene-labeled actin, flash photolysis was the method of choice to investigate the kinetic properties of the Drosophila myosin S1 proteins (18). The ATP-induced dissociation of the actin·S1 complex changes the light-scattering signal, and the dissociation of nucleotide from S1 was followed by fluorescence changes. All light-scattering experiments were conducted in a low salt buffer (pH 7.0: 30 mm KCl, 5 mm MgCl2, 20 mm MOPS, and 10 mm DTT, 20 °C) with 1 μm actin, 1–3 μm S1, and 500 μm cATP. eda-deac-ADP dissociation experiments were also performed in this low salt buffer and contained 4 μm S1, 10 μm eda-deac-ATP (source of eda-deac-ADP), and 100 μm cATP (S1A261T) or caged ADP (cADP) (S1G200D).
Analysis of Transient Kinetic Data
The following equation was derived from the interaction of actin and S1 with ATP and ADP shown in Scheme 1 and was used to determine KAD
where kobs is the observed rate constant for the ATP-induced dissociation of actin·S1; K1k+2 is the second-order rate constant for ATP binding to actin·S1; and KAD is the equilibrium dissociation constant for the binding of ADP to actin·S1. The equation krel = kobs/k0 was used to determine the relative rate constant (krel) shown in Fig. 5, where k0 is the value when [ADP] = 0.
SCHEME 1.
The interaction of S1 with actin, ATP and ADP. M, A, T, and D symbolize S1, actin, ATP, and ADP, respectively.
FIGURE 5.
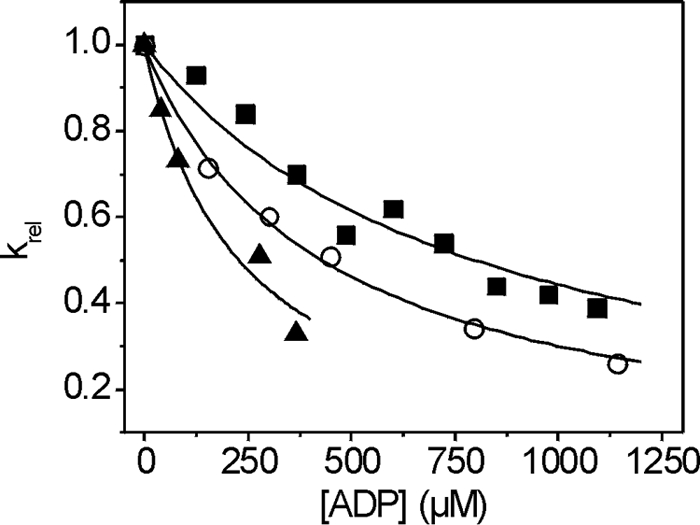
The affinity of ADP (KAD) for actin·S1. The dissociation of actin·S1 was induced by ATP in the presence of ADP ranging from 0 to 1200 μm. The light-scattering traces were fitted with single exponentials to determine the kobs. Hyperbolic plots of the krel (kobs/k0) versus ADP concentration were fitted with an equation derived from Scheme 1 (kobs = K1k+2([ATP]/(1 + [ADP]/KAD)) to determine KAD. The fits yielded a value of 293 ± 61 μm for S1A261T (▴) and 604 ± 157 μm for S1G200D (■) as compared with 409 ± 26 μm for wild-type IFI (○).
Co-sedimentation Assay
Co-sedimentation assays were done as described previously with some minor modifications (14). S1 (100 nm) was incubated with increasing actin concentrations (0–500 nm) in low salt buffer (30 mm KCl, 5 mm MgCl2, 20 mm MOPS, pH 7.0, and 4 mm DTT) with a total volume of 100 μl and then centrifuged at 400,000 × g for 30 min at low temperature (4 °C) to determine KA. Measurements were repeated in the presence of 10 mm ADP with 500 nm S1 and increasing actin concentrations (0–5 μm) to determine KDA. The supernatant was separated from the pellet at each actin concentration, and the pellets were resuspended in 100 μl of water. All samples were applied to a 10% SDS-polyacrylamide gel. The density of each protein band was quantified and used to determine the affinity of S1 for actin as described previously (14).
Homology Models
Homology models of the wild-type indirect flight muscle isoform (IFI) and the two point mutants S1A261T and S1G200D were built as described using SWISS-MODEL (19). When aligning the IFI myosin head sequence with class II scallop myosin, the sequence identity is 60 ± 1%, enabling us to build well resolved homology models (20). Crystal structures of the various states of scallop myosin during the cross-bridge cycle were chosen to generate three-dimensional homology models of IFI, S1A261T, and S1G200D: the near-rigor state of myosin (Protein Data Bank (PDB) code 1sr6), the post-rigor actin-detached state (PDB code 1kk8) that contains ADP·BeFx, the pre-powerstroke state (PDB code 1qvi) that contains ADP·VO4, and a novel conformation that contains partially bound ADP·SO4 (PDB code 1s5g). For regions of insertions or deletions in the target-template alignment, SWISS-MODEL constructs an ensemble of fragments compatible with the neighboring stems using constraint space programming or a loop library (20, 21).
RESULTS
Catalytic Activity Is Reduced for S1A261T and Increased for S1G200D
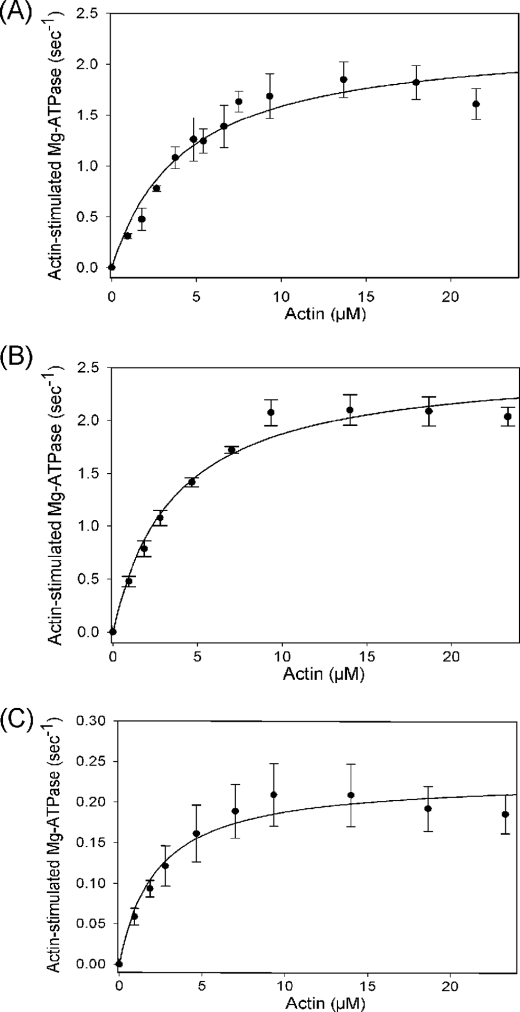
The basal and actin-activated Mg2+-ATPase activities of wild-type myosin S1 and the two point mutants (S1A261T and S1G200D) were measured (Fig. 2), and the results are summarized in Table 2. The TnI hdp2 suppressor mutant S1A261T showed a more than 2-fold reduction in basal Mg2+-ATPase activity (0.04 s−1), a nearly 3-fold reduction in basal Ca2+-ATPase (1.97 s−1), and a 10-fold reduction in Vmax (0.23 s−1) as compared with wild type (0.09, 5.33, and 2.54 s−1, respectively) (difference significance at <0.001 in each case). In contrast, the hdp2 enhancer mutant S1G200D showed nearly a 2-fold increase in basal Mg2+-ATPase (0.14 s−1) and no significant change in basal Ca2+-ATPase or Vmax.
FIGURE 2.
Actin-stimulated ATPase activity of wild-type IFI (A), S1G200D (B), and S1A261T (C). Basal Mg2+-ATPase and actin-stimulated Mg2+-ATPase data were obtained in the absence or in the presence of increasing concentrations of actin as described under “Experimental Procedures.” To obtain Km and Vmax, basal Mg-ATPase values were subtracted from actin-activated ATPase values, and data points were fit to a hyperbola. Statistical significance of data comparisons are shown in Table 2.
TABLE 2.
Steady-state kinetic parameters measured for wild-type, G200D and A261T Drosophila myosin S1
Values are mean ± S.D. based on a minimum of four preparations.
| Myosin S1 | Basal Ca-ATPase | Basal Mg-ATPase | Vmax | Km | Vmax/Km |
|---|---|---|---|---|---|
| s−1 | s−1 | s−1 | μm | μm−1s−1 | |
| Wild-type IFI | 5.33 ± 0.62 | 0.09 ± 0.01 | 2.54 ± 0.29 | 5.77 ± 0.83 | 0.45 ± 0.09 |
| S1G200D(Mhc5) | 5.36 ± 0.27 | 0.14 ± 0.01a | 2.60 ± 0.18 | 3.79 ± 0.67b | 0.70 ± 0.08b |
| S1A261T(D45) | 1.97 ± 0.46a | 0.04 ± 0.01a | 0.23 ± 0.04a | 2.15 ± 0.73a | 0.11 ± 0.02a |
a p < 0.001 determined by Student's t test as compared with IFI.
b p < 0.01 determined by Student's t test as compared with IFI.
The earlier ATPase measurements for full-length myosin (7) cannot be compared directly with the S1 ATPases described here because the two assays use different salt concentrations and the filamentous two-headed full-length myosin has a different affinity for actin than the soluble S1. However, the relative effects of the mutations on the S1 and the full-length myosin basal Mg2+-ATPases and the Vmax are similar (full-length myosin basal Mg2+-ATPase, 0.2, 0.48, and 0.11 s−1, and Vmax of 1.8, 1.5, and 0.69 s−1 for wild type, G200D, and A261T, respectively). The Km for actin with the S1 constructs of either S1A261T (Km = 2.15 μm) or S1G200D (Km = 3.79 μm) showed a decrease relative to wild type (Km = 5.77 μm), which was not seen previously with full-length myosin. The ratio Vmax/Km, referred to as the catalytic efficiency, shows a significant (p < 0.01) increase for S1G200D (0.70 μm−1s−1) as compared with wild type (0.45 μm−1s−1), whereas for S1A261T, this ratio decreases 4-fold (0.11 μm−1s−1, significance p < 0.001). Using flash photolysis, the turnover number (kcat) was measured at a fixed actin concentration (2 μm) for the point mutants S1G200D and S1A261T and compared with wild type (Fig. 3). The catalytic activity of S1A261T (kcat = 0.064 s−1) is reduced as compared with wild type (0.172 s−1), whereas kcat of S1G200D (0.210 s−1) is increased. This demonstrates that the differences seen in the lower ionic strength ATPase assay above remain at the higher salt concentrations (30 mm KCl) used for the transient kinetic measurements.
FIGURE 3.
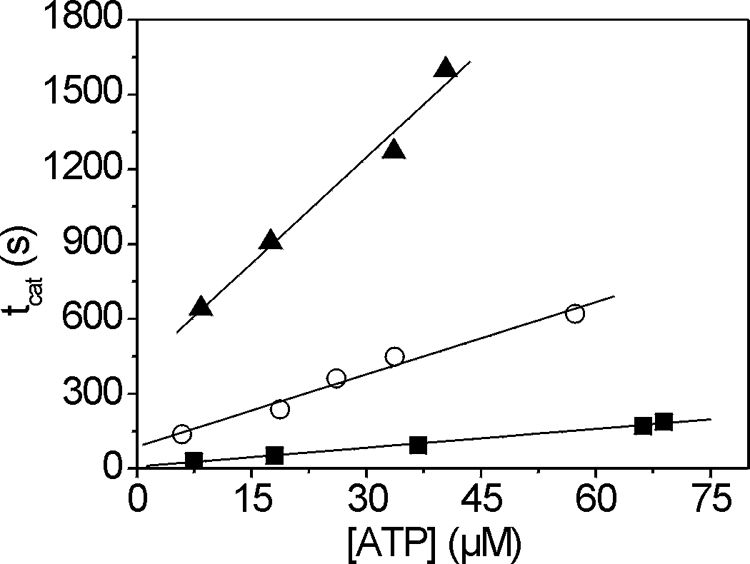
The turnover number (kcat) for actin·S1 of point mutants S1G200D and S1A261T as compared with wild-type IFI S1. Light-scattering transients monitoring dissociation of the acto-S1 complex (2 μm) and subsequent reassociation were measured using varying amounts of ATP. The time taken to hydrolyze all ATP (tcat) was linearly dependent upon the amount of released ATP. The steady-state rate of ATP hydrolysis can be determined from the inverse of the slope (steady-state rate = [ATP]/tcat), allowing the determination of the catalytic activity. The catalytic activity of S1A261T (0.064 s−1) (▴) is significantly reduced as compared with wild-type S1 (0.172 s−1) (○) and slightly increased for S1G200D (0.210 s−1) (■).
ATP-induced Dissociation of Actin·S1 Is Slower for S1A261T but Unaltered for S1G200D
The second-order rate constant governing the dissociation of acto-S1 by ATP (K1k+2: see Scheme 1) was measured as described previously (14). Briefly, 1 μm actin and 1–3 μm S1 were preincubated and then dissociated by ATP released from cATP. In the presence of apyrase, a single sample was subjected to a series of laser flashes decreasing in intensity to release varying concentrations of ATP. The rate of change in light scattering was recorded for each laser flash and could be well described by a single exponential at each ATP concentration (Fig. 4, A and B). The slope of a graph of kobs versus ATP concentration determines the apparent second-order rate constant K1k+2 for the dissociation of actin·S1 by ATP (Fig. 4C). As compared with the value for wild type (0.75 μm−1 s−1), S1A261T showed a reduced ATP-induced dissociation rate (0.47 μm−1s−1), whereas the rate measured for S1G200D (0.64 μm−1 s−1) was similar to wild type (Table 3).
FIGURE 4.
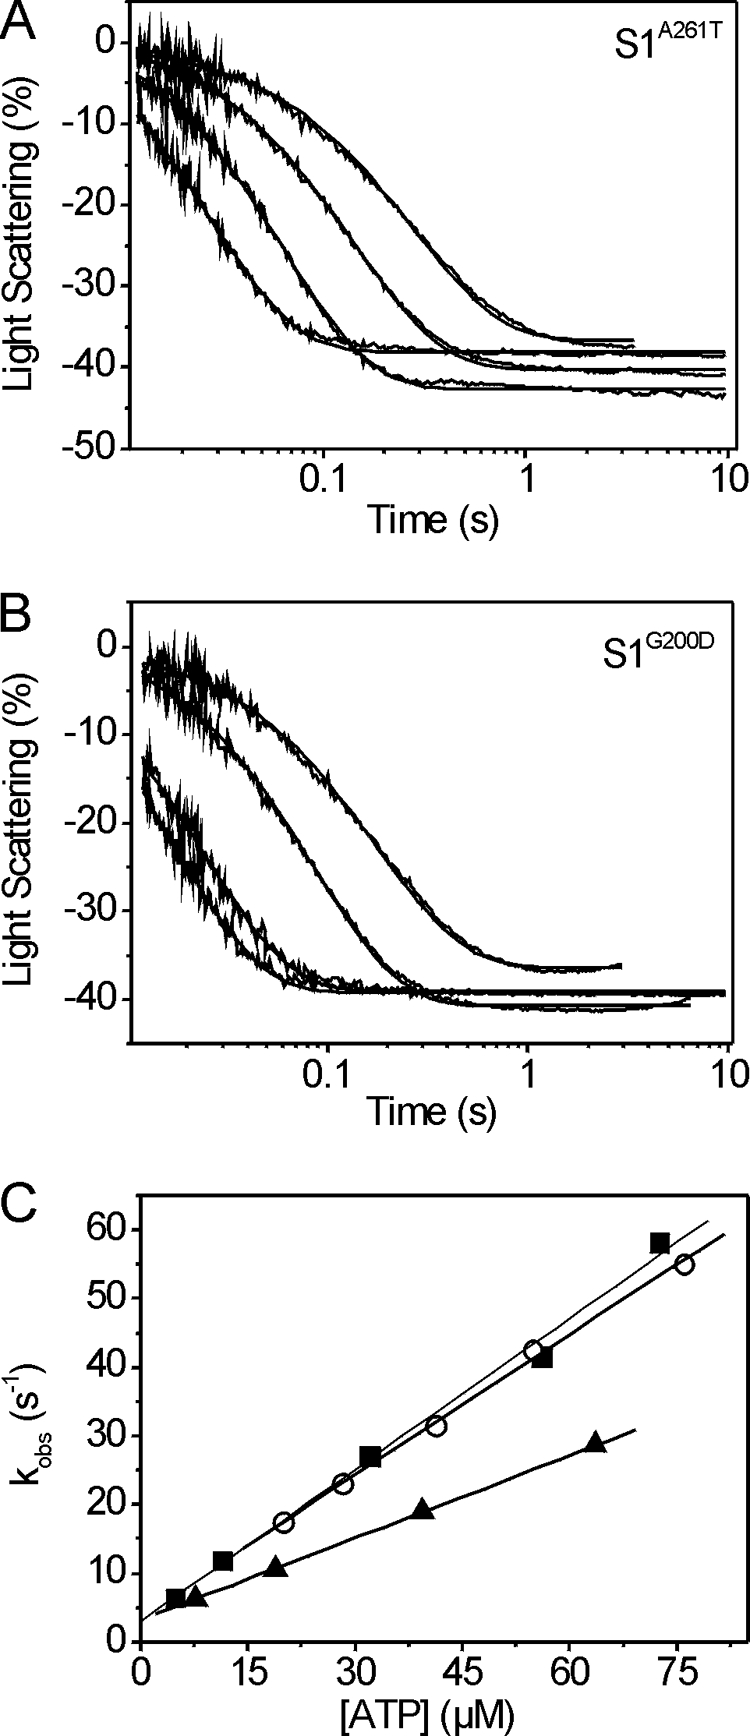
ATP-induced dissociation rate (K1k+2) of S1G200D and S1A261T. A and B, light-scattering transients monitoring dissociation of the actin·S1 complex (1 μm phalloidin-stabilized actin and 1–3 μm S1) after release of ATP from caged ATP. The traces measured for S1A261T (A) or S1G200D (B) were fitted with a single exponential at each ATP concentration to determine the kobs. C, the second-order rate constant for the dissociation of S1 from actin is determined from a linear fit to the plot of the kobs versus [ATP], resulting in values of 0.47 ± 0.08 μm−1 s−1 for S1A261T (▴) and 0.64 ± 0.09 μm−1s−1 for S1G200D (■) as compared with 0.75 ± 0.08 106 m−1 s−1 for wild-type IFI (○).
TABLE 3.
Transient kinetic parameters measured for wild-type, G200D and A261T Drosophila myosin S1
Values are mean ± S.D. based on a minimum of three preparations (two preparations in the case of KDA). K1k+2 is the second-order rate constant for ATP-induced dissociation of actin·S1. KD and KAD are ADP dissociation equilibrium constants. k−D and k−AD are the ADP dissociation rate constants in the absence and presence of actin, respectively (note that KD = k−D/k+D). KAD/KD is the thermodynamic coupling constant describing the relationship between actin and ADP affinities. KDA = actin affinity of S1·ADP.
| Myosin S1 | K1k+2 | KAD | k−ADa | k−D | KDb | KAD/KD | KDA |
|---|---|---|---|---|---|---|---|
| μm−1s−1 | μm | s−1 | s−1 | μm | nm | ||
| Wild-type IFI | 0.75 ± 0.08c | 409 ± 26c | 4090 | 7.5 ± 1.3c | 7.5 | 54 | 446 ± 125 |
| S1G200D(Mhc5) | 0.64 ± 0.09d | 604 ± 157d | 6040 | 71 ± 19e | 71 | 8.5 | 62 ± 12d |
| S1A261T(D45) | 0.47 ± 0.08e | 293 ± 61e | 2930 | 4.1 ± 0.3e | 4.1 | 71 | 684 ± 240d |
a Data are estimated from KAD assuming an association rate constant of 107 m−1 s−1.
b Data are estimated from k−D assuming an association rate constant of 106 m−1 s−1.
c Data are from Miller et al. (14).
d p < 0.05 determined by Student's t test as compared with IFI.
e p < 0.01 determined by Student's t test as compared with IFI.
Affinity of Actin·S1 for ADP Is Weak for S1G200D but Strong for S1A261T
The ADP affinity for S1 in the presence of actin, defined by the equilibrium dissociation constant KAD, was determined as described previously (14). In the presence of increasing concentrations of ADP, the ATP-induced dissociation of actin·S1 was measured using light scattering, and plotting the relative kobs (krel) versus ADP concentration allows the measurement of the ADP affinity KAD for actin·S1 (Fig. 5 and Scheme 1). The KAD of S1A261T (KAD = 293 μm) is reduced by almost 30% as compared with wild type (KAD = 409 μm), whereas for S1G200D, the KAD value is increased (KAD = 604 μm) (Fig. 5 and Table 3). Thus the ADP affinity of the two point mutants is affected in opposing ways with S1G200D having a weaker ADP affinity and S1A261T displaying a stronger ADP affinity as compared with wild type.
ADP Release from S1 (k−D) Is Fast for S1G200D but Slow for S1A261T
To estimate the rate constant of ADP dissociation from S1 in the absence of actin, the change in fluorescence of coumarin-labeled ADP (eda-deac-ADP) was measured upon displacement of eda-deac-ADP by ATP binding to S1. It was shown previously that this coumarin-labeled analog has very similar kinetic properties as compared with ADP (17). Measuring the ADP release rate (k−D) for wild type and S1A261T was relatively straightforward. A single laser flash released 15–20 μm ATP from cATP (100 μm), and the fluorescence change resulting from eda-deac-ADP release is well described by a single exponential function, as shown in Fig. 6A. The observed rate constant for ADP release (k−D = 4.1 s−1) was slower as compared with wild type (k−D = 7.3 s−1).
FIGURE 6.
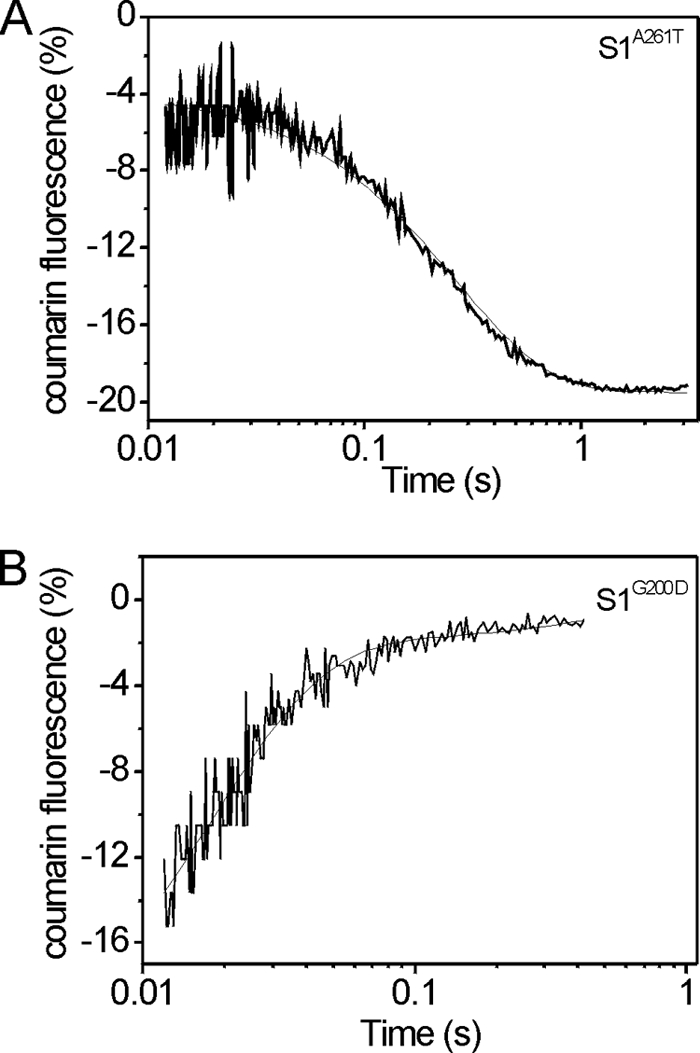
Rate of eda-deac-ADP dissociation (k−D) from Drosophila point mutant S1A261T (A) and S1G200D (B). A, fluorescence signal after releasing ATP (15 μm) from caged ATP (100 μm) by a single laser flash displacing the eda-deac-ADP bound to S1A261T. Fitting with a single exponential resulted in k−D = 4.1 ± 0.3 s−1. B, fluorescence signal after release of ADP (∼200 μm) from cADP (1000 μm) by a single laser flash displacing eda-deac-ADP from S1G200D. Fitting with a single exponential resulted in k−D = 71 ± 19 s−1.
For S1G200D, a different approach was needed because it was noted that the fluorescence signal of the sample containing S1G200D increased on adding cATP, indicating that cATP could displace eda-deac-ADP for this mutant. This displacement of eda-deac-ADP by cATP was not seen for wild-type S1, indicating that the ADP affinity of S1G200D is much weaker. Using cADP instead of cATP to displace eda-deac-ADP from S1 resolved this problem because cADP has a much weaker affinity for myosin S1 (22). No fluorescence signal change was observed when adding cADP to S1 (incubated with eda-deac-ADP) prior to applying the laser flash. However, after release of ADP (∼200 μm) from cADP (1000 μm), the eda-deac-ADP fluorescence increased on displacement (Fig. 6B) with a nearly 10-fold increase in rate constant for ADP release from S1G200D (k−D = 71 s−1) as compared with wild type.
With S1A261T, the eda-deac-ADP fluorescence decreased on displacement by ATP, which is the same direction as for wild type and for other Drosophila myosin isoforms, such as embryonic myosin S1 (EMB) (14, 15). The results with S1G200D showed a fluorescence increase upon eda-deac-ADP displacement, as was found previously for the Drosophila chimeric constructs EMB-7d/7a and IFI-7a (19) and EMB-9a and IFI-9b (15). Similar variation in the direction of fluorescence changes has been observed previously with vertebrate and Dictyostelium S1 isoforms (22), and no correlation was found between the direction of the fluorescence change and the affinity of the analog for S1. The variation in signal direction reflects differences in the local environment of the protein-bound fluorophore; therefore the G200D mutation does change the local environment sensed by the coumarin fluorophore.
Affinity of S1 for Actin in the Presence of ADP Is Weak for S1A261T but Strong for S1G200D
The measurement of the affinity of S1 and actin·S1 for ADP (KDand KAD) allows us to calculate the thermodynamic coupling constant (KAD/KD) for the interaction between the actin and ADP sites on S1. This ratio of two independent values carries a large error and includes the assumption that k+AD has the same value for all constructs. The values listed in Table 3 are shown for illustration, acknowledging the error. The numbers do show a 6-fold reduction for G200D in the coupling (from 54 for wild type to 8.5 for the mutation). In contrast, A261T has a 30% increase in coupling (KAD/KD = 71), which is not very different from the 20% error of the KAD value. Here we can use the values to predict the effect of ADP on the affinity of S1 for actin for the two mutants. In our earlier work (14), we estimated that the affinity of wild-type S1 for actin (KA) was ≤10 nm. Assuming that the affinity of S1 for actin remains very tight and is relatively little affected by mutations that are remote from the actin binding site, then KDA can be estimated from KAD/KD = KDA/KA, where KDA is the affinity of S1 for actin in the presence of ADP. This estimates KDA as ≤540 nm for wild type and ≤710 and 85 nm for A261T and G200D, respectively. Using the co-sedimentation assay of Miller et al. (14), we found that the affinity of S1 for actin did remain very tight for the mutant S1s. The value of KDA was measured as shown in Fig. 7, giving values of 446 nm for wild type, a weaker affinity of 684 nm for A261T, and a significantly tighter affinity of 62 nm for G200D (Table 3). Although the precision of these measurements is not high for this type of assay, the values are in line with the predictions.
FIGURE 7.
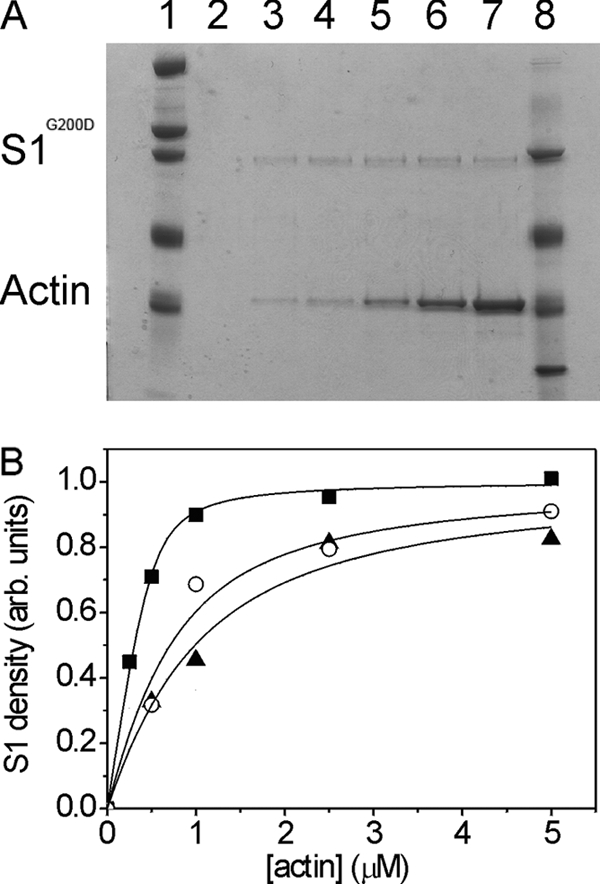
Determination of actin affinity in the presence of ADP (24). The affinity of S1 for actin was characterized with the co-sedimentation method (see “Experimental Procedures”). A, representative SDS-polyacrylamide gel of the pellets from experiments where S1G200D (100 nm) was mixed with various actin concentrations (0, 0.25, 0.5, 1.0, 2.5, and 5 μm (lanes 2, 3, 4, 5, 6, and 7, respectively)) in the presence of ADP (10 mm). Lanes 1 and 8 contain molecular weight markers. B, the densities of the myosin S1 bands as a function of [actin] shown for wild-type IFI (○) and the two point mutants S1G200D (■) and S1A261T (▴). The fits for these samples gave a value of KDA = 62 nm (S1G200D), KDA = 684 nm (S1A261T), and KDA = 446 nm (IFI-WT). arb. units, arbitrary units.
Homology Models Suggest a Role for Loop 1
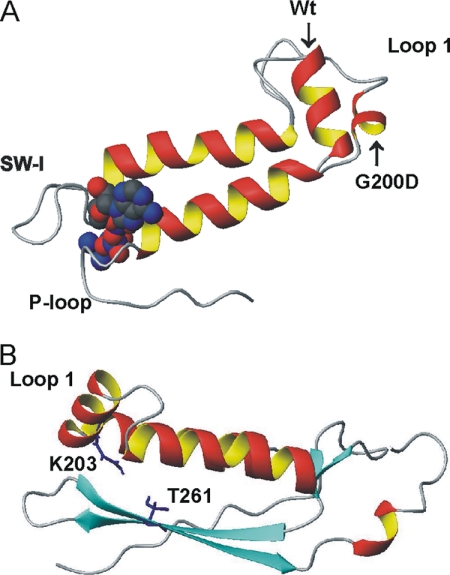
Homology models were built of wild type and mutants S1G200D and S1A261T to help understand the mechanism of action of the mutated residues. Fig. 8 shows part of the transducer area of the homology structures representing the pre-powerstroke state, and in particular, loop 1. The model of S1A261T suggests a helical structure for loop 1 (panel B), as is also found in the homology model for wild type (panel A). For S1A261T, however, the model indicates a possible hydrogen bond between the side chains of Thr261 and the conserved loop 1 residue Lys203 (which is absent in wild-type S1, which has Ala261). This interaction could affect the flexibility of loop 1, resulting in a more stable loop 1 structure and thus slower nucleotide binding or release from the nucleotide binding pocket. For S1G200D, the homology model suggests a less ordered loop 1 structure as compared with wild type (panel A), enhancing its flexibility, which ultimately could affect nucleotide exchange. For the other conformational states, the differences between the three constructs are less profound. For the rigor state, the models predict a disordered loop 1 for all three S1s. For the post-rigor state, loop 1 is predicted to contain a small helix, with S1A261T being the longest (three turns) and S1G200D the shortest (one turn) (not shown).
FIGURE 8.
Homology models of S1G200D (A) and S1A261T (B) suggest a role for loop 1. A, overlay of the loop 1 area of homology models of wild-type S1 (Wt) and S1G200D (built using pre-powerstroke scallop myosin (PDB code 1qvi) as template) showing a helical structure of loop 1 for wild type, which is disrupted in S1G200D. The bound nucleotide is shown as solid spheres, and switch 1 (SW-1) and the phosphate binding loop (P-loop) are also indicated. B, loop 1 area of S1A261T shows a wild type-like helical structure for loop 1. The conserved loop 1 residue Lys203 can interact with Thr261, which is located on β7. The altered structure of loop 1 may affect its flexibility and ultimately change ADP release rate for the mutants, with faster release for S1G200D (less ordered loop 1 structure) and slower release for S1A261T (more rigid loop 1 structure).
DISCUSSION
We investigated the steady-state and transient kinetics of two transducer mutant myosin S1 fragments that 1) yield normal morphology (A261T) or hypercontraction (G200D) in the IFM (2, 8); 2) can suppress (A261T) or enhance (G200D) the hypercontraction phenotype caused by a troponin I defect (TnI-A116V); and 3) can also induce specific phenotypes in the Drosophila heart (7). This is summarized in Table 1. The data show that the two point mutations have an opposite effect on the enzymatic activity of the S1 as compared with wild type. S1A261T is less active (reduced basal ATPase and Vmax/Km, higher ADP affinity for S1 (KD) and actin·S1 (KAD), and reduced ATP-induced dissociation of actin·S1 (K1k+2)), whereas S1G200D shows an increase in enzymatic activity (enhanced basal ATPase and Vmax/Km and reduced ADP affinity for both S1 (KD) and actin·S1 (KAD)). These results agree with and substantially extend previous work on the same mutations in full-length myosin (7). By defining the biochemical parameters that differ between the two transducer mutants, our results provide new insights into the molecular mechanisms that cause different phenotypes for these mutants on their own and in combination with the held-up2 TnI mutation.
There is an emerging consensus that in the case of HCM (of which RCM is a subset), mutant contractile proteins result in increased contractility or motor function and are usually associated with an increase in the calcium sensitivity of contraction. In contrast, mutations that result in DCM yield decreased contractility or motor function that is often associated with a decrease in calcium sensitivity (9, 23–27). Our results are consistent with the induced cardiac phenotypes because actin·S1A261T has decreased activity and results in a DCM phenotype (dilated), whereas actin·S1G200D results in increased activity, and this mutation causes an RCM phenotype (restrictive). Our data also show for the first time that the affinity of S1·ADP for actin is affected in opposite ways with the RCM mutant having very tight actin affinity and the DCM mutant showing weaker actin affinity as compared with wild type. Because these particular mutations affect the transducer region, which provides a communication pathway between the actin and nucleotide binding sites (11), the changes in transducer structure might be predicted to have effects on the actin affinity of S1 in the presence of ADP. However, note that although residues Ala261 and Gly200 and the transducer region are common to both the cardiac and the IFI myosin isoforms, there are differences in other domains of the myosin head between the IFI and cardiac myosin isoforms (28). Thus the IFI isoform can model the heart isoforms, but is not identical.
Can our results help explain the interaction between the mutant myosins characterized here and the TnI held-up2 mutation? The regulation of muscle contraction by troponin relies, at one level, on a competition between TnI and myosin for binding sites on actin. In the absence of calcium, TnI binds actin more tightly than myosin; in the presence of calcium, the TnI interaction is weakened, and now myosin binds more tightly. In vitro motility assays of regulated thin filaments showed that the hdp2 mutant troponin I caused activation of motility at lower calcium concentrations than wild type (29, 30). If the held-up2 phenotype is caused by the A116V TnI mutation weakening the inhibitory interaction of TnI with actin, then a mutation in myosin that weakens its interaction with actin could bring the two affinities back into balance. The AM·ADP complex is expected to be a significant force-holding state in the cross-bridge cycle. Alterations in the affinity of AM·ADP for actin could alter the ability of the AM·ADP state to compete with TnI for binding to actin. Our estimate of KDA for S1A261T (weaker actin binding than wild-type IFI) is consistent with this prediction and with this mutation operating as a suppressor of the held-up2 phenotype. In contrast, S1G200D has a higher affinity of S1·ADP for actin, and the G200D mutation is expected to be able to activate more readily than wild-type myosin. In addition to the direct effect of competition between TnI and myosin, a more strongly bound myosin would, through the cooperativity in the thin filament, enhance the affinity of the Tn complex for calcium (31). This, in combination with held-up2, will result in activation at very low calcium concentrations. This can explain the lethality observed when these two mutations are placed within the same organism, where muscles essential for viability are constitutively activated. These characteristics of the G200D activating more readily and A261T activating less well are also consistent with alterations in calcium sensitivity associated with the DCM and RCM cardiac defects.
Another characteristic change produced in myosin by the two mutations is the change in the in vitro motility. The velocity was enhanced by 16% for G200D and reduced by 55% for A261T (7). The velocity at which myosin moves actin in a motility assay and the maximum speed of muscle fiber shortening are normally considered to be limited by the rate constant for cross-bridge detachment after completion of the working stroke (32–34). For fast myosins, cross-bridge detachment is usually limited by ATP binding, whereas for slower myosins, ADP release is rate-limiting. However, for Drosophila IFM fibers at saturating ATP (20 mm), the rate-limiting step of fiber shortening is inorganic phosphate release (35). Because IFM fibers have a very weak affinity for ATP, at the ATP concentration used for the motility assays (2 mm), ATP binding could be rate-limiting instead of phosphate release. However, in vitro motility data are collected under unloaded conditions, whereas fiber data represent loaded conditions, which could result in different rate-limiting steps. For the IFM, as for fast mammalian muscle, the ADP release is expected to be much too fast to limit the velocity, and this remains true for the two mutant myosins. Here we report that the second-order rate constant (K1k+2) for ATP-induced dissociation of actin·S1A261T is reduced to about 60% of the value of the IFI. This is similar to the 55% reduction in the velocity of in vitro motility assays. In contrast, there is no significant difference between the rate constant for ATP-induced dissociation of actin·S1G200D and wild type and only a 16% difference in the in vitro motility velocity.
The homology models suggest a possible loop 1-based mechanism for how the two mutations affect myosin kinetics in opposite ways. The rate constant of ADP release (k−AD and hence KAD) has been correlated with the size and flexibility of loop 1, with the larger and more flexible loops giving higher release rate constants (36). Loop 1 is also one of the key players in transducer region function, and its importance has been emphasized by Houdusse and co-workers (11) who called the transducer region “loop 1 tuning elements.” Although the surface loop 1 is not usually seen in myosin crystal structures because of its inherent flexibility, our homology models do predict differences in the apparent flexibility of the loop in the three myosins. For wild type, going from near-rigor to post-rigor to pre-powerstroke states, the models predict an increase in the probability of a helical structure, implying less flexibility for the loop in the pre-powerstroke state. A similar trend is seen for the three structures of each of the two mutants, with A261T tending to have more helix in loop 1 in each case and G200D less. The models suggest that for wild-type myosin in the most stable (pre-powerstroke) state, loop 1 is largely an α-helix that starts at Gly200. For S1G200D, the introduction of the larger Asp side chain appears to disrupt the start of the helical structure, resulting in a more flexible loop that may lead to faster ADP release rates. In the case of S1A261T, loop 1 may become less flexible due to the interaction between Lys203 (in loop 1) and Thr261, resulting in slower ADP release.
In summary, this study of the two myosin point mutations reveals characteristics that are compatible with the observed IFM and cardiac phenotypes. In addition, the changes in the two mutant S1s provide an explanation of the ability of A261T to suppress the held-up2 phenotype as well as the lethality of the G200D mutation in combination with held-up2. The opposing biochemical defects we uncovered provide insight into how mutations within the same gene can result in disparate mutant muscle phenotypes.
Acknowledgments
We acknowledge the excellent technical assistance of Anju Melkani (myosin preparation) and Sam Lynn (co-sedimentation). We thank Dr. A. Cammarato for reading the manuscript and providing comments.
This work was supported, in whole or in part, by National Institutes of Health Research Grant GM32443 (to G. C. M., C. M. D., and S. I. B.). This work was also supported by Wellcome Trust Program Grant 085309 (to M. A. G. and M. J. B.).
The two mutants used throughout this study are: Mhc5, which indicates the myosin heavy chain mutation G200D; and D45, which indicates the myosin heavy chain mutation A261T.
- DCM
- dilated cardiomyopathy
- HCM
- hypertrophic cardiomyopathy
- RCM
- restrictive cardiomyopathy
- S1
- myosin subfragment 1
- actin·S1
- actomyosin subfragment 1
- cATP
- caged ATP
- cADP
- caged ADP
- eda-deac-ATP
- 3′-O-{N-[2-(7-diethylamino-coumarin-3-carboxamido)ethyl]carbamoyl}-ATP
- eda-deac-ADP
- 3′-O-{N-[2-(7-diethylamino-coumarin-3-carboxamido)ethyl]carbamoyl}-ADP
- IFI
- indirect flight muscle isoform
- IFM
- indirect flight muscle
- Tn
- troponin
- TnI
- troponin I
- EMB
- embryonic myosin S1.
REFERENCES
- 1. Odronitz F., Kollmar M. (2007) Genome Biol. 8, R196. [DOI] [PMC free article] [PubMed] [Google Scholar]
- 2. O'Connell C. B., Tyska M. J., Mooseker M. S. (2007) Biochim. Biophys. Acta 1773, 615–630 [DOI] [PubMed] [Google Scholar]
- 3. Geeves M. A., Fedorov R., Manstein D. J. (2005) Cell. Mol. Life Sci. 62, 1462–1477 [DOI] [PMC free article] [PubMed] [Google Scholar]
- 4. Seidman J. G., Seidman C. (2001) Cell 104, 557–567 [DOI] [PubMed] [Google Scholar]
- 5. Wolf M. J., Amrein H., Izatt J. A., Choma M. A., Reedy M. C., Rockman H. A. (2006) Proc. Natl. Acad. Sci. U.S.A. 103, 1394–1399 [DOI] [PMC free article] [PubMed] [Google Scholar]
- 6. Ocorr K. A., Crawley T., Gibson G., Bodmer R. (2007) PLoS One 2, e601. [DOI] [PMC free article] [PubMed] [Google Scholar]
- 7. Cammarato A., Dambacher C. M., Knowles A. F., Kronert W. A., Bodmer R., Ocorr K., Bernstein S. I. (2008) Mol. Biol. Cell 19, 553–562 [DOI] [PMC free article] [PubMed] [Google Scholar]
- 8. Kronert W. A., Acebes A., Ferrús A., Bernstein S. I. (1999) J. Cell Biol. 144, 989–1000 [DOI] [PMC free article] [PubMed] [Google Scholar]
- 9. Robinson P., Griffiths P. J., Watkins H., Redwood C. S. (2007) Circ. Res. 101, 1266–1273 [DOI] [PubMed] [Google Scholar]
- 10. Dweck D., Hus N., Potter J. D. (2008) J. Biol. Chem. 283, 33119–33128 [DOI] [PMC free article] [PubMed] [Google Scholar]
- 11. Coureux P. D., Sweeney H. L., Houdusse A. (2004) EMBO J. 23, 4527–4537 [DOI] [PMC free article] [PubMed] [Google Scholar]
- 12. Swank D. M., Knowles A. F., Kronert W. A., Suggs J. A., Morrill G. E., Nikkhoy M., Manipon G. G., Bernstein S. I. (2003) J. Biol. Chem. 278, 17475–17482 [DOI] [PubMed] [Google Scholar]
- 13. Nanni L., Pieroni M., Chimenti C., Simionati B., Zimbello R., Maseri A., Frustaci A., Lanfranchi G. (2003) Biochem. Biophys. Res. Commun. 309, 391–398 [DOI] [PubMed] [Google Scholar]
- 14. Miller B. M., Nyitrai M., Bernstein S. I., Geeves M. A. (2003) J. Biol. Chem. 278, 50293–50300 [DOI] [PubMed] [Google Scholar]
- 15. Bloemink M. J., Dambacher C. M., Knowles A. F., Melkani G. C., Geeves M. A., Bernstein S. I. (2009) J. Mol. Biol. 389, 707–721 [DOI] [PMC free article] [PubMed] [Google Scholar]
- 16. Webb M. R., Reid G. P., Munasinghe V. R., Corrie J. E. (2004) Biochemistry 43, 14463–14471 [DOI] [PubMed] [Google Scholar]
- 17. Webb M. R., Corrie J. E. T. (2001) Biophys. J. 81, 1562–1569 [DOI] [PMC free article] [PubMed] [Google Scholar]
- 18. Weiss S., Chizhov I., Geeves M. A. (2000) J. Muscle Res. Cell Motil. 21, 423–432 [DOI] [PubMed] [Google Scholar]
- 19. Miller B. M., Bloemink M. J., Nyitrai M., Bernstein S. I., Geeves M. A. (2007) J. Mol. Biol. 368, 1051–1066 [DOI] [PMC free article] [PubMed] [Google Scholar]
- 20. Arnold K., Bordoli L., Kopp J., Schwede T. (2006) Bioinformatics 22, 195–201 [DOI] [PubMed] [Google Scholar]
- 21. Schwede T., Kopp J., Guex N., Peitsch M. C. (2003) Nucleic Acids Res. 31, 3381–3385 [DOI] [PMC free article] [PubMed] [Google Scholar]
- 22. Clark R. J., Nyitrai M., Webb M. R., Geeves M. A. (2003) J. Muscle Res. Cell Motil. 24, 315–321 [PubMed] [Google Scholar]
- 23. Schmitt J. P., Debold E. P., Ahmad F., Armstrong A., Frederico A., Conner D. A., Mende U., Lohse M. J., Warshaw D., Seidman C. E., Seidman J. G. (2006) Proc. Natl. Acad. Sci. U.S.A. 103, 14525–14530 [DOI] [PMC free article] [PubMed] [Google Scholar]
- 24. Lakdawala N. K., Dellefave L., Redwood C. S., Sparks E., Cirino A. L., Depalma S., Colan S. D., Funke B., Zimmerman R. S., Robinson P., Watkins H., Seidman C. E., Seidman J. G., McNally E. M., Ho C. Y. (2010) J. Am. Coll. Cardiol. 55, 320–329 [DOI] [PMC free article] [PubMed] [Google Scholar]
- 25. Marston S. B. (2011) J. Cardiovasc. Transl. Res. 4, 245–255 [DOI] [PubMed] [Google Scholar]
- 26. Palmer B. M., Fishbaugher D. E., Schmitt J. P., Wang Y., Alpert N. R., Seidman C. E., Seidman J. G., VanBuren P., Maughan D. W. (2004) Am. J. Physiol. Heart Circ. Physiol. 287, H91–H99 [DOI] [PubMed] [Google Scholar]
- 27. Debold E. P., Schmitt J. P., Patlak J. B., Beck S. E., Moore J. R., Seidman J. G., Seidman C., Warshaw D. M. (2007) Am. J. Physiol. Heart Circ. Physiol. 293, H284–H291 [DOI] [PubMed] [Google Scholar]
- 28. Cammarato A., Ahrens C. H., Alayari N. N., Qeli E., Rucker J., Reedy M. C., Zmasek C. M., Gucek M., Cole R. N., Van Eyk J. E., Bodmer R., O'Rourke B., Bernstein S. I., Foster D. B. (2011) PLoS ONE 6, e18497. [DOI] [PMC free article] [PubMed] [Google Scholar]
- 29. Vikhorev P. G., Vikhoreva N. N., Cammarato A., Sparrow J. C. (2010) J. Muscle Res. Cell Motil. 31, 171–179 [DOI] [PubMed] [Google Scholar]
- 30. Lin N., Badie N., Yu L., Abraham D., Cheng H., Bursac N., Rockman H. A., Wolf M. J. (2011) Circ. Res. 108, 1306–1315 [DOI] [PMC free article] [PubMed] [Google Scholar]
- 31. Gordon A. M., Homsher E., Regnier M. (2000) Physiol. Rev. 80, 853–924 [DOI] [PubMed] [Google Scholar]
- 32. Siemankowski R. F., Wiseman M. O., White H. D. (1985) Proc. Natl. Acad. Sci. U.S.A. 82, 658–662 [DOI] [PMC free article] [PubMed] [Google Scholar]
- 33. Nyitrai M., Rossi R., Adamek N., Pellegrino M. A., Bottinelli R., Geeves M. A. (2006) J. Mol. Biol. 355, 432–442 [DOI] [PubMed] [Google Scholar]
- 34. Baker J. E., Brosseau C., Joel P. B., Warshaw D. M. (2002) Biophys. J. 82, 2134–2147 [DOI] [PMC free article] [PubMed] [Google Scholar]
- 35. Swank D. M., Vishnudas V. K., Maughan D. W. (2006) Proc. Natl. Acad. Sci. U.S.A. 103, 17543–17547 [DOI] [PMC free article] [PubMed] [Google Scholar]
- 36. Sweeney H. L., Rosenfeld S. S., Brown F., Faust L., Smith J., Xing J., Stein L. A., Sellers J. R. (1998) J. Biol. Chem. 273, 6262–6270 [DOI] [PubMed] [Google Scholar]


