Abstract
We combine bifurcation analysis with the theory of canard-induced mixed mode oscillations to investigate the dynamics of a novel form of bursting. This bursting oscillation, which arises from a model of the electrical activity of a pituitary cell, is characterized by small impulses or spikes riding on top of an elevated voltage plateau. Oscillations with these characteristics have been called “pseudo-plateau bursting”. Unlike standard bursting, the subsystem of fast variables does not posses a stable branch of periodic spiking solutions, and in the case studied here the standard fast/slow analysis provides little information about the underlying dynamics. We demonstrate that the bursting is actually a canard-induced mixed mode oscillation, and use canard theory to characterize the dynamics of the oscillation. We also use bifurcation analysis of the full system of equations to extend the results of the singular analysis to the physiological regime. This demonstrates that the combination of these two analysis techniques can be a powerful tool for understanding the pseudo-plateau bursting oscillations that arise in electrically excitable pituitary cells and isolated pancreatic β-cells.
2 Introduction
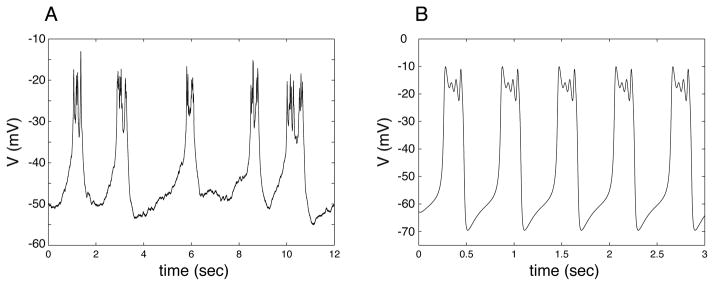
Electrical bursting is characterized by episodes of electrical impulses followed by periods of quiescence during which the cell is repolarized. These oscillations are often observed in nerve and endocrine cells, and have been the focus of mathematical modeling and analysis. Many hormone-secreting cells in the anterior pituitary gland, such as lactotrophs, somatotrophs, and corticotrophs, exhibit fast bursting with small spikes arising from an elevated or depolarized voltage (Kuryshev et al., 1996; Van Goor et al., 2001). Single pancreatic β-cells, isolated from islets, exhibit a similar type of bursting pattern (Kinard et al., 1999). Figure 1A shows an example from a pituitary lactotroph cell line (GH4 cell). Mathematical models for bursting in lactotrophs (Tabak et al., 2007; Toporikova et al., 2008), somatotrophs (Tsaneva-Atanasova et al., 2007), corticotrophs (LeBeau et al., 1998; Shorten et al., 2000), and single β-cells (Zhang et al., 2003) have been developed and analyzed. This type of bursting, called “pseudo-plateau” bursting, is quite different from that of most neurons and neuron models, as discussed in Stern et al. (2008).
Figure 1.
(A) Perforated patch electrical recording of bursting in a GH4 pituitary cell line. (B) Bursting produced by the model with the default parameters shown in Table 1, with C = 6 pF, gK = 4.4 nS, and gA = 18 nS.
We recently described a model that is unlike other models of pseudo-plateau bursting in that the bursting persists almost unaltered when the variable for the intracellular Ca2+ concentration is fixed or eliminated (Toporikova et al., 2008). This is unusual, since the slow variation of the intracellular Ca2+ concentration is typically responsible for clustering impulses into periodic episodes of activity. Previously, we analyzed some of the properties of this unusal form of bursting (Toporikova et al., 2008). In the current article we extend this in two ways. First, we show how the bursting is situated in parameter space relative to other types of behaviors, and demonstrate how the number of spikes per burst varies in parameter space. Second, we take advantage of the different time scales within this model to analyze the mechanism for the bursting. We show that the bursting is actually a canard-induced mixed mode oscillation (MMO) where a MMO pattern corresponds to a switching between small-amplitude oscillations and relaxation oscillations. Using geometric singular perturbation analysis (Fenichel, 1979; Jones, 1995; Wechselberger, 2005; Brons et al., 2006), we demonstrate the origin of the MMO, identify the region in parameter space where the MMO exists, and show how the number of small amplitude oscillations (or spikes) varies in parameter space. In so doing, we identify the mechanism for this type of pseudo-plateau bursting, and also perform analyses at the singular limit to explain behaviors seen away from this limit. Mixed mode oscillations have been described previously for neural models and data (Erchova and McGonigle, 2008; Wechselberger, 2005; Rubin and Wechselberger, 2007; Rotstein et al., 2008; Ermentrout and Wechselberger, 2009; Drover et al., 2005; Brons et al., 2008; Krupa et al., 2008; Guckenheimer et al., 1997), but this is the first example where the MMOs form bursting oscillations.
3 The Mathematical Model
The model is a minimal description of the electrical activity and Ca2+ dynamics in a pituitary lactotroph (Toporikova et al., 2008). This is based on another model (Tabak et al., 2007), which produces bursting over a range of parameter values. For much of this range the bursting is driven by slow activity-dependent variation in the Ca2+ concentration. However, for a subset of this range the Ca2+ concentration can be clamped and bursting persists. In the model by Toporikova et al. this latter form of bursting was examined, and the Ca2+ variable removed, since variation in Ca2+ was not necessary to produce the bursting. This is the model we use here.
The model includes variables for the membrane potential (V) of the cell, the fraction of activated K+ channels of the delayed rectifier type (n), and the fraction of A-type K+ channels that are not inactivated (e). The differential equations are
| (3.1) |
| (3.2) |
| (3.3) |
where ICa is an inward Ca2+ current and all other currents are outward K+ currents. IK is a delayed rectifier current, IA is an A-type current that inactivates when V is elevated, and IL is a constant-conductance current that replaces the Ca2+-activated K+ current in the lactotroph model of Tabak et al. (2007). The ionic currents are given by
| (3.4) |
| (3.5) |
| (3.6) |
| (3.7) |
The activation of the Ca2+ current and the A-type K+ current is very fast, and is modeled as instantaneous, with steady-state activation functions m∞(V) and a∞(V). Mathematically, this can be justified by a center-manifold reduction (Rubin and Wechselberger, 2007). The delayed rectifier current activates more slowly, with activation dynamics given by Eq. 3.3, and the A-type current also inactivates relatively slowly, with inactivation dynamics given by Eq. 3.2. Without IA this is just the well-known Morris-Lecar model (Morris and Lecar, 1981), a minimal biophysical model for membrane excitability that is capable of producing impulses, but not bursts of impulses.
Steady state activation functions have the form
| (3.8) |
for x = m, n, a, while the inactivation function is
| (3.9) |
System parameters are: time constants (τn and τe), membrane capacitance C, current conductances (gCa, gK, gA, gL), Nernst potentials (VCa and VK), and shape parameters for the steady state functions (Vm, Vn, Va, Ve, sm, sn, sa, se). Values are given in Table 1.
Table 1.
Parameter values used in the model
| Parameter | Value | Definition |
|---|---|---|
| C | 0 – 20 pF | Membrane Capacitance |
| gK | 0 – 10 nS | Maximal conductance of delayed rectifier K+ channels |
| gA | 0 – 25 nS | Maximal conductance of A-type K+ channels |
|
| ||
| gCa | 2 nS | Maximal conductance of Ca2+ channels |
| VCa | 50 mV | Reversal potential for Ca2+ |
| Vm | −20 mV | Voltage value at midpoint of m∞ |
| sm | 12 mV | Slope parameter of m∞ |
| VK | −75 mV | Reversal potential for K+ |
| Vn | −5 mV | Voltage value at midpoint of n∞ |
| sn | 10 mV | Slope parameter of n∞ |
| τn | 40 ms | Time constant for n |
| Va | −20 mV | Voltage value at midpoint of a∞ |
| sa | 10 mV | Slope parameter of a∞ |
| Ve | −60 mV | Voltage value at midpoint of e∞ |
| se | 5 mV | Slope parameter of e∞ |
| gL | 0.3 nS | Maximal conductance of leak current |
| τe | 20 ms | Time constant of e |
Numerical simulations were performed with the fourth-order Runge-Kutta integration method, as implemented in the XPPAUT software package (Ermentrout, 2002). Computer codes are freely available online at www.math.fsu.edu/~bertram/software/pituitary. Bifurcation diagrams and phase portraits of the singular perturbation analysis were also computed using XPPAUT. All graphics were produced with the software package MAT-LAB.
Figure 1B shows bursting oscillations produced by the model. Notice the small spikes that occur on top of a depolarized voltage plateau, which is characteristic of the bursting that often occurs in lactotrophs, somatotrophs, corticotrophs, and isolated β-cells. The bursting in the GH4 cell is very noisy, which is typical of pituitary bursting. In contrast, the model is deterministic, and thus the bursting is much more regular.
The three model variables vary on different time scales. The time scale for variation in V (τV) can be estimated by the ratio of the model cell capacitance C to the maximum ion channel conductance, gmax = max{gCa, gK, gA, gL} (more precisely, one uses dimensional analysis to identify the different time scales; see later). In most of our analysis and simulations, C = 2 pF and gmax > 2 nS. Thus, τV = C/gmax < 1 ms. (The capacitance value chosen is intermediate between the more common 5 pF of somatotrophs or 6 pF of lactotrophs and the singular limit. We later vary C to investigate how the behavior changes with changes in capacitance.) The time constants for the other variables are given explicitly as model parameters: τe = 20 ms and τn = 40 ms. Thus, the V variable changes rapidly and the e and n variables change on slower time scales. We take advantage of this separation of time scales, and increase the disparity further by reducing C, when we apply geometric singular perturbation analysis to the system.
4 Pseudo-Plateau Bursting Boundaries in Parameter Space
Our goals here are to determine how pseudo-plateau bursting relates to other states of the system such as tonic firing (spiking) or an equilibrium state (either hyperpolarized or depolarized) by changing three key model parameters, and to determine how the number of spikes within a bursting pattern varies with parameters. The three parameters that we vary are the maximum conductances of the delayed rectifier (gK) and A-type K+ currents (gA), and the capacitance (C). The first parameter, gK, was chosen since it controls the number of spikes per burst (as we discuss later). The second parameter, gA, was varied in our previous analysis, where we showed that the A-type current is crucial for the bursting (Toporikova et al., 2008). The third parameter, C, sets the time scale for voltage (τV = C/gmax), as discussed in the previous section. Decreasing C reduces τV and widens the separation of time scales between V and the slower variables n and e.
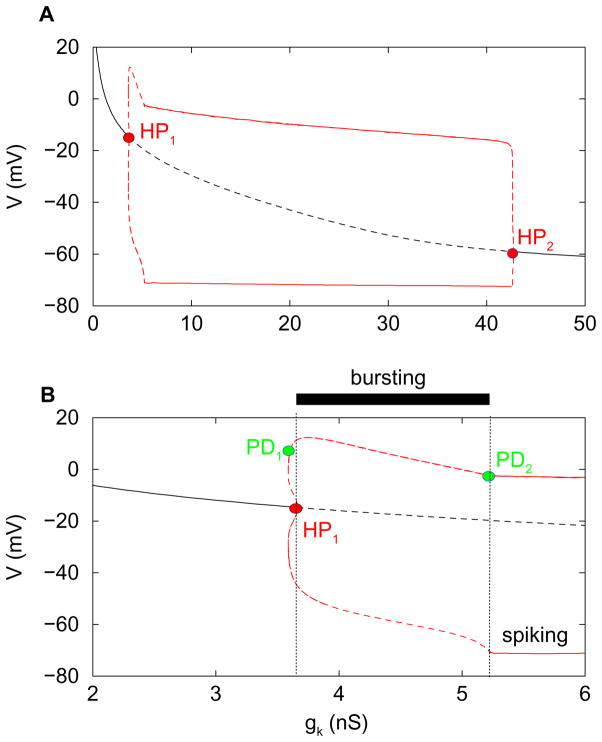
We begin by treating gK as the bifurcation parameter, keeping the other two parameters fixed at gA = 2 nS and C = 2 pF. Figure 2A is a bifurcation diagram showing the asymptotic behavior of the system for a range of values of gK. The black curve represents steady state solutions, which could be stable (solid curve) or unstable (dashed). The red curves represent the maximum and minimum voltages of periodic spiking solutions, which may be stable (solid) or unstable (dashed). For small values of gK the steady state solutions are stable, and at an elevated or depolarized voltage. They lose stability at a subcritical Hopf bifurcation (HP1), giving rise to a branch of periodic spiking solutions. The steady state solutions regain stability at another subcritical Hopf bifurcation (HP2).
Figure 2.
(A) Bifurcation diagram illustrating the asymptotic dynamics of the system, with gK as bifurcation parameter (fixed C = 2 and gA= 2). Steady state solutions (black) are either stable (solid) or unstable (dashed). (Red) Minimum and maximum V of periodic spiking solutions, either stable (solid) or unstable (dashed). Subcritical Hopf bifurcations (HP1, HP2) initiate and terminate the periodic branch. (B) Blowup of the diagram in the top panel near HP1, highlighting the region where bursting occurs. PD=period doubling bifurcation.
The spiking solutions are stable for most of the range of gK for which they exist. However, as highlighted in Fig. 2B, there is a small range of gK values where the spiking branch is unstable. This is expected to the left of HP1 and to the right of HP2 because these Hopf bifurcations are subcritical. However, there is a much larger region to the right of HP1 where the periodic solutions are unstable, and this is surprising. The explanation is that the spiking branch goes through a period doubling bifurcation (PD1) shortly after turning around at a saddle-node of periodics (SNP, not labeled). The primary spiking branch regains stability only after a second PD bifurcation occurs (PD2). Thus, between HP1 and PD2 the steady state and regular spiking branches are both unstable. This is the region where bursting occurs. We show later, by going to the singular limit C → 0, that this bursting is a canard-induced mixed mode oscillation (see, e.g., Brons et al., 2006). The stable spiking solution that occurs between the left SNP bifurcation and PD1 loses stability and is replaced by a stable doublet spiking solution at PD1. We distinguish this from the bursting solution that occurs between PD1 and PD2.
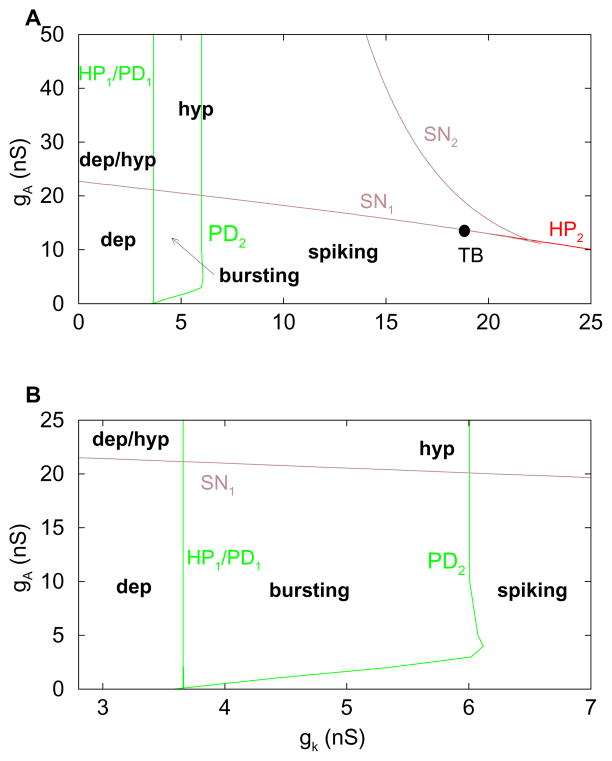
We next determine how the bifurcation points in Fig. 2 vary when the conductance gA of the IA current is changed. This is done since our prior analysis showed the importance of IA in the production of bursting. We use a two-parameter (gK, gA) diagram to show the dependence of the different bifurcations on the gK and gA parameters (Fig. 3A). The left subcritical Hopf bifurcation of Fig. 2A is insensitive to gA, because the A-type current is inactivated at depolarized voltages. Thus, the curve of bifurcation points of this type is nearly vertical in Fig. 3A (left green curve). On the other hand, the right subcritical Hopf bifurcation in Fig. 2A is very sensitive to gA because when gA is greater, less gK is needed to destabilize the hyperpolarized steady state (right red curve in Fig. 3A). The left PD bifurcation in Fig. 2B remains close to HP1 as gA is varied, so this bifurcation curve is almost indistinguishable from the HP1 curve. Therefore, we only show a single curve in the figure and denote it by HP1/PD1. The PD2 bifurcation in Fig. 2B is important as the right boundary for the bursting. For small values of gA, PD2 moves to the right as gA is increased, increasing the range over which bursting occurs. However, when gA becomes sufficiently large the PD bifurcation becomes insensitive to further increases. As a result, the PD2 curve in Fig. 3A first has a positive slope, but eventually becomes vertical. The HP1/PD1 and PD2 curves then form the left, right, and lower boundaries of the region of bursting (Fig. 3). The lower boundary clearly shows that the IA current is necessary for bursting in this model (independent of the strength of the delayed rectifier).
Figure 3.
(A) Two-parameter bifurcation diagram in the parameters gK and gA, with C = 2 pF. (B) Blowup of panel A, highlighting the bursting region. The label SN represents a saddle node bifurcation. The label TB represents a codimension-2 Takens-Bogdanov bifurcation. The system behaviors are in bold: bursting=periodic bursting, dep=depolarized steady state, hyp=hyperpolarized steady state, dep/hyp=bistable region.
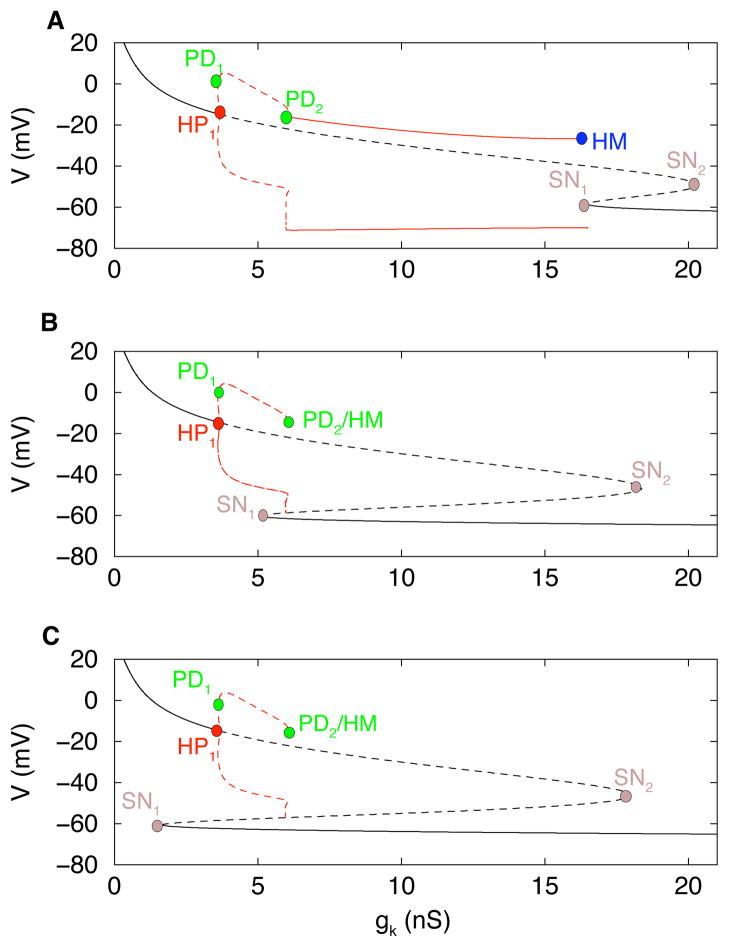
To see where the upper boundary of the bursting region (the SN1 branch) comes from, we return to a 1-parameter bifurcation diagram, but this time with a larger gA conductance, gA = 15 nS (Fig. 4A). With this larger gA the stationary branch of solutions is folded, creating the two knees or saddle-node (SN) bifurcations in Fig. 4A. The periodic spiking branch that emerges from the Hopf bifurcation (HP1) goes through two PD bifurcations as before, gaining stability at the right PD. The stabilized spiking branch now terminates at a homoclinic saddle-node on invariant circle bifurcation (labeled HM in the figure). This SNIC bifurcation comes about when HP2 from Figs. 2, 3 coalesces with the lower SN (SN1) in Fig. 4A at a codimension-2 Takens-Bogdanov (TB) bifurcation.
Figure 4.
(A) One-parameter bifurcation diagram for C = 2 pF and gA = 15 nS. There is a fold in the stationary branch, with two saddle-node (SN) bifurcations. The stable spiking branch terminates at a homoclinic (HM) saddle-node on invariant circle bifurcation. Bursting exists between PD1 and PD2. (B) Increasing gA to 20.5 pS moves SN1 to the left of PD2. The unstable spiking branch terminates at a homoclinic saddle-node loop bifurcation that is very close to PD2. Bursting only exists between PD1 and SN1. (C) Further increasing gA to 22 nS moves SN1 to the left of PD1, so that bursting is no longer produced.
When gA is increased further SN1 shifts leftward, eventually moving to the left of PD2. As this happens, PD2 and HM move together, eliminating the stable branch of spiking solutions (Fig. 4B). The interval of bursting solutions now terminates at SN1, rather than PD2, and the termination is through a homoclinic bifurcation; the silent phase of the burst gets progressively longer as gK approaches the SN1 bifurcation. When gA is increased even further SN1 moves to the left of PD1, eliminating the interval of bursting solutions (Fig. 4C). Thus the stable asymptotic structure of the system is a depolarized and/or a hyperpolarized steady state, for the full range of gK.
The sequence of events described above is summarized in the two-parameter (gK, gA) diagram (Fig. 3). The two branches of SN bifurcations (the left and right knees) are shown in brown in panel A, coalescing at a codimension-2 cusp bifurcation. The HP2 bifurcation coalesces with the SN1 bifurcation at the labeled TB point. For all gA values above this point the spiking branch terminates at a homoclinic bifurcation (a SNIC bifurcation for lower gA values and a saddle-loop bifurcation for higher gA values; see Fig. 4). The SN1 bifurcation branch forms the upper boundary for the bursting, since for all gA values above this curve the system is either globally stable with a hyperpolarized stationary attractor, or bistable with hyperpolarized and depolarized stationary attractors. This loss of bursting oscillations for sufficiently large gA was described previously (Toporikova et al., 2008), but not in terms of the (gK, gA) bifurcation structure. This (gK, gA) diagram provides the curves that delimit the various system behaviors which are given in bold text in Fig. 3.
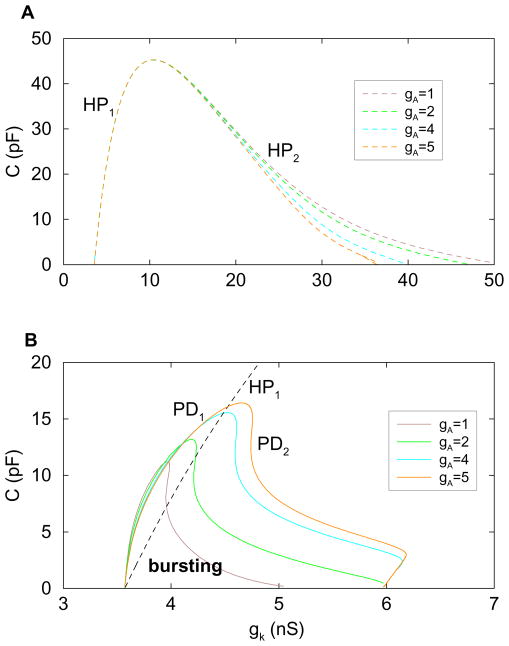
Varying the gA parameter, as was done above, varies the influence that the important A-type K+ current has on the system. We next vary the membrane capacitance C, which changes the time scale separation between V and the slower variables e and n. Making C larger makes V slower, thereby decreasing the time scale separation. Figure 5A is a two-parameter bifurcation diagram showing how the locations of the subcritical Hopf bifurcations vary with C and gK. This is done for four different values of gA. In all cases, as C is increased the HP bifurcations come together, eventually coalescing at a relatively high C value. Beyond this value, the system is steady, exhibiting neither continuous spiking nor bursting oscillations.
Figure 5.
(A) Two-parameter bifurcation diagram illustrating the dependence of the Hopf bifurcations on the membrane capacitance C for four different values of gA. The HP1 bifurcation is insensitive to gA. (B) Two-parameter bifurcation diagram illustrating the C dependence of period doubling bifurcations of the primary spiking solution. A single HP1 curve is also included. Bursting occurs between HP1 and PD2. Between PD1 and HP1 the system is bistable between a hyperpolarized steady state and a complex spiking pattern (doublets, 4-spike pattern, etc.).
From Fig. 5A it is clear that the left branch of the HP curve is unaffected by changes in gA over the range gA ∈ [1, 5] nS, so in the blowup figure in panel B the left branch of a single HP curve is shown. Also shown, for four values of gA, are branches of PD bifurcations. For each value of gA, bursting exists between the HP1 curve and the PD2 curve. Between the PD1 branch and the HP1 curve a stable hyperpolarized stationary solution coexists with a spike doublet solution (the doublet bifurcates further through a series of PD bifurcations, leading ultimately to chaos). We see that the bursting region expands as gA is increased, at least for gA up to 5 nS, and that the bursting region also expands as C decreases (except for a minor decrease of the bursting regime in the limit C → 0 for gA bigger than 1 nS). We also point out that, in the limit C → 0, the range of gK values for which bursting occurs extends from HP1 to gK ≈ 6 nS for the larger values of gA. We show this again later in our analysis of the mixed mode oscillations that underlie bursting in this system.
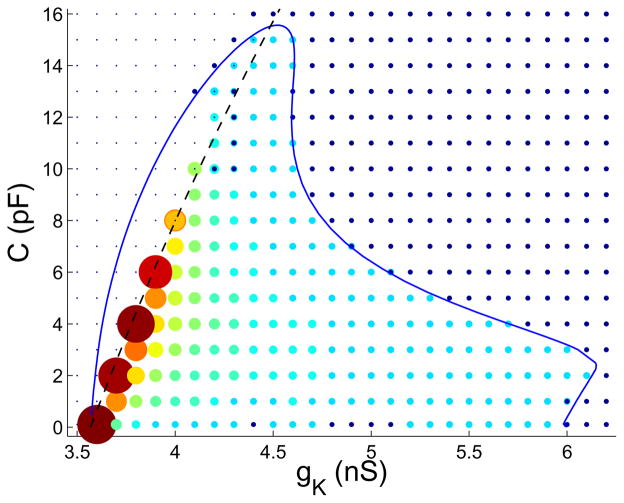
We next demonstrate how the number of spikes per burst varies. This is an important biological feature, since this number (partly) determines the burst duration (active phase) and hence the amount of Ca2+ influx, and thus the amount of hormone released from a cell. We set gA = 4 nS and vary gK and C over a rectangular grid of values, with ΔgK = 0.1 nS and ΔC = 1 pF. For each choice of parameters we solve the differential equations numerically and count the number of spikes per burst. In Fig. 6 circles represent the number of spikes in a burst. Large reddish circles represent bursts with many spikes (maximum of 62 for the largest circles), while small blue circles represent bursts with few spikes (minimum of 2). We superimpose the PD curve for gA = 4 nS and the HP1 curve onto the grid. To the right of PD2 the system exhibits continuous spiking, represented by small dark circles. To the left and above the PD1 branch the system is at a steady state (represented by points). Bursting or complex spiking (doublets, 4-spike patterns bifurcating off of the doublets branch, etc.) occurs only within the two branches of the PD curve. Between the PD1 and HP1 curves the system is bistable, with coexisting stable hyperpolarized steady states and simple or complex spiking (the bistable region extends to the left of the PD1 bifurcation to the saddle node of periodics (SNP); see discussion of Fig. 2). Thus, in the simulation grid this region is occupied by a mix of points (steady states) and circles (simple or complex spiking). For some parameter values there are circles with points in the middle, representing bistable solutions that were found by varying the initial conditions. In many cases only one stable solution was found, which maybe be due to a small basin of attraction of the other stable solution. The most important observation to make from Fig. 6 is that the number of spikes per burst is greatest at the lower gK values. We show later that this is predicted from the analysis of mixed mode oscillations in the C → 0 limit.
Figure 6.
Number of spikes per burst for a grid of gK and C values (gA = 4 nS). Single points represent steady states, and small dark circles represent continuous spiking. Larger circles with colors ranging from light blue to red represent bursting. The larger the circle, the greater the number of spikes per burst. The minimum number of spikes is 2 (small, light blue), and the maximum is 62 (large, red). Circles with points in the middle represent bistable dynamics.
5 Geometric Singular Perturbation Analysis
We now show the origin of the spiking and bursting oscillations described in previous sections. The bursting oscillations are not of the standard type, which are due to bistability of the fast subsystem of variables between a hyperpolarized steady state and a periodic (spiking) solution (Rinzel, 1987; Rinzel and Ermentrout, 1998). To understand the bursts produced by the current model we take advantage of the time-scale separation of the variables that was pointed out in section 3.
To rigorously justify the time-scale separation in (Eqs. 3.1–3.3), we nondimensionalize the system by introducing a dimensionless ‘voltage’ variable v = V/kv where we choose kv = 100 mV as a typical voltage scale, and a dimensionless ‘time’ variable τ = t/kt where kt = τe = 20 ms is a typical (slow) time scale of the system. This leads to the dimensionless form
| (5.1) |
where
| (5.2) |
and τv = C/gmax. Note that the overbar denotes a dimensionless parameter. The right hand sides take the form of a scaling factor multiplied by some quantity which is O(1). With the choice of the above scaling factors kv and kt, we see that the dynamics of the variables (n, e) are of O(1) while the dynamics of the variable v is O(1/ε) where
| (5.3) |
In particular, decreasing the capacitance C decreases ε and hence increases the time scale separation between the dynamics of the fast variable v and the slow variables (n, e). Therefore, system (5.1) is a singularly perturbed system with two slow variables (n, e), one fast variable (v) and singular perturbation parameter ε.
The dimensional analysis above demonstrates that the original system (Eqs. 3.1–3.3) already has the correct factorization (although in dimensional form). Hence, for easier comparison with the bifurcation analysis presented in section 3, we use this original system in our analysis and treat V as a fast variable, (e, n) as slow variables and C as the singular perturbation parameter.
We begin our geometric singular perturbation analysis by moving to the singular limit, C → 0, where V changes instantaneously and the slow variables evolve in (slow) time according to (Eqs. 3.2–3.3). If we define the right hand side of Eq. 3.1 by
| (5.4) |
then f(V, e, n) = 0 defines the corresponding quasi-steady state condition due to the instantaneous dynamics of V. The two slow variables (e, n) evolve in (slow) time so that this condition is satisfied. That is, the phase point in ℝ3 travels along the critical manifold
| (5.5) |
(except at discrete jumps from one sheet of the manifold to another which are controlled by the layer problem, defined below). This slow evolution on S is called the reduced flow. The implicit equation f = 0 can be solved explicitly for n (or for e, but not V), which enters into IK (and f) linearly,
| (5.6) |
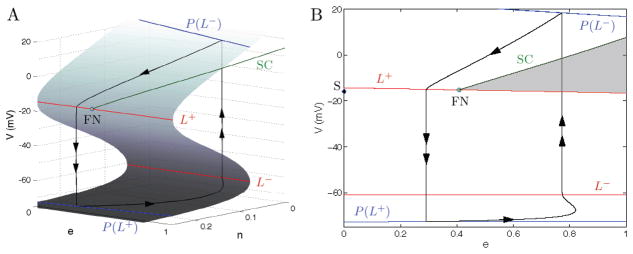
The critical manifold S is a folded surface, shown in Fig. 7A for one set of gK and gA values. The bottom, middle, and top sheets of the surface are separated by fold curves (in red). Fold curve L− separates the bottom and middle sheets, while fold curve L+ separates the middle and top sheets. Note that this geometric structure of the critical manifold will not change under the variation of gK (it is only a scaling factor).
Figure 7.
A singular periodic orbit concatenated by slow and fast segments of the two singular limit systems, the reduced problem (5.11)–(5.12) and the layer problem (5.16)–(5.17), that leads to relaxation oscillations in (Eqs. 3.1–3.3) for C > 0. Here, the periodic orbit does not enter the singular funnel of the folded node FN, bounded by the fold curve L+ and the strong singular canard SC. (A) A view of the singular periodic orbit (black) and the critical manifold. (B) Projection onto the (e, V)-plane with the singular funnel highlighted in gray. FN is at (e, V) = (0.41,−15.26), eigenvalue ratio is μ ≈ 0.1 and parameter values are gA= 0.2 nS and gK = 4.0 nS. There is also a saddle equilibrium S (black diamond) at (e, V) = (1.5 × 10⁻⁴, −15.94).
Since the critical manifold Eq. 5.6 is a graph over the base (e, V), the dynamics on the critical manifold, the reduced flow, can be described by the differential equation for e (Eq. 3.2) and by differentiating f(V, e, n) = 0 with respect to time to obtain a differential equation for V. Thus,
| (5.7) |
yields
| (5.8) |
where n = n(e, V) and the reduced system projected onto the base (e, V) is given by
| (5.9) |
| (5.10) |
This system is singular along the fold curves L±, where . To remove this singularity we rescale time with the transformation . With this transformation we obtain the desingularized system:
| (5.11) |
| (5.12) |
The phase portraits of the reduced system and the desingularized system are equivalent on the top and bottom sheet of the critical manifold. Because of the time rescaling, the flow of the desingularized system on the middle sheet, where , must be reversed to obtain the equivalent reduced flow on the middle sheet. Thus the reduced flow can be obtained by analyzing the desingularized system.
The reduced flow, calculated by numerically solving Eqs. 5.11, 5.12, is shown on the critical manifold in Fig. 7A and its projection onto the e-V plane is shown in Fig. 7B (black curve, single arrow). The trajectory moves along the bottom sheet until it reaches L−. At this point, the reduced flow is singular ( ) and the solution ceases to exist due to finite time blow-up. The quasi-steady state assumption f = 0 cannot hold anymore and we expect a rapid motion away from the fold-curve L−. This rapid motion can be understood by switching to a fast (dimensionless) time scale t1 = t/τv which transforms (Eqs. 3.1–3.3) to
| (5.13) |
| (5.14) |
| (5.15) |
Taking the singular limit C → 0 we obtain the layer problem
| (5.16) |
| (5.17) |
which describes the evolution of the fast variable V along one-dimensional fibers where (e, n) are constant parameters. Note that the critical manifold is the manifold of equilibria for the layer problem. The stability of these equilibria is determined by the sign of . It follows that the lower and upper sheets, which we denote by , are attracting ( ) while the middle sheet, denoted by Sr, is repelling ( ).
Going back to Figure 7, we concatenate the trajectory of the reduced flow that reaches the fold-curve L− with a fast fiber segment of (Eq. 5.16–5.17) which provides the rapid motion from L− to the stable top sheet (black curve, double arrow) at a point on P(L−). The curve P(L−) denotes the projection of L− along fast fibers onto the stable top sheet , while L+ is projected onto the stable bottom sheet as P(L+) (blue curves). From here the trajectory moves according to the reduced flow along the top sheet until L+ is reached and the layer problem is again solved for the rapid motion to the stable bottom sheet at a point on P(L+). Here, this concatenation of slow and fast segments leads to a singular periodic orbit. Geometric singular perturbation theory (Szmolyan and Wechselberger, 2004) shows that this orbit perturbs to a nearby periodic relaxation oscillation orbit of system (Eqs. 3.1–3.3) for sufficiently small C ≠ 0. This relaxation oscillation orbit corresponds to a spiking solution below the PD2 curve in Fig. 3. In the following, we apply geometric singular perturbation techniques to uncover the genesis of the bursting mechanism in system (Eqs. 3.1–3.3).
6 Mixed Mode Oscillations
Mixed mode oscillations consist of small amplitude oscillations followed by large relaxation-type excursions, repeated periodically. An understanding of possible mechanisms for these oscillations using geometric singular perturbation theory has recently been achieved (Wechselberger, 2005; Brons et al., 2006; Guckenheimer, 2008). One possibility is the existence of folded node singularities of the reduced flow together with an appropriate global return mechanism (see e.g., Brons et al., 2006).
A folded singularity of the reduced system (Eqs. 5.9–5.10) is an equilibrium of the desingularized system (Eqs. 5.11–5.12) that occurs on a fold curve and satisfies
| (6.1) |
| (6.2) |
| (6.3) |
Generically, this is different from an ordinary singularity of the reduced flow (an equilibrium), which is also an equilibrium of the desingularized flow but satisfies (equation changed)
| (6.4) |
| (6.5) |
| (6.6) |
Such an ordinary equilibrium of the reduced flow is positioned away from the fold-curves L± and is also an equilibrium of the full system (Eqs. 3.1–3.3), i.e. (equation added)
| (6.7) |
| (6.8) |
| (6.9) |
These equilibria have been identified in the bifurcation diagrams of section 3.
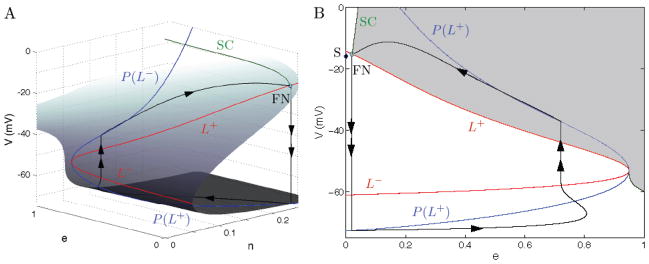
Linear stability analysis of a folded singularity indicates whether it is a folded node (FN), a folded saddle, or a folded focus. In the present case, and with parameter values gA = 4 nS, gK = 4 nS, a folded node singularity exists on the fold curve L+ (shown in Fig. 8), since the eigenvalues of the linearization at the equilibrium point of the desingularized flow are both negative. Also, for this choice of parameter values the fold curves L+ and L− join and form a cusp-like structure near e = 1. Compare with Fig. 7 (where gA = 0.2 nS and gK = 4 nS) which also has a FN, but for which the fold curves do not form a cusp for e in the admissible range of [0,1].
Figure 8.
A singular periodic orbit (black) concatenated by slow and fast segments of the two singular limit systems, the reduced problem (5.11)–(5.12) and the layer problem (5.16)–(5.17), that leads to MMO in (Eqs. 3.1–3.3) for C > 0. Parameter values are gA = 4.0 nS and gK = 4.0 nS. (A) Critical manifold (surface) with fold curves L− and L+ (red) and fold curve projections P(L±) (blue). Also shown is the strong singular canard (green, SC) of the folded node (FN). (B) Projection onto the (e, V)-plane with the singular funnel highlighted in gray. The FN is at (e, V) = (0.02, −15.26) and has eigenvalue ratio of μ ≈ 0.1. There is also a saddle equilibrium S (black diamond) at (e, V) = (1.4 × 10⁻⁴, −15.94).
The reduced flow in the neighborhood of a folded node has very interesting properties. Singular canards (Benoit, 1983; Szmolyan and Wechselberger, 2001) exist in the neighborhood of a folded singularity. These trajectories enter the folded singularity, in our case along the top attracting sheet of the critical manifold, and move through the folded node singularity in finite time, emerging on the repelling middle sheet Sr and traveling along it for some time. For folded nodes, this implies that there is a whole sector of singular canards, bounded below by L+ and above by the strong singular canard (SC in Figs. 7, 8) associated with the unique trajectory which is tangent to the eigendirection of the strong eigenvalue of the FN. This sector, the singular funnel, is shown in gray in Figs. 7, 8. In the case of a folded saddle, only two such singular canards exist, while a folded focus has no singular canards.
For canard-induced MMOs to exist, a singularly perturbed system has to fulfill two major requirements (Brons et al., 2006):
The reduced flow has to possess a folded node singularity.
There is a singular periodic orbit formed from the concatenation of slow and fast segments of the reduced and layer problems which starts with a fast fiber segment at the folded node singularity. This automatically assures that the global return of such a singular periodic orbit is within the singular funnel of the folded node.
If these two assumptions are fulfilled then canard theory implies that this singular periodic orbit perturbs to a nearby MMO orbit for sufficiently small ε > 0 (C > 0). In the case shown in Fig. 8, these assumptions are fulfilled; the singular periodic orbit starting at the FN indeed returns into the singular funnel. We therefore expect to find MMOs in system (Eqs. 3.1–3.3). Furthermore, the theory predicts that the small amplitude oscillations of the MMO pattern occur in a neighbourhood of the folded node and that the maximum amplitude of these small oscillations is , i.e., the maximum amplitude grows proportional to the square root of the capacitance C. This also implies that the amplitude of the small oscillations vanishes in the singular limit ε → 0 (C → 0).
The small amplitude oscillations are due to a geometric property of invariant manifolds near a folded node. According to Fenichel theory (Fenichel, 1979; Jones, 1995), the attracting and repelling sheets of the critical manifold ( and Sr, respectively) away from the fold-curves L± perturb smoothly to locally invariant slow manifolds ( and Sr,C, respectively) for C sufficiently small, but non-zero. These perturbed slow manifolds are in an O(C) neighbourhood of the unperturbed critical manifolds. Furthermore, the flow on these perturbed slow manifolds is a smooth O(C) perturbation of the reduced flow on the corresponding unperturbed manifolds. If one extends these perturbed slow manifolds by the flow into the vicinity of a folded node singularity, then the intersection of the attracting and repelling sheets is locally twisted (see Wechselberger, 2005 for details; the numerical technique for computing twisted slow manifolds is described in (Desroches et al., 2008).) Singular canards of the reduced flow perturb to actual canards of the original system. In our case, these canards follow toward the FN and Sr,c afterwards before jumping to . Since and Sr,c are twisted near the FN, the canards rotate and produce the small spikes during the active phase of the burst.
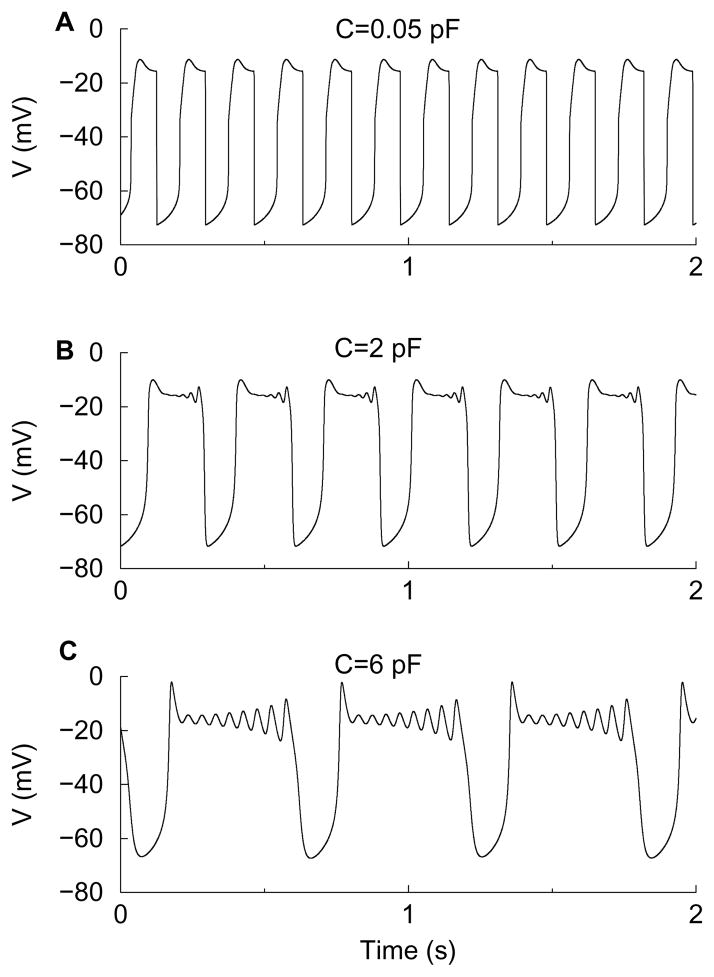
Figure 9 confirms the predicted MMO result for gK = 4 and gA = 4. It illustrates the emergence of small amplitude oscillations in the voltage time course as C is increased. When C = 0.05 pF the (very) small amplitude oscillations are not yet visible. Projection of this trajectory onto (e, V)-space (not shown here) closely follows the singular periodic orbit in Fig. 8B. When C is increased by a factor of 40 to C = 2 pF small oscillations appear near the end of the active phase; this is a bursting oscillation with small spikes (panel B). These reflect the rotational properties near the FN that were undetectable near the singular limit. When C is increased further to C = 6 pF the small oscillations are larger than before and occur throughout the active phase (panel C). Notice that in all three time courses the beginning of the active phase is characterized by a voltage peak. This is due to the shape of the critical manifold and the direction of the reduced flow, and is not one of the small oscillations associated with the folded node. For example, there are 8 small spikes associated with the FN in Fig. 9C, preceded by an additional small spike. This additional oscillation does not vanish in the singular limit C → 0, another indicator that it is not associated with the folded node.
Figure 9.
Mixed mode oscillations with gK = 4 nS, gA = 4 nS, and various values of C. (A) C = 0.05 pF is very small and the small amplitude oscillations are not visible. (B) When C is increased forty-fold (C = 2 pF) small oscillations become visible during the active phase, reflecting the twists near the folded node. Here we find smax = 5 plus one additional small oscillation at the beginning of the active phase. (C) With a larger conductance, C = 6 pF, the small oscillations (8 + 1) occur throughout the active phase. The predicted maximum number smax = 5 does not hold anymore because the conductance C, considered as a singular perturbation parameter, is too large.
For MMOs to exist, it is crucial that the phase point returns to the singular funnel of the folded node when entering the active phase of the oscillation. This will occur when the point on P(L−), that the phase point jumps to when leaving L−, lies in the singular funnel of the folded node. If this does not happen, then no small oscillations will be produced and the trajectory will exhibit a relaxation oscillation. This is illustrated in Fig. 7, both on the critical manifold and on its projection onto the (e, V)-plane. In this example, there also exists a folded node, but since the projection curve P(L−) does not intersect the singular funnel (gray shaded region in Fig. 7B) it follows that the return of the singular trajectory starting at the folded node is outside the singular funnel of the folded node. Hence we do not expect a MMO but a relaxation oscillation.
Whether or not the global return mechanism projects the phase point into the singular funnel can be formalized as follows. Let δ denote the distance from the phase point on P(L−) of the singular periodic orbit to the strong canard SC with the convention that δ > 0 indicates that the phase point is within the singular funnel. The condition δ = 0 corresponds to the border between MMOs and relaxation oscillations and indicates that the segment of the singular periodic orbit on lies on the strong canard SC. For example, for fixed gK = 4 nS we have δ = 0 for gA ≈ 0.27 nS. The δ is a continuous increasing function of gA, so δ < 0 when gA = 0.2 pS and relaxation oscillations are produced (Fig. 7) and δ > 0 when gA = 4 pS and MMOs are produced (Fig. 8).
The choice of parameter values determines whether or not the singular periodic orbit enters the singular funnel. The behaviors of these singular periodic orbits are summarized in Fig. 10 for the two parameters gK and gA. MMOs are predicted for all parameter combinations within the region highlighted in gray. For any value 3.5 < gk < 6 nS (and independent of gA), there exists a folded node singularity on L+, which is the first requirement for MMOs to exist and explains the left and right boundary of the MMO regime. The second requirement for MMOs, δ > 0, is fulfilled above the curve δ = 0 which explains the lower boundary of the MMO region. The upper boundary of the MMO region is a curve of saddle-node bifurcations SN1. Crossing this curve towards increased gA annihilates the MMO attractor because a stable equilibrium attractor bifurcates. This is a stable hyperpolarized state of the reduced system. There is also a stable depolarized state of the reduced system for gK < 3.5.
Figure 10.
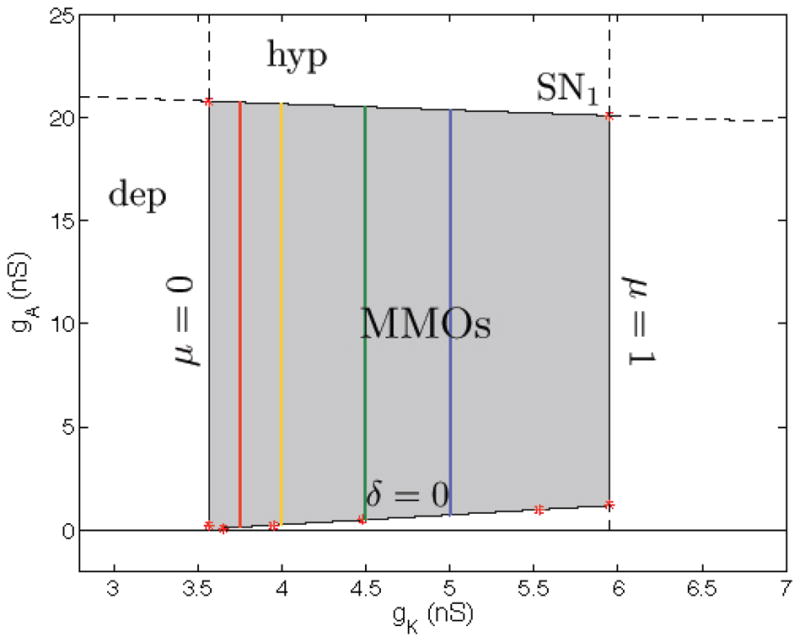
Region in the gK-gA parameter space where MMOs are predicted in the C → 0 limit. The colored vertical line segments indicate various values of smax, the maximum number of small oscillations that can occur in an MMO (red=12, yellow=5, green=2, blue=1). This number increases as gK is decreased.
6.1 Comparison of bifurcation diagrams
The MMO region in Fig. 10 is very similar to the bursting region in Fig. 3B and explains the genesis of the observed bursting region as the singular perturbation parameter C is increased. In both cases the upper bound of the MMO/bursting region is a curve of saddle-node bifurcations SN1 which indicates that the system is in a hyperpolarized steady state for large conductance gA. To understand the relation of the left, right and lower boundaries in both bifurcation diagrams in more detail, a bit more canard theory is required, as discussed next.
For sufficiently small values of the perturbation parameter, C in this case, it is possible to calculate the maximal number of small oscillations of a MMO pattern (Wechselberger, 2005). This number, smax, depends on the eigenvalues of the linearization of the desingularized system at the FN. Let these eigenvalues be denoted by λ1 and λ2, where |λ1| < |λ2|, and define the eigenvalue ratio
| (6.10) |
Then, since at a FN both eigenvalues have the same sign, 0 < μ < 1. The maximal number of small oscillations in the MMO is then
| (6.11) |
the greatest integer less than or equal to . Thus, if s is the number of small oscillations produced in the MMO for sufficiently small C, then s ≤ smax where smax is given by Eq. 6.11. Here sufficiently small C means that , where ε is given by Eq. 5.3. Otherwise the system is too far from the singular limit and the bound becomes invalid.
In the present case, μ depends on both gA and gK. However, the dependence on gA is very weak, so that μ changes little if gK is held fixed and gA is varied (between the upper and lower bounds of the MMO region). Thus, μ is (almost) constant, and so is smax, along the vertical line segments shown in Fig. 10. When gk ≈ 3.5 nS, μ = 0 and for smaller gK values there are no MMOs. When gK ≈ 6 nS, μ = 1 and for larger gK values there are no MMOs. This explains the notation of the left and right borders in Fig. 10. Near the left border the number of small oscillations in the MMO is large (since smax → ∞ as μ → 0); near the right border the number of small oscillations is 1 (since smax → 1 as μ → 1). Note that this is in addition to the initial spike that begins an active phase.
The left border μ = 0 denotes a folded saddle-node (type II) of the reduced flow. To be more precise, we observe a transcritical bifurcation of a folded singularity and an ordinary singularity. To the left of the border we have μ < 0 which corresponds to a folded saddle on L+, with a stable node equilibrium on . If we increase gK (and therefore μ), this stable equilibrium, the ordinary singularity, merges with the folded singularity for μ = 0 and crosses over to the repelling branch Sr for μ > 0 where it becomes an (unstable) saddle equilibrium. The folded singularity is now a folded node on L+ which explains the transcritical nature of the folded saddle-node, type II. (A folded saddle-node, type I, corresponds to a true saddle-node bifurcation of two folded singularities of the reduced flow, which we do not observe here.)
Note that the stable node equilibrium for μ < 0 is on the attracting sheet . Thus it corresponds to a stable equilibrium of the full system since all three eigenvalues (two from the reduced problem and one from the layer problem) are negative. This corresponds to a stable depolarized state because the delayed rectifier is too weak to repolarize the cell. When gK is increased so that μ > 0, the equilibrium has bifurcated to the repelling sheet Sr, where it is a saddle point in the reduced system. Hence, it corresponds to an unstable equilibrium of the full system with two positive eigenvalues (one from the reduced problem and one from the layer problem) and one negative eigenvalue (from the reduced problem). Therefore, the real part of two eigenvalues changes sign as the bifurcation point is crossed. Exactly the same happens when C > 0, as shown in the bifurcation diagram of Fig. 3. Here we observe a Hopf bifurcation (HP1), i.e., two (complex conjugate) eigenvalues change their sign. Hence, the singular limit (C → 0) representation of a Hopf bifurcation in a singularly perturbed system is a folded saddle-node, type II, of the corresponding reduced problem. This observation is also confirmed in Fig. 5 where the Hopf bifurcation HP1 converges to gK ≈ 3.5 for C → 0 independent of gA. Subsequent bifurcations near a folded saddle-node, type II, are currently under investigation with emphasis on the role of the nearby saddle equilibrium on MMO patterns (Guckenheimer, 2008; Krupa and Wechselberger, 2008).
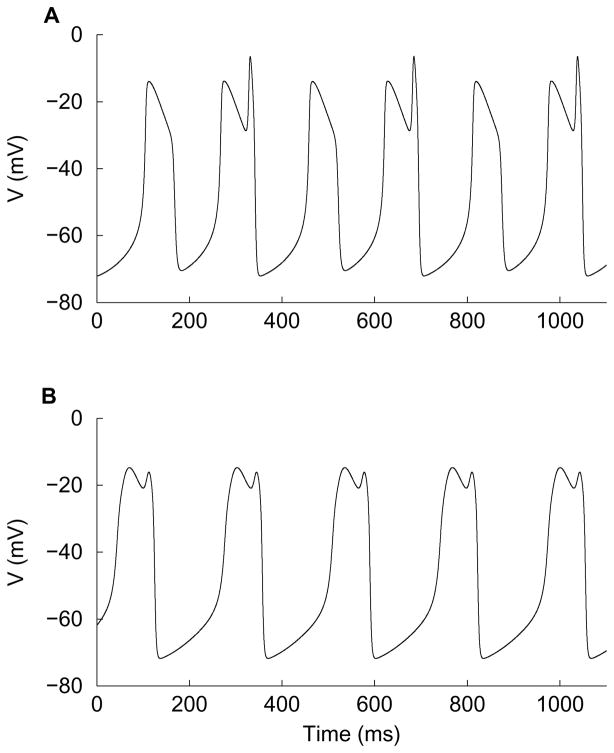
We next consider the right border, μ = 1, in Fig. 10 and relate it to Fig. 3B. This border of the MMO regime corresponds for C = 0 to a degenerate folded node where two nonzero eigenvalues merge. To the right of this border we have folded foci which possess no canards. Hence we only observe relaxation oscillations as described in section 4. To the left of the border we have folded nodes with eigenvalue ratio μ close to one which implies that smax = 1. Hence we observe MMOs with one extra small-amplitude oscillation (Fig. 11B) compared to a relaxation oscillation. In Fig. 3B the right border consists of period doubling bifurcations (PD2). Near the PD 2 bifurcation the phase point in the depolarized state follows the strong canard and alternately jumps up and jumps down, thus producing an oscillation with doubled period (Fig. 11A). For smaller g A values, such as on the lower PD2 branch, the phase point in the depolarized state travels along the strong canard and jumps down at different locations, creating a period-two relaxation oscillation with slightly different amplitudes. The other period doubling bifurcation (PD1) in Fig. 3B is a transition from single spikes to doublets.
Figure 11.
Time courses of MMO patterns for parameter values gA = 10 nS and C = 2 pF near the right PD2 boundary in Fig. 3: (A) a period-doubled oscillation (21 MMO pattern) for gK = 6.00895 nS and (B) a 11 MMO oscillation for gK = 5.5 nS.
A last piece of canard theory is required to compare bifurcation structures within the MMO regime in Fig. 10 with Fig. 3B. For sufficently small values of the perturbation parameter C, there exist (smax − 1) secondary canards which partition the funnel region of a folded node into smax subsectors with different rotational properties (Wechselberger, 2005). The first subsector is bounded by the strong canard SC and the first secondary canard; trajectories within this subsector make one rotation. The second subsector is bounded by the first and the second secondary canard; trajectories within this subsector make two rotations. The last subsector is bounded by the (smax − 1) secondary canard and the fold curve L+; trajectories in this last subsector make the maximal smax rotations. Hence, each subsector has a different rotation number.
All secondary canards are within an O(ε(1−μ)/2) neighborhood of the strong canard SC which implies that the size of the first (smax − 1) subsectors is of O(ε(1−μ)/2) since they are bordered by secondary canards. The last subsector with maximal rotation number is of size O(1) since it is bordered by the last secondary canard and the fold-curve. In the singular limit, all secondary canards merge with the strong canard and hence only the maximal rotation subsector survives. It follows that if the singular perturbation parameter is sufficiently small compared to the distance δ > 0 of the singular periodic orbit from the SC, i.e., δ > ε(1−μ)/2 and hence the periodic orbit is within the last subsector, then the observed MMO has maximal rotation number. As δ approaches zero, the periodic orbit moves through all the different rotational sectors, finally reaching the first subsector with only one rotation. Thus, the MMO pattern closest to the border δ = 0 has only one small oscillation.
For parameter values lying on or near the δ = 0 line segment in Fig. 10 the periodic orbit of the singular flow (the concatenation of flow in the reduced system and from the layer problem) enters the singular funnel on or near the SC curve, so for C > 0 (but sufficiently small) there will be a single small oscillation associated with the FN. If one increases gA, moving upward along a vertical line segment in the MMO region of Fig. 10, then the periodic orbit of the singular flow enters further from the SC curve and closer to L+, so the δ function increases from 0. Therefore, for C > 0 the periodic orbit enters the FN through a sector in which s is closer to smax and thus more small oscillations are produced. For example, moving upward along the yellow line segment in Fig. 10 by increasing gA will result in s increasing from 1 up to 5. For sufficiently small C, this will result in bursting oscillations with 2 spikes (for small gA) up to 6 spikes (for gA near the upper bursting boundary).
For C > 0, but small, this will result in bursting oscillations with 2 spikes for gA small up to 6 small oscillations for gA near the upper bursting boundary.
In summary, the eigenvalue ratio for the FN in the singular system, μ, determines the maximum number of small oscillations (smax) that can occur during the MMO oscillation. This parameter is adjusted through the biophysical parameter gK. Increasing gKdecreases smax. The distance from the strong canard at which the singular periodic orbit enters the singular funnel, δ, determines how close the actual number of small oscillations (s) is to the upper bound smax. This parameter is adjusted through the biophysical parameter gA. Increasing gA increases s.
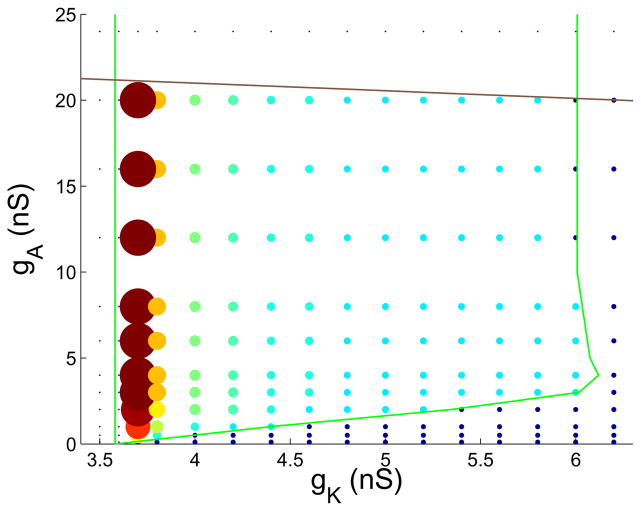
Figure 12 shows how the number of spikes in a burst varies for the case C = 2 pF, computed through numerical simulation of the full system. To the right and below the bursting region of the gK-gA parameter space the system spikes continuously (small blue circles). To the left and above the bursting region the system is at a steady state (blue dots). Within the bursting region, but near the bottom boundary, the number of spikes per burst is small, typically two or three. As one moves away from the lower boundary the number of spikes per burst increases rapidly to a maximum, and the value of this maximum is larger on the left side of the bursting region than on the right side. This is all consistent with the singular perturbation analysis. Even for larger values of the capacitance C the same trends are observed, however as C is increased the lower bursting boundary moves upward and there is an increase in the range of gA values over which the number of spikes per burst increases from two to its maximum (not shown).
Figure 12.
Number of spikes per burst for a grid of gK and gA values (C = 2 pF). Single points represent steady states, and small dark circles represent continuous spiking. Larger circles with colors ranging from light blue to red represent bursting. The larger the circle, the greater the number of spikes per burst (same as in Fig 6). The minimum number of spikes is 2 (small, light blue), and the maximum is 53 (large, red). The green and brown curves are the period doubling and saddle node bifurcation curves shown in Fig. 3B.
7 Discussion
Mixed mode oscillations have appeared in several neural applications (Erchova and McGonigle, 2008; Wechselberger, 2005; Rubin and Wechselberger, 2007; Rotstein et al., 2008; Ermentrout and Wechselberger, 2009; Drover et al., 2005; Brons et al., 2008; Krupa et al., 2008; Guckenheimer et al., 1997). In this article we have demonstrated how MMOs can produce a type of bursting oscillation (Fig. 1) that has been described in a recent mathematical model of the pituitary lactotroph (Toporikova et al., 2008), and which could potentially describe bursting in other endocrine cells and neurons. We have shown the genesis of this bursting rhythm using geometric singular perturbation theory. The curves in the (gK,gA) parameter space that bound the MMO region in the singular limit (Fig. 10) correspond nicely to those that bound the bursting region away from this limit (C = 2 pF, Fig. 3). Thus, the analysis performed at the singular limit not only reveals the subtle mechanism of bursting in this system, but it also provides information on the extent of bursting that is consistent with the bifurcation analysis of the full system.
Importantly, the singular perturbation analysis provides information on features that were not apparent from the bifurcation analysis of the full system. While the full-system analysis provided boundaries for the bursting region in parameter space, it did not fully explain the rationale for these boundaries. The singular perturbation analysis gave a clear rationale, in terms of the properties of the folded node singularity and the curves delimiting the singular funnel. Also, singular analysis provided information on how the number of spikes in a burst varies in parameter space. This information could not be obtained from the bifurcation analysis of the full system, but required numerical simulation (Figs. 6, 12). Finally, the singular theory predicts that the amplitude of the spikes that occur during bursting increase as the square root of the capacitance (the actual value of capacitance for pituitary somatotrophs is ~ 5 pF and for lactotrophs is ~ 6 pF). This dependence of spike amplitude on C can only be obtained from the full system through numerical simulation.
While the singular perturbation analysis has many virtues, it also has limitations. Most obviously, the singular analysis is only guaranteed to be valid for sufficiently small C. Also, the analysis is most effective when there are no more than two slow variables. Thus, the singular analysis has limitations that are not present in the full-system bifurcation analysis. This emphasises the power of combining the two analysis techniques: singular perturbation analysis to understand the oscillation mechanism and extent in parameter space assuming that certain conditions are met, and full-system bifurcation analysis to extend the singular analysis to the non-singular situation that is likely a more accurate description of the biological system.
Acknowledgments
Financial support was provided by the National Institutes of Health grant DA 43200 and National Science Foundation grant DMS 0917664 to RB. MW thanks the Vienna University of Technology and the Mathematical Biosciences Institute at Ohio State University for sabbatical support.
References
- Benoit E. Syst’emes lents-rapides dans r3 et leur canards. Asterisque. 1983;109–110:159–191. [Google Scholar]
- Brons M, Kaper TJ, Rotstein HG. Introduction to focus issue: mixed mode oscillations: experiment, computation, and analysis. Chaos. 2008;18:015101. doi: 10.1063/1.2903177. [DOI] [PubMed] [Google Scholar]
- Brons M, Krupa M, Wechselberger M. Mixed mode oscillations due to the generalized canard phenomenon. Fields Institute Communications. 2006;49:39–63. [Google Scholar]
- Desroches M, Krauskopf B, Osinga HM. Mixed-mode oscillations and slow manifolds in the self-coupled FitzHugh-Nagumo system. Chaos. 2008;18:015107. doi: 10.1063/1.2799471. [DOI] [PubMed] [Google Scholar]
- Drover J, et al. Analysis of a canard mechanism by which excitatory synaptic coupling can synchronize neurons at low firing frequencies. SIAM J Appl Math. 2005;65:69–92. [Google Scholar]
- Erchova I, McGonigle DJ. Rhythms of the brain: An examination of mixed mode oscillation approaches to the analysis of neuro-physiological data. Chaos. 2008;18:015115. doi: 10.1063/1.2900015. [DOI] [PubMed] [Google Scholar]
- Ermentrout GB. Simulating, analyzing, and animating dynamical systems: A guide to XPPAUT for researchers and students. SIAM Books; Philadelphia: 2002. [Google Scholar]
- Ermentrout GB, Wechselberger M. Canards, clusters and synchronization in a weakly coupled interneuron model. SIAM J Appl Dyn Syst. 2009;8:253–278. [Google Scholar]
- Fenichel N. Geometric singular perturbation theory. J Differential Equations. 1979;31:53–98. [Google Scholar]
- Goor FV, et al. Dependence of pituitary hormone secretion on the pattern of spontaneous voltage-gated calcium influx. J Biol Chem. 2001;276:33840–33846. doi: 10.1074/jbc.M105386200. [DOI] [PubMed] [Google Scholar]
- Guckenheimer J. Singular Hopf bifurcation in systems with two slow variables. SIAM J Appl Dyn Syst. 2008;7:1355–1377. [Google Scholar]
- Guckenheimer J, et al. Bifurcation, bursting, and spike frequency adaptation. J Comput Neurosci. 1997;4:257–277. doi: 10.1023/a:1008871803040. [DOI] [PubMed] [Google Scholar]
- Jones CKRT. Geometric singular perturbation theory. In: Johnson R, editor. Dynamical Systems, volume 1609 of Lecture Notes in Mathematics. New York: Springer–Verlag; 1995. pp. 44–120. [Google Scholar]
- Kinard TA, et al. Modulation of the bursting properties of single mouse pancreatic β-cells by artificial conductances. Biophys J. 1999;76(3):1423–1435. doi: 10.1016/S0006-3495(99)77303-0. [DOI] [PMC free article] [PubMed] [Google Scholar]
- Krupa M, et al. Mixed-mode oscillations in a three time-scale model for the dopaminergic neuron. Chaos. 2008;18:015106. doi: 10.1063/1.2779859. [DOI] [PubMed] [Google Scholar]
- Krupa M, Wechselberger M. Local analysis near a folded saddle-node singularity. J Differential Equations. 2008 to appear. [Google Scholar]
- Kuryshev YA, Childs GV, Ritchie AK. Corticotropin-releasing hormone stimulates Ca2+ entry through L- and P-type Ca2+ channels in rat corticotropes. Endocrinology. 1996;137:2269–2277. doi: 10.1210/endo.137.6.8641175. [DOI] [PubMed] [Google Scholar]
- LeBeau AP, et al. Analysis of a reduced model of corticotroph action potentials. J theor Biol. 1998;192:319–339. doi: 10.1006/jtbi.1998.0656. [DOI] [PubMed] [Google Scholar]
- Morris C, Lecar H. Voltage oscillations in the barnacle giant muscle fiber. Biophys J. 1981;35:193–213. doi: 10.1016/S0006-3495(81)84782-0. [DOI] [PMC free article] [PubMed] [Google Scholar]
- Rinzel J. A formal classification of bursting mechanisms in excitable systems. In: Teramoto E, Yamaguti M, editors. Mathematical topics in population biology, morphogenesis and neurosciences, volume 71 of Lecture Notes in Biomathematics. Berlin: Springer–Verlag; 1987. pp. 267–281. [Google Scholar]
- Rinzel J, Ermentrout GB. Analysis of neural excitability and oscillations. In: Koch C, Segev I, editors. Methods in neuronal modeling: From synapses to networks. 2. MIT Press; Cambridge: 1998. pp. 251–292. [Google Scholar]
- Rotstein H, Wechselberger M, Kopell N. Canard induced mixed-mode oscillations in a medial entorhinal cortex layer II stellate cell model. SIAM J Dyn Syst. 2008;7:1582–1611. [Google Scholar]
- Rubin J, Wechselberger M. Giant squid-hidden canard: the 3D geometry of the Hodgkin-Huxley model. Biol Cybern. 2007;97:5–32. doi: 10.1007/s00422-007-0153-5. [DOI] [PubMed] [Google Scholar]
- Shorten PR, et al. CRH-induced electrical activity and calcium signalling in pituitary corticotrophs. J theor Biol. 2000;206:395–405. doi: 10.1006/jtbi.2000.2135. [DOI] [PubMed] [Google Scholar]
- Stern JV. Resetting behavior in a model of bursting in secretory pituitary cells: Distinguishing plateaus from pseudo-plateaus. Bull Math Biol. 2008;70:68–88. doi: 10.1007/s11538-007-9241-x. [DOI] [PubMed] [Google Scholar]
- Szmolyan P, Wechselberger M. Canards in ℝ3. J Differential Equations. 2001;177:419–453. [Google Scholar]
- Szmolyan P, Wechselberger M. Relaxation oscillations in ℝ3. J Differential Equations. 2004;200:69–104. [Google Scholar]
- Tabak J, et al. Low dose of dopamine may stimulate prolactin secretion by increasing fast potassium currents. J Comput Neurosci. 2007;22:211–222. doi: 10.1007/s10827-006-0008-4. [DOI] [PMC free article] [PubMed] [Google Scholar]
- Toporikova N, et al. A-type K+ current can act as a trigger for bursting in the absence of a slow variable. Neural Comput. 2008;20:436–451. doi: 10.1162/neco.2007.08-06-310. [DOI] [PMC free article] [PubMed] [Google Scholar]
- Tsaneva-Atanasova K, et al. Mechanism of spontaneous and receptor-controlled electrical activity in pituitary somatotrophs: experiments and theory. J Neurophysiol. 2007;98:131–144. doi: 10.1152/jn.00872.2006. [DOI] [PubMed] [Google Scholar]
- Wechselberger M. Existence and bifurcation of canards in ℝ3 in the case of a folded node. SIAM J Dyn Syst. 2005;4:101–139. [Google Scholar]
- Zhang M, et al. The Ca2+ dynamics of isolated mouse β-cells and islets: Implications for mathematical models. Biophys J. 2003;84:2852–2870. doi: 10.1016/S0006-3495(03)70014-9. [DOI] [PMC free article] [PubMed] [Google Scholar]


