Abstract
Objective
This study examined disparities in the prevalence of obesity to determine how future prevention and/or intervention efforts should be developed to remedy obesity.
Methods
We obtained individual information of sociodemographic characteristics, comorbid conditions, and lifestyle behaviors from the Boston Area Community Health (BACH) survey for 2002–2005. To account for the complex BACH sampling design, observations were weighted inversely to their probability of selection, and sampling weights were poststratified to the Boston population from the U.S. Census 2000. We tested all possible two- and three-way interaction terms from a multivariate logistic regression model.
Results
After controlling for individual determinants in detail and focusing on the population within a single city, the associations of sociodemographic characteristics, comorbid conditions, and lifestyle behaviors with obesity were consistent with previous findings. Notably, three two-way interaction terms were significantly associated with obesity: (1) race/ethnicity and gender, (2) gender and other people in the household, and (3) race/ethnicity and alcohol consumption.
Conclusions
Future obesity prevention and/or intervention programs in Boston need to be primarily gender- and racially/ethnically specific to minimize cost and maximize results. Additional considerations are needed to take into account the differences in age, the presence of other people in the household, and education level.
In the United States, the prevalence of obesity (defined as a body mass index [BMI] of ≥30 kilograms per meter squared [kg/m2]) has continued to increase during recent decades. The prevalence of obesity grew from 22.9% to 30.5% between the 1988–1994 and 1999–2000 National Health and Nutrition Examination Surveys.1 This increasing trend was observed across gender, age, racial/ethnic minority groups, and other sociodemographic characteristics.2 Regional variations are evident in the U.S., where the prevalence of obesity was higher in the South and Midwest and lower in the Northeast and West.3 Although a recent study indicated a change in the relationship between obesity and disabilities over time,4 the obese population is consistently at a higher risk of cardiovascular disease, stroke, hypertension, diabetes, and other health threats.5 With these health complications, obese individuals are confronting an economic burden associated with higher health-care and/or medical costs.6,7 Moreover, they face a lower life expectancy and are associated with increased mortality relative to those with a normal weight (BMI of 18.5 to <25.0 kg/m2).8,9 A recent study showed that obesity yields a significant increase in both cardiovascular disease- and cancer-related mortality.10
Because of the health implications of obesity, effective prevention and/or intervention programs are deemed necessary to remedy obesity.11,12 Such efforts require a comprehensive understanding of health inequalities and disparities among the population. In the U.S., significant differences are already evident by gender, age, race/ethnicity, and socioeconomic status (SES) (i.e., level of education and income).13,14 In general, women, middle-aged adults, black people, those with low educational attainment, and/or low-income individuals are more likely to be obese. Additionally, lifestyle behaviors (e.g., smoking habits, drinking patterns, and exercise routines) are known to greatly influence body weight. For instance, individuals who are cigarette smokers and moderate alcohol drinkers have a lower BMI relative to nonsmokers and non-alcohol drinkers, respectively.15,16 Those who engage in a high level of physical activity (i.e., those in a physically active occupation and those who exercise regularly during leisure time) are also less likely to become obese.17
Although these national studies are informative to a certain extent, the relationship of obesity to socio-demographic characteristics, comorbid conditions, and lifestyle behaviors is complex and dynamic. In the U.S., dramatic obesity disparities exist in the intersection among gender, race/ethnicity, and SES. For example, a higher prevalence of obesity is evident among women, racial/ethnic minority groups, and those of low SES. The underlying factors for such disparities have been associated with the differences in stress-coping strategies, occupation-related lifestyle disorders, cultural norms, as well as home and residential settings.18 Therefore, to successfully implement future obesity prevention and/or intervention efforts, identifying the target population becomes crucial to minimize cost and maximize results. Doing so requires a better understanding of the prevalence of obesity and associated disparities at greater individual detail and in a specific geographic location. Such studies can provide local authorities, decision makers, and public health professionals with insight on resource allocation.
To date, only a limited number of studies have been conducted in this capacity. Hence, this study attempts to fill this gap by examining the disparities in the prevalence of obesity in Boston, Massachusetts, using a community-based epidemiologic survey.
METHODS
Data
The Boston Area Community Health (BACH) survey was conducted using a two-stage stratified cluster design to recruit approximately equal numbers of Boston residents aged 30–79 years by gender and race/ethnicity (i.e., non-Hispanic white, non-Hispanic black, and Hispanic). In total, 5,503 participants were recruited between 2002 and 2005. Of this total, 2,301 were men and 3,202 were women; 1,859 were non-Hispanic white, 1,767 were non-Hispanic black, and 1,877 were Hispanic. Details of the BACH survey design and methodology have been previously published.19 Data considered for this study included interviewer-measured weight and height, self-reported sociodemographic characteristics, self-reported physician-diagnosed comorbid conditions, and self-reported lifestyle behaviors.
Interviewer-measured weight and height are generally more reliable than self-reported weight and height.20 BMI was calculated by the standard equation of weight (kg) divided by the square root of height (m2). A binomial response (0 = non-obese [BMI <30.0 kg/m2] and 1 = obese [BMI ≥30.0 kg/m2]) was used as a dependent variable in the subsequent analysis.
Sociodemographic characteristics were self-reported in the BACH survey questionnaire and included age (30–79 years), gender (male or female), race/ethnicity (non-Hispanic white, non-Hispanic black, or Hispanic), education level (<12 years, 12 years, 13–15 years, or ≥16 years), household income (<$30,000 [low], $30,000–$69,999 [middle], or ≥$70,000 [high]), and other people in the household (yes or no).
Most comorbid conditions were self-reported based on the history of health-care provider diagnosis (yes or no). These included the common comorbid conditions of obesity: diabetes types 1 and 2, heart conditions (heart attack, angina, coronary artery bypass surgery or stent, congestive heart failure, cardiac arrhythmia requiring a pacemaker, or heart rhythm disturbance), and vascular conditions (carotid surgery, claudication, surgery or angioplasty for arterial disease of the leg, aortic aneurysm, deep vein thrombosis, Raynauds disease, or peripheral vascular disease). Participants were considered depressed if they reported at least five of the eight symptoms of depression.21
Lifestyle behaviors were ascertained by asking about smoking (cigarettes or cigars) status (never, former, or current), daily alcohol (beer, wine, or hard liquor) consumption (0, <1, 1–2, or ≥3 drinks per day), and physical activity level. We measured physical activity by using the Physical Activity Scale for the Elderly22 and categorized it as low (<100), moderate (100-–249), or high (≥250).
Statistical analysis
To account for the complex BACH sampling design, observations were weighted inversely to their probability of selection, and sampling weights were poststratified to the Boston population from the U.S. Census 2000. Missing data were substituted by plausible values using a multiple imputation procedure in SAS®.23 In general, <1% of the data were missing on most variables with the exception of household income, in which 3%, 4%, and 11% of the data were missing for non-Hispanic white, non-Hispanic black, and Hispanic people, respectively.
We conducted bivariate analyses with the Chi-square test of association to determine the candidate independent variables for the preliminary analysis. We conducted multivariate logistic regression using SUDAAN®24 to estimate the odds ratios (ORs) and associated 95% confidence intervals (CIs).
Two- and three-way interactions
Preliminary unweighted analyses suggested some combinations of two- and three-way interaction terms. In the weighted models, three two-way interaction terms were significantly associated with obesity at p<0.05: (1) race/ethnicity and gender, (2) gender and other people in the household, and (3) race/ethnicity and alcohol consumption. To obtain estimates and appropriate 95% CIs for these two-way interaction terms, the main effects of gender, race/ethnicity, and alcohol consumption were dropped; thus, we developed the final model with these two-way interaction terms.
RESULTS
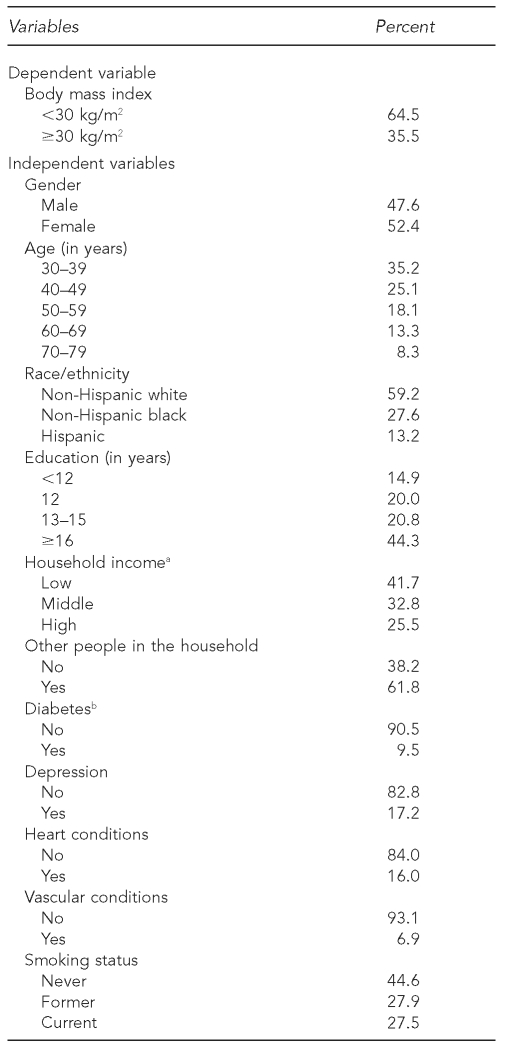
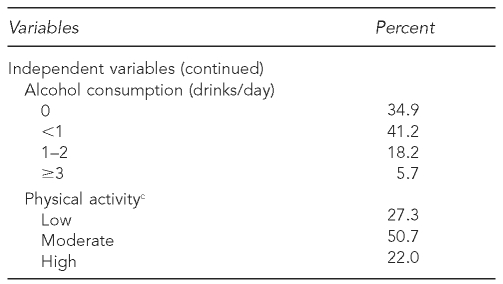
Summary statistics for the study sample are shown in Table 1. A total of 35.5% of the population aged 30–79 years was obese. The sample mirrors the Boston population in that 59.2% were non-Hispanic white, 44.3% had at least 16 years of education, 58.3% had a household income of more than $30,000, and 61.8% had other people in the household.
Table 1.
Weighted characteristics of a study sample of 30- to 79-year-olds from the Boston Area Community Health (BACH) survey, 2002–2005
aLow income refers to <$30,000 per year, middle income refers to $30,000–$69,999 per year, and high income refers to ≥$70,000 per year.
bBoth type 1 and type 2 diabetes
cLow physical activity refers to a PASE <100, moderate physical activity refers to a PASE of 100–249, and high physical activity refers to a PASE ≥250.
kg/m2 = kilograms per meter squared
PASE = Physical Activity Scale for the Elderly
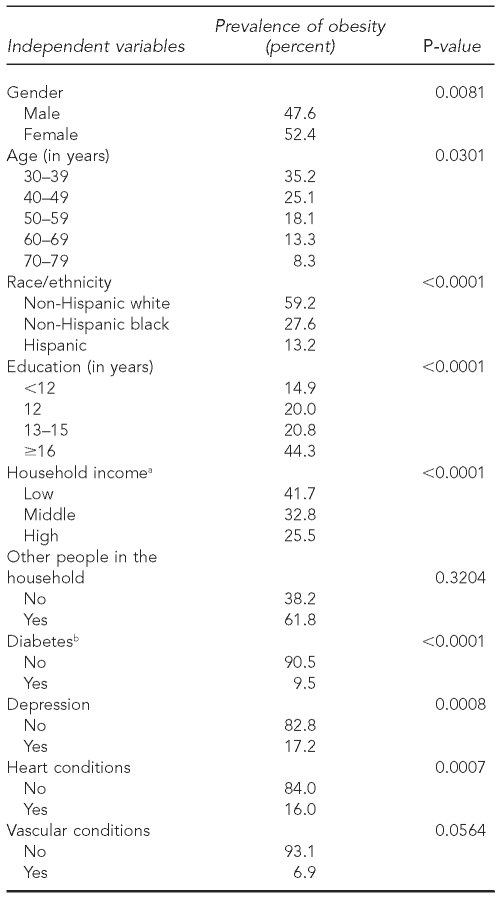
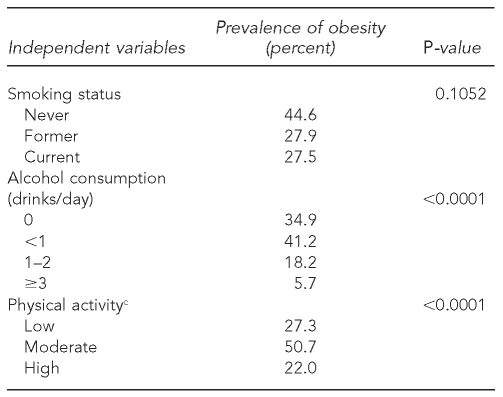
To show how these sociodemographic characteristics, comorbid conditions, and lifestyle behaviors related to obesity prevalence, bivariate associations are presented in Table 2 with corresponding p-values. Most independent variables, with the exception of other people in the household, vascular conditions, and smoking status, were significantly associated with obesity prevalence (p<0.05).
Table 2.
Bivariate associations of independent variables (sociodemographic characteristics, comorbid conditions, and lifestyle behaviors) with obesity from the Boston Area Community Health (BACH) survey, 2002–2005
aLow income refers to <$30,000 per year, middle income refers to $30,000–$69,999 per year, and high income refers to ≥$70,000 per year.
bBoth type 1 and 2 diabetes
cLow physical activity refers to a PASE <100, moderate physical activity refers to a PASE of 100–249, and high physical activity refers to a PASE ≥250.
PASE = Physical Activity Scale for the Elderly
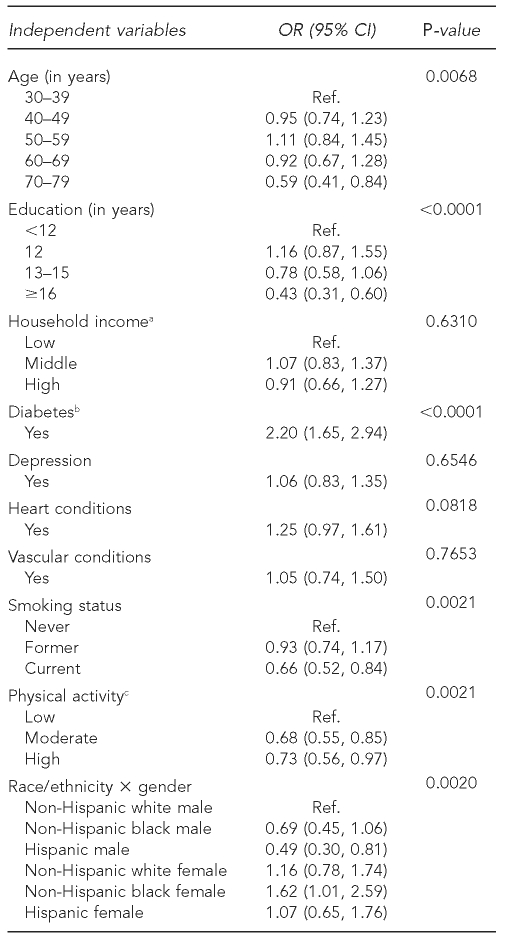
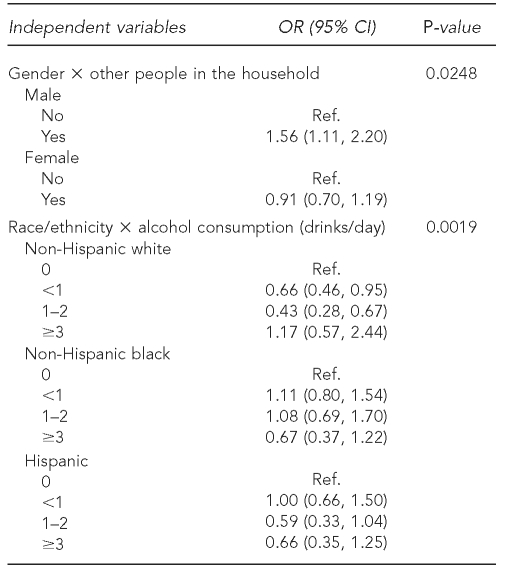
To determine how these factors were associated with obesity, we conducted a multivariate logistic regression that tested for all possible two- and three-way interaction terms. Among them, three two-way interaction terms were significantly associated with obesity (p<0.05), as previously mentioned: (1) race/ethnicity and gender, (2) gender and other people in the household, and (3) race/ethnicity and alcohol consumption. Results from the model excluding the main effects of gender, race/ethnicity, and alcohol consumption are presented in Table 3 with estimated ORs and associated 95% CIs.
Table 3.
Estimated odds ratios (from a multivariate logistic regression model) of independent variables (sociodemographic characteristics, comorbid conditions, and lifestyle behaviors) for obesity from the Boston Area Community Health (BACH) survey, 2002–2005
aLow income refers to <$30,000 per year, middle income refers to $30,000–$69,999 per year, and high income refers to ≥$70,000 per year.
bBoth type 1 and type 2 diabetes
cLow physical activity refers to a PASE <100, moderate physical activity refers to a PASE of 100–249, and high physical activity refers to a PASE ≥250.
OR = odds ratio
CI = confidence interval
Ref. = reference group
PASE = Physical Activity Scale for the Elderly
Within the sociodemographic variables, age group and education level were statistically significant (p<0.05). Relative to those aged 30–39 years, the 70- to 79-year-olds had 0.59 (95% CI 0.41, 0.84) lower odds of being obese. Compared with those who had less than 12 years of education, having 13–15 years of education reduced the odds of being obese by 0.78 (95% CI 0.58. 1.06) and having more than 16 years of education reduced the odds further to 0.43 (95% CI 0.31, 0.60). Among comorbid conditions, only diabetes was significantly associated with obesity (p<0.0001). People with diabetes had more than twice the odds of being obese as those without diabetes (OR=2.20, 95% CI 1.65, 2.94). Lifestyle behaviors were all statistically significant. Current smokers were less likely to be obese than never smokers (OR=0.66, 95% CI 0.52, 0.84; p=0.0021). Physical activity was an important lifestyle behavior in that individuals with moderate and high levels of physical activity were less likely to be obese than those with low levels of physical activity (p=0.0021).
Three two-way interaction terms revealed significant gender and racial/ethnic differences. First, the prevalence of obesity showed different patterns by gender and race/ethnicity (p=0.0020). Notably, compared with non-Hispanic white men, Hispanic men were least likely to be obese (OR=0.49, 95% CI 0.30, 0.81) and non-Hispanic black women were more likely to be obese (OR=1.62, 95% CI 1.01, 2.59). Second, the presence of other people in the household showed a different influence on gender (p=0.0248). Men who had other people in the household were more likely to be obese than those who lived alone (OR=1.56, 95% CI 1.11, 2.20), but this was not the case for women (OR=0.91, 95% CI 0.70, 1.19). Third, the effect of alcohol consumption varied according to race/ethnicity (p=0.0019). Relative to abstainers, fewer than three servings of alcohol per day reduced the odds of being obese among non-Hispanic white people but not among other racial/ethnic minority groups.
DISCUSSION
Using a cross-sectional analysis of a diverse community-based sample in Boston, this study examined the disparities in obesity prevalence by controlling for individual determinants in detail and focusing on a specific geographic location. The associations of -sociodemographic characteristics, comorbid conditions, and lifestyle behaviors with obesity were consistent with previous findings.13–17 Among the possible two- and three-way interaction terms, three two-way interaction terms were significantly associated with obesity: (1) race/ethnicity and gender, (2) gender and other people in the household, and (3) race/ethnicity and alcohol consumption.
The results of this study indicated that (1) relative to 30- to 39-year-olds, seniors were less likely to be obese; (2) having a higher level of education, especially completing a bachelor's degree, significantly reduced the odds of obesity compared with having less than a high school education; (3) people with diabetes were more than twice as likely to be obese as those without diabetes; (4) current smokers were less likely to be obese compared with never smokers; (5) physically active individuals were less likely to be obese than those who were physically inactive; (6) the prevalence of obesity showed different patterns by gender and race/ethnicity; (7) the presence of other people in the household had a different influence on gender; and (8) the effect of alcohol consumption varied by race/ethnicity. These in turn implied that the household income is not the driving factor of obesity after adjusting for comorbid conditions, lifestyle behaviors, and inherent interaction terms of gender and race/ethnicity. In particular, the results of three two-way interaction terms suggest that gender and racial/ethnic differences appear to play a vital role in the prevalence of obesity.
As part of a long-term solution, therefore, changes in both the societal and individual settings are key to properly balance the energy intake and energy expenditure.11,12 Strategies for change include altering the contextual environment (e.g., community/neighborhood and work/school/home settings). In the U.S., the Centers for Disease Control and Prevention recommends community-based strategies as a starting point of the prevention effort.25 Although more research is needed to specify the most effective program, a recent review emphasized the need for multifactorial interventions combining diet, physical activity, and behavior change components, along with a general message or more personalized advice.26 More intensive efforts have not always been successful, and a low-intensity program with tailored and personalized supports (e.g., providing frequent personal contact) is more likely to help participants meet their goals.
Change in daily and lifestyle behavior is difficult to sustain unless individuals have support. Consequently, accompanying the efforts to change with family involvement, as opposed to individual efforts alone, may provide a successful means for effective obesity prevention and/or intervention programs.27 Family rules and support can play a vital role in inducing changes both in the individual and in other family members.
Regarding the design of future strategies, this study points out several issues that need to be addressed. First, although smoking status significantly reduced the odds of obesity, the health risks of smoking are a well-known fact. Thus, it is important to incorporate an element of weight-gain prevention in the smoking cessation program. Different types of strategies are needed depending on gender and the number of cigarettes per day of the smoker over the years.15 Second, even though the effect of alcohol consumption varied by race/ethnicity, inappropriate alcohol consumption may conversely contribute as an extra energy source and/or facilitate additional food intake.16 Therefore, a guideline to adopt a habit of consuming alcohol should not be recommended without careful consideration. Third, physical activity was an important lifestyle behavior that resulted in decreased likelihood of obesity. A combination of factors related to individual, social, and physical environment induces people to be physically active.28 It has been found that social supports and social networks as well as accessibility, opportunities, and aesthetic quality of the physical environment encourage people to engage in physical activity.29,30 Accordingly, the redesign of both the social and physical environment should be integrated in planning future obesity prevention and/or intervention programs.
Three statistically significant two-way interaction terms indicated that intervention strategies in Boston need to be primarily gender- and racially/ethnically specific. In the U.S., unhealthy implications for weight-control behavior are related to body image discrepancy across gender and racial/ethnic minority groups.31 Non-Hispanic white women, in particular, had the most distorted view toward the ideal body image, which contributed to their efforts to keep weight down. On the other hand, non-Hispanic black women were more accepting of larger body sizes, which led to less concern about their weight.32 Self-esteem seems to be the main factor that shapes an individual's preferred or actual body weight, and not other aspects of psychological, social, and sexual functioning in both men and women.33 Therefore, self-esteem might provide a basic perception of the two-way interaction terms found in this study. However, the successful implementation of obesity prevention and/or intervention programs would require further prospective cohort and/or experimental studies to better understand the mechanisms behind this phenomenon.
Limitations
This study had several limitations. First, this study was cross-sectional in nature and could not infer causality; thus, the interpretation of the impact is restricted. Second, this was an observational study that may not have taken into account other potentially important and/or significant factors associated with the prevalence of obesity in Boston. Third, this study did not include a number of other racial/ethnic minority groups (e.g., Asian Americans and Native Americans) because Boston does not have people of other racial/ethnic minority groups in sufficient numbers to include them given the survey sampling design. Fourth, the use of BMI may have misclassified some participants in the study population who had different body composition and yet had the same BMI.
Fifth, this study did not account for energy, food, and/or nutrition intakes. An increase in food portion size has resulted in a parallel increase in body weight during the past couple of decades.34 Meal patterns, food portion sizes, and quality of foods are associated with weight gain in that they may distort healthy eating habits and appropriate food selection.35,36 A high consumption of sugar-sweetened beverages will also result in weight gain.37,38 Thus, it is possible that these factors played a critical role in increasing the BMI. Finally, this study did not control for environmental and/or neighborhood influences.
The prevalence of obesity is considered a response to the contemporary built environment that promotes an unlimited supply of convenient, relatively inexpensive, highly palatable, and energy-dense foods coupled with a lifestyle that requires less daily physical activity than in the past.39,40 A high likelihood of becoming obese is related to urban design, walking distances, and amount of time spent in the car.41 Therefore, these environmental and/or neighborhood factors may have acted as constraints to healthy living against the will of the residents.
Finally, it may not be possible to generalize the findings of this study to populations in other domestic and foreign cities. Because regional variations of obesity prevalence are already evident in the U.S.,3 careful consideration is necessary to avoid misinterpretation of the results. The results may be innate to spatial and temporal constraints, such that the influences and relationships identified in this study are specific to Boston between 2002 and 2005 when the BACH survey was conducted.
CONCLUSIONS
This study is among the few in which disparities in the prevalence of obesity were examined by controlling for individual determinants in detail and focusing on the population within a single city. The associations of sociodemographic characteristics, comorbid conditions, and lifestyle behaviors with obesity were consistent with previous findings. These findings imply that future obesity prevention and/or intervention programs in Boston need to be gender- and racially/ethnically specific. Additional considerations are needed to take into account the differences in age group, the presence of other people in the household, and the level of education. These results provide insights for local authorities, decision makers, and public health professionals to determine to whom efforts should be targeted and how resources should be allocated to remedy obesity.
Because the BACH survey was designed to be longitudinal,19 a follow-up survey is currently underway. Therefore, future efforts will address some of the aforementioned shortcomings and limitations. Efforts will include conducting a multilevel analysis to examine the contextual influence and/or conducting a longitudinal analysis to investigate causality. Considering the complex and dynamic nature of obesity, future efforts are likely to add more valuable insights to efforts to combat the rising obesity epidemic. This article is the first in a series and will be followed by more comprehensive investigations.
REFERENCES
- 1.Flegal KM, Carroll MD, Ogden CL, Johnson CL. Prevalence and trends in obesity among US adults, 1999–2000. JAMA. 2002;288:1723–7. doi: 10.1001/jama.288.14.1723. [DOI] [PubMed] [Google Scholar]
- 2.Mokdad AH, Ford ES, Bowman BA, Dietz WH, Vinicor F, Bales VS, et al. Prevalence of obesity, diabetes, and obesity-related health risk factors, 2001. JAMA. 2003;289:76–9. doi: 10.1001/jama.289.1.76. [DOI] [PubMed] [Google Scholar]
- 3.State-specific prevalence of obesity among adults—United States, 2007. MMWR Morb Mortal Wkly Rep. 2008;57(28):765–8. [PubMed] [Google Scholar]
- 4.Alley DE, Chang VW. The changing relationship of obesity and disability, 1998–2004. JAMA. 2007;298:2020–7. doi: 10.1001/jama.298.17.2020. [DOI] [PubMed] [Google Scholar]
- 5.Pi-Sunyer FX. Health implications of obesity. Am J Clin Nutr. 1991;53(6) Suppl:1595S–603S. doi: 10.1093/ajcn/53.6.1595S. [DOI] [PubMed] [Google Scholar]
- 6.Finkelstein EA, Trogdon JG, Brown DS, Allaire BT, Dellea PS, Kamal-Bahl SJ. The lifetime medical cost burden of overweight and obesity: implications for obesity prevention. Obesity (Silver Spring) 2008;16:1843–8. doi: 10.1038/oby.2008.290. [DOI] [PubMed] [Google Scholar]
- 7.Wee CC, Phillips RS, Legedza AT, Davis RB, Soukup JR, Colditz GA, et al. Health care expenditures associated with overweight and obesity among US adults: importance of age and race. Am J Public Health. 2005;95:159–65. doi: 10.2105/AJPH.2003.027946. [DOI] [PMC free article] [PubMed] [Google Scholar]
- 8.Fontaine KR, Redden DT, Wang C, Westfall AO, Allison DB. Years of life lost due to obesity. JAMA. 2003;289:187–93. doi: 10.1001/jama.289.2.187. [DOI] [PubMed] [Google Scholar]
- 9.Flegal KM, Graubard BI, Williamson DF, Gail MH. Excess deaths associated with underweight, overweight, and obesity. JAMA. 2005;293:1861–7. doi: 10.1001/jama.293.15.1861. [DOI] [PubMed] [Google Scholar]
- 10.Flegal KM, Graubard BI, Williamson DF, Gail MH. Cause-specific excess deaths associated with underweight, overweight, and obesity. JAMA. 2007;298:2028–37. doi: 10.1001/jama.298.17.2028. [DOI] [PubMed] [Google Scholar]
- 11.Jackson MY, Proulx JM, Pelican S. Obesity prevention. Am J Clin Nutr. 1991;53(6) Suppl:1625S–30S. doi: 10.1093/ajcn/53.6.1625s. [DOI] [PubMed] [Google Scholar]
- 12.Kumanyika S, Jeffery RW, Morabia A, Ritenbaugh C, Antipatis VJ. Obesity prevention: the case for action. Int J Obes Relat Metab Disord. 2002;26:425–36. doi: 10.1038/sj.ijo.0801938. [DOI] [PubMed] [Google Scholar]
- 13.Paeratakul S, Lovejoy JC, Ryan DH, Bray GA. The relation of gender, race and socioeconomic status to obesity and obesity comorbidities in a sample of US adults. Int J Obes Relat Metab Disord. 2002;26:1205–10. doi: 10.1038/sj.ijo.0802026. [DOI] [PubMed] [Google Scholar]
- 14.Harper S, Lynch J. Trends in socioeconomic inequalities in adult health behaviors among U.S. states, 1990–2004. Public Health Rep. 2007;122:177–89. doi: 10.1177/003335490712200207. [DOI] [PMC free article] [PubMed] [Google Scholar]
- 15.John U, Hanke M, Rumpf HJ, Thyrian JR. Smoking status, cigarettes per day, and their relationship to overweight and obesity among former and current smokers in a national adult general population sample. Int J Obes (Lond) 2005;29:1289–94. doi: 10.1038/sj.ijo.0803028. [DOI] [PubMed] [Google Scholar]
- 16.Breslow RA, Smothers BA. Drinking patterns and body mass index in never smokers: National Health Interview Survey, 1997–2001. Am J Epidemiol. 2005;161:368–76. doi: 10.1093/aje/kwi061. [DOI] [PubMed] [Google Scholar]
- 17.King GA, Fitzhugh EC, Bassett DR, Jr, McLaughlin JE, Strath SJ, Swartz AM, et al. Relationship of leisure-time physical activity and occupational activity to the prevalence of obesity. Int J Obes Relat Metab Disord. 2001;25:606–12. doi: 10.1038/sj.ijo.0801583. [DOI] [PubMed] [Google Scholar]
- 18.Walker R, Kawachi I. Race, ethnicity and obesity. In: Cawley J, editor. The Oxford handbook of the social science of obesity. New York: Oxford University Press; 2011. pp. 257–75. [Google Scholar]
- 19.McKinlay JB, Link CL. Measuring the urologic iceberg: design and implementation of the Boston Area Community Health (BACH) survey. Eur Urol. 2007;52:389–96. doi: 10.1016/j.eururo.2007.03.013. [DOI] [PMC free article] [PubMed] [Google Scholar]
- 20.Larson MR. Social desirability and self-reported weight and height. Int J Obes Relat Metab Disord. 2000;24:663–5. doi: 10.1038/sj.ijo.0801233. [DOI] [PubMed] [Google Scholar]
- 21.Turvey CL, Wallace RB, Herzog R. A revised CES-D measure of depressive symptoms and a DSM-based measure of major depressive episodes in the elderly. Int Psychogeriatr. 1999;11:139–48. doi: 10.1017/s1041610299005694. [DOI] [PubMed] [Google Scholar]
- 22.Washburn RA, Smith KW, Jette AM, Janney CA. The Physical Activity Scale for the Elderly (PASE): development and evaluation. J Clin Epidemiol. 1993;46:153–62. doi: 10.1016/0895-4356(93)90053-4. [DOI] [PubMed] [Google Scholar]
- 23.SAS Institute, Inc. SAS®: Version 9.2. Cary (NC): SAS Institute, Inc; 2008. [Google Scholar]
- 24.Research Triangle Institute. SUDAAN®: Version 10.0.1. Research Triangle Park (NC): Research Triangle Institute; 2009. [Google Scholar]
- 25.Recommended community strategies and measurements to prevent obesity in the United States. MMWR Morb Mortal Wkly Rep. 2009;58(RR-7):1–26. [PubMed] [Google Scholar]
- 26.Lombard CB, Deeks AA, Teede HJ. A systematic review of interventions aimed at the prevention of weight gain in adults. Public Health Nutr. 2009;12:2236–46. doi: 10.1017/S1368980009990577. [DOI] [PubMed] [Google Scholar]
- 27.Gruber KJ, Haldeman LA. Using the family to combat childhood and adult obesity. Prev Chronic Dis. 2009;6:A106. [PMC free article] [PubMed] [Google Scholar]
- 28.Giles-Corti B, Donovan RJ. Relative influences of individual, social environmental, and physical environmental correlates of walking. Am J Public Health. 2003;93:1583–9. doi: 10.2105/ajph.93.9.1583. [DOI] [PMC free article] [PubMed] [Google Scholar]
- 29.McNeill LH, Kreuter MW, Subramanian SV. Social environment and physical activity: a review of concepts and evidence. Soc Sci Med. 2006;63:1011–22. doi: 10.1016/j.socscimed.2006.03.012. [DOI] [PubMed] [Google Scholar]
- 30.Humpel N, Owen N, Leslie E. Environmental factors associated with adult's participation in physical activity: a review. Am J Prev Med. 2002;22:188–99. doi: 10.1016/s0749-3797(01)00426-3. [DOI] [PubMed] [Google Scholar]
- 31.Fitzgibbon ML, Blackman LR, Avellone ME. The relationship between body image discrepancy and body mass index across ethnic groups. Obes Res. 2000;8:582–9. doi: 10.1038/oby.2000.75. [DOI] [PubMed] [Google Scholar]
- 32.Demarest J, Allen R. Body image: gender, ethnic, and age differences. J Soc Psychol. 2000;140:465–72. doi: 10.1080/00224540009600485. [DOI] [PubMed] [Google Scholar]
- 33.Davison TE, McCabe MP. Relationship between men's and women's body image and their psychological, social, and sexual functioning. Sex Roles. 2005;52:463–75. [Google Scholar]
- 34.Young LR, Nestle M. The contribution of expanding portion sizes to the US obesity epidemic. Am J Public Health. 2002;92:246–9. doi: 10.2105/ajph.92.2.246. [DOI] [PMC free article] [PubMed] [Google Scholar]
- 35.Ello-Martin JA, Ledikwe JH, Rolls BJ. The influence of food portion size and energy density on energy intake: implications for weight management. Am J Clin Nutr. 2005;82(1) Suppl:236S–41S. doi: 10.1093/ajcn/82.1.236S. [DOI] [PubMed] [Google Scholar]
- 36.Pearcey SM, de Castro JM. Food intake and meal patterns of weight-stable and weight-gaining persons. Am J Clin Nutr. 2002;76:107–12. doi: 10.1093/ajcn/76.1.107. [DOI] [PubMed] [Google Scholar]
- 37.Malik VS, Schulze MB, Hu FB. Intake of sugar-sweetened beverages and weight gain: a systematic review. Am J Clin Nutr. 2006;84:274–88. doi: 10.1093/ajcn/84.1.274. [DOI] [PMC free article] [PubMed] [Google Scholar]
- 38.Vartanian LR, Schwartz MB, Brownell KD. Effects of soft drink consumption on nutrition and health: a systematic review and meta-analysis. Am J Public Health. 2007;97:667–75. doi: 10.2105/AJPH.2005.083782. [DOI] [PMC free article] [PubMed] [Google Scholar]
- 39.Hill JO, Peters JC. Environmental contributions to the obesity epidemic. Science. 1998;280:1371–4. doi: 10.1126/science.280.5368.1371. [DOI] [PubMed] [Google Scholar]
- 40.Hill JO, Wyatt HR, Reed GW, Peters JC. Obesity and the environment: where do we go from here? Science. 2003;299:853–5. doi: 10.1126/science.1079857. [DOI] [PubMed] [Google Scholar]
- 41.Frank LD, Andresen MA, Schmid TL. Obesity relationships with community design, physical activities, and time spent in cars. Am J Prev Med. 2004;27:87–96. doi: 10.1016/j.amepre.2004.04.011. [DOI] [PubMed] [Google Scholar]


