

Abstract
Pay-for-performance initiatives in medicine are proliferating rapidly. Neonatal intensive care is a likely target for these efforts because of the high cost, available databases, and relative strength of evidence for at least some measures of quality. Pay-for-performance may improve patient care but requires valid measurements of quality to ensure that financial incentives truly support superior performance. Given the existing uncertainty with respect to both the effectiveness of pay-for-performance and the state of quality measurement science, experimentation with pay-for-performance initiatives should proceed with caution and in controlled settings. In this article, we describe approaches to measuring quality and implementing pay-for-performance in the NICU setting.
Keywords: pay-for-performance programs, quality improvement
Large deficits in quality of care remain more than half a decade after the Institute of Medicine (IOM) provided a blueprint for improvement.1 In neonatology, there is persistent unexplained variation in health care delivery and outcomes.2–8 To date, quality improvement (QI) efforts, either locally or as part of collaborative efforts, have had mixed results.9–17 The broad-based improvement envisioned by health care payers and the IOM has not occurred. (In this article, we use the term “payer” to mean the broad group of employers, purchasers, insurers, and health care plans that pay for health care services directly or indirectly.)
One factor that is receiving increasing attention is a reimbursement system that may actively discourage QI.1 For example, in December 2003, the New York Times described how Intermountain Health Care, a network of 21 hospitals in Utah and Idaho, was punished financially by Medicare for saving lives and cutting costs.18 Reimbursement decreased because better care resulted in lower complication rates. In health care, the financial benefits of QI often accrue primarily to payers and patients and not to providers. Pay-for-performance represents an attempt to correct this imbalance and to provide incentives for quality to providers.19
By paying providers according to the quality of care they deliver, pay-for-performance schemes attempt to align the interests of health care payers, patients, and providers, ensuring that providers act in the other parties' best interest.20,21 Pay-for-performance initiatives provide financial motivation but may also introduce competitive motivational incentives by comparing the performance of providers again each other or against a standard of care (benchmarking). Pay-for-performance programs thus hold promise for QI by generating both intrinsic (motivation) and extrinsic (reputation and financial rewards) performance incentives.22–24 Although relatively little evidence for their effectiveness has been accumulated to date, 2 comprehensive reviews of the topic found moderate benefits of pay-for-performance and drew cautiously optimistic conclusions about its potential to improve quality of care.25,26 In one review, 14 of 17 studies showed partial or positive effects on quality of care.26 However, it should be noted that, in some studies, improvement owed more to improved documentation than to actual changes in care delivery.27–29 Only 3 studies were carried out in the pediatric population, and all targeted preventive care services in the general pediatric health care delivery setting.26
Despite some ambiguity in early evaluations, the IOM has endorsed ongoing experimentation with pay-for-performance,30 and payers are enthusiastic about its potential to improve the value of health care purchasing.31 There are now >100 active pay-for-performance projects throughout the country.19,24 In addition, legislative initiatives aim to incorporate incentives for quality into Medicare's payment systems.32 Although to our knowledge pay-for-performance approaches have not been applied in the NICU, we think that the NICU is a prime target for payers because of the high cost, available databases, relative strength of research evidence, and, compared with adult settings, low incidence of comorbidities. The latter makes it easier to attribute performance to providers, rather than to patients.
Unfortunately, many pay-for-performance projects are implemented in an uncontrolled manner, making it unclear whether the benefits are truly attributable to the financial incentives.26 Rigorous research designs and methods are necessary to determine whether performance-based payment arrangements result in meaningful QI and are cost-effective. For example, 2 of us (Drs Petersen and Profit) are conducting a prospective, multicenter, cluster-randomized, controlled trial to study the effects of the pay-for-performance approach on quality of care and hypertension control in adults (L.A.P., L. D. Woodard, MD, T. Urech, MPH, et al, unpublished data, 2007). That trial should add to the body of literature on pay-for-performance and shed light on the benefits and costs of different choices in incentive design. It uses physician- and group-level financial incentives, plus audit and feedback, to improve quality of care. More such trials need to be designed to evaluate the effectiveness of pay-for-performance in a variety of care settings and for a spectrum of clinical situations. Our recommendations for implementing quality assessment and financial incentives for future pay-for-performance initiatives in neonatology are described below and summarized in Table 1.
TABLE 1. Recommendations for Adapting Pay-for-Performance to the NICU Setting.
| Quality measurement | |
| Method | Composite indicator |
| Source | Clinical database |
| Incentive design | |
| Incentive structure | Combination (noncompetitive and competitive) |
| Payment structure | Bonus |
| Payment frequency | At least yearly |
| Recipient | Group incentive |
| Amount | 5% to 10% |
Measuring Quality
General Approach
Defining and measuring quality is central to a pay-for-performance program's relevance and ability to meet its objectives. Careful attention to quality measurement is also important for the feasibility of implementation, because physician opposition to pay-for-performance in health care is often grounded in questions about the basic validity, fairness, and meaningfulness of the assessment methods. A fair and scientifically sound approach to quality measurement may enhance provider acceptance and alleviate concerns that pay-for-performance is primarily a cost-cutting measure, rather than a QI tool. Although policymakers and payers are moving ahead with pay-for-performance, the science of quality measurement has not kept pace, which has created a serious disconnection between policy intentions and potential outcomes. Measures that define clinical quality too narrowly or lack the support of empirical evidence are unlikely to yield the desired improvements in health care quality. Furthermore, the process of measurement should minimize undesirable secondary effects on physician behavior. For example, when pay-for-performance initiatives provide financial incentives for quality, measures that are not adjusted for clinical risk offer an incentive for providers to avoid treating the sickest patients.
Framework for Measuring Quality
Generally, quality of care is defined within a multidimensional framework. For example, the IOM has suggested that quality of care is a reflection of care in the domains of patient safety, effectiveness, efficiency, patient-centeredness, timeliness, and equity.1 The dimensions of the quality of health care delivered by a NICU may also be described by its physical and organizational composition (structure of care), by the clinical care interactions between patients and providers (process of care), and by patient outcomes, in terms of morbidity, death, and caregiver satisfaction (outcomes of care).33 Measures of structure, process, and outcome have distinct advantages and disadvantages. For example, structural measures (eg, the availability of electronic health records) are easy to obtain and measure but are theoretically distant from the ultimate goal of improving health outcomes. Process measures may be more sensitive to differences in quality of care but require that there be good evidence for a direct link between the process and clinical outcomes. Outcome measures are perhaps of greatest intrinsic value, because they reflect directly what patients and providers truly care about, but they may occur too infrequently to provide statistically meaningful results (eg, death)34 or may occur so far in the future (eg, developmental delay) that data collection efforts become impractical or burdensome.
Ideally, we think that an assessment of quality should incorporate the full range of quality-of-care dimensions, with indicators that are valid, reliable, feasible to collect, and relevant to important domains of care. Quality assessment is a dynamic process and, especially within pay-for-performance schemes, should reinforce providers' control over their performance. Accordingly, indicators should be not only theoretically sound but also actionable; that is, indicators should be responsive to change within a timely period and should be unambiguous with respect to interpretation. Importantly, measures must be standardized and adjusted for clinical risk, and data collection must be adequately simplified to ensure uniformity of definitions.35
Figure 1 presents a proposed framework for neonatal quality measurement. Pay-for-performance programs attempt to measure and reward the quality of the products of the health care delivery system. The outcomes of the health care delivery system are influenced by individual and societal determinants of health,36 as well as the design of the health system.37 The combination of the structure/process/outcome framework of quality with that of the IOM results in a quality-of-care matrix that forms an inclusive framework for measuring quality. In our opinion, this could address some of the shortfalls of focusing on individual measures. Although identifying the specific indicators for each of these domains of quality might prove challenging, this framework provides a guide to practitioners and researchers in an ongoing effort to refine quality measurement. Evidence-based expert consensus38,39 could be used to fill the matrix and to generate measures for quality-monitoring or pay-for-performance initiatives.
FIGURE 1.
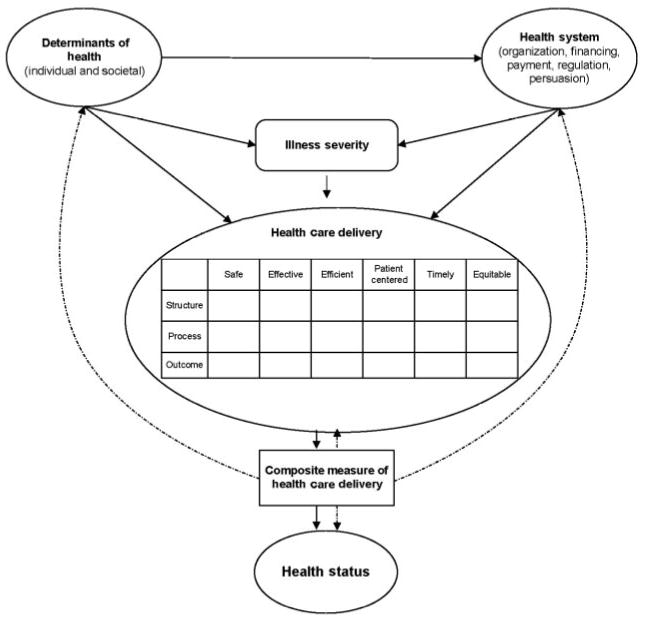
Theoretical framework for measuring the quality of neonatal intensive care. Solid arrows indicate interactions, and dashed arrows indicate the potential use of a composite indicator to measure health care delivery, to predict health status, and to guide health policy-making at the health systems and societal levels.
Composite Indicators
To benchmark and to reward NICUs for high quality of care that has been assessed across several dimensions, the individual dimensional measures of quality need to be combined and aggregated into a summary measure or composite indicator of quality. Such a composite indicator reflects judgments regarding the relative importance of each measure. In other fields of medicine, composite indicators (or scorecards) that capture multiple dimensions of quality have improved the quality of health care institutions,20,40–43 providers,44,45 and patient care.20,46,47 A composite indicator of NICU quality could offer performance targets for improvement by showing the gaps between NICU performance and benchmarks. It could provide a foundation for the development of public and private policy action and a yardstick against which to measure the success of new policies. Although the literature describes many different guidelines and methods for constructing composite indicators, a particularly explicit methodical approach has been described by the Organisation of Economic Cooperation and Development (OECD)48 and applied to several indicators of country performance. Crucially, the OECD guidelines ensure transparency of the composite indicator-building process and promote internal and external statistical and methodologic consistency, an improvement over many currently applied methods.49
OECD Guidelines for Constructing Composite Indicators
Briefly, the OECD suggests a 10-step building process)48 (Table 2). At each step, researchers must choose from several available options, depending on the underlying data and the purpose of the composite indicator.
TABLE 2. Developing a Composite Indicator.
| Step | Description |
|---|---|
| 1 | Development of a theoretical framework |
| 2 | Measure selection |
| 3 | Initial data analysis |
| 4 | Imputation of missing data |
| 5 | Normalization |
| 6 | Weighting and aggregation |
| 7 | Uncertainty and sensitivity analysis |
| 8 | Linkage to other variables |
| 9 | Deconstruction of the composite indicator |
| 10 | Presentation and dissemination |
Step 1 is development of a theoretical framework. This step defines the construct to be measured, identifies desirable subindicators, and establishes guidelines for selecting them.
Step 2 is measure selection. Importance, accuracy, and feasibility guide the selection of quality-of-care indicators. The medical literature and expert opinion can provide guidance.
Step 3 is initial data analysis. The underlying nature of the data must be explored and appropriate transformations made with regard to directionality of measures, outliers, ceiling effects, and nature of distributions.
Step 4 is imputation of missing data. The impact of missing data on the performance measurement must be examined, because the data may contain significant bias if providers avoid reporting poor outcomes.
Step 5 is normalization of data. For linkage of measures, the measures must be transformed into a common unit of measurement. There are many options for normalization, including ranking, standardization, and distance to a reference.
Step 6 is weighting and aggregation. This is a crucial step in the development of a composite indicator, because the attribution of weights to different measures and their aggregation can have significant influences on performance. The 2 basic approaches used to arrive at subindicator weights include statistical (eg, principal-component analysis, factor analysis, multivariate techniques, and others) and participatory (variations on elicitation of expert opinion) methods. It is important to realize that equal weighting does not imply an absence of weights, because with this approach each subindicator is given a weight of 1. The benefit of the statistical approach includes its relative fairness and freedom from bias in deriving weights based on purely statistical grounds. Its disadvantage is that the weights may not correspond to real-world common sense.
In the aggregation phase, the subindicators are aggregated into a composite indicator. The primary decision involved in choosing an aggregation method is whether NICUs should be allowed to compensate for poor performance in one subindicator with superior performance in others. There are 3 principal choices, namely, full compensation (linear additive aggregation), partial compensation (geometric or multiplicative aggregation), and no compensation (noncompensatory methods). Each of these choices has benefits and drawbacks.
Step 7 is uncertainty and sensitivity analysis. There are 2 primary sources of error in performance measurement, that is, the effect of the error contained within the underlying data (uncertainty analysis) and the impact of different choices in constructing the composite indicator (sensitivity analysis). These error sources can be combined and their effect displayed in a higher-order Monte Carlo experiment.
Step 8 is linkage to other variables. Composite indicators for some fields of medicine might be combined with those in others, potentially yielding greater insights across care settings or longitudinally. Entire networks of care could be compared with respect to their performance in managing acute and chronic care (ie, combining NICU care with follow-up care).
Step 9 is deconstruction of the composite indicator. Both summary scores and performance on individual measures can be displayed to guide health policy-making and future research. This allows stakeholders to identify areas of weakness and strengths.
Step 10 is presentation and dissemination. Results can be presented in user-friendly formats such as charts that include measures of uncertainty (confidence intervals). Electronic publications can link to additional details on individual subindicators.
Measuring Quality in the NICU Setting
Data collection efforts in neonatology are better developed than in many clinical specialties. The Vermont Oxford Network collects validated data from >600 NICUs throughout the world.50 In California, 120 NICUs submit an expanded data set, with core elements identical to those collected by the Vermont Oxford Network, to the California Perinatal Quality Care Collaborative (CPQCC). These data are used to prepare confidential reports for each NICU and to prepare the California Children's Services mandated yearly activity and outcomes report, which CPQCC submits on behalf of requesting NICUs. A quality indicator based on routinely collected data could thus be used for comparative benchmarking efforts involving pay-for-performance programs. We are currently working to develop such an indicator by using the CPQCC database. A possible representation of NICU quality measures within the matrix is given in Fig 2.
FIGURE 2.
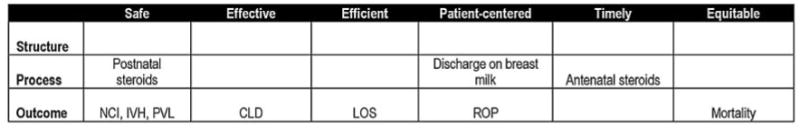
Quality matrix filled with measures from the CPQCC database. NCI indicates nosocomial infections; CLD, chronic lung disease; LOS, length of stay; ROP, retinopathy of prematurity; IVH, intraventricular hemorrhage; PVL, periventricular leukomalacia. Only severe degrees of retinopathy of prematurity and intraventricular hemorrhage would be included.
A danger of tying payments to performance is that data quality may suffer as providers use undesirable behaviors, such as omitting poor outcomes from their reports, in order to improve their ratings without improving actual performance. Minimizing such behaviors will require costly, ongoing validation of randomly sampled data, a significant disadvantage of pay-for-performance initiatives. Several other challenges to measuring quality are particularly prominent in the NICU setting and require special attention.
The first challenge involves the diversity of populations. Pathologic conditions, care practices, and outcomes vary widely for patients in different gestational age groups, requiring in some instances both stratum-specific analyses and individualized quality-of-care measures for specific subpopulations, such as extremely premature infants, infants requiring complex surgery, and infants with congenital anomalies. Rather than attempting to measure care for all groups at once, stakeholders should focus on developing quality measures for patient groups that are commonly represented in NICUs (very low birth weight infants, moderately premature infants, and term infants).
The second challenge involves the limit of viability. There is no consensus regarding the treatment of patients born at gestational ages of <25 weeks.51 This group of patients may require a special set of quality markers that relate more to patient satisfaction with care or documentation of parental education than patient-specific outcome measures.
The third challenge involves patient transfers. It is currently difficult to track patients' hospital stays across multiple institutions of care. This may induce significant bias, because NICUs might transfer their highest-risk patients to other hospitals.52 Another source of bias stems from the differing availability of back-transports across NICUs. Lengths of stays are increased in NICUs where opportunities for back-transport are limited. Evaluations of quality therefore need to account for transfer bias. Risk adjustment should also account for the location of birth (inborn/outborn). Ultimately, improvements in patient tracking may eliminate this problem.
Design of the Financial Incentive
Overall Design
Designing financial incentives is a complex process involving decisions about the structure of the incentive (competitive or noncompetitive), the recipient of the incentive, the amount of the incentive, the structure of the payment, and the frequency of payment. Choices in any of these categories have advantages and disadvantages and must reflect an optimal balance between the incentive's aims and practicality constraints.
Incentive Structure
Incentive structure influences how rewards are allocated across providers, whether providers compete for bonuses, and whether targets are based on improvement or just good performance. Competitive bonus programs provide an incentive to improve performance as providers compete for rewards and reputation. However, most of the payouts go to the top-performing providers, with little incentive for bottom-performing providers to improve.53 In noncompetitive programs, all providers are rewarded for reaching fixed performance targets. Targets based on QI rather than absolute quality provide greater incentives for those with low baseline quality, although most of the payouts again go to the high performers. Our preferred approach would be a combination of methods in which providers are rewarded for achieving the desired result in any given measure of care but also are rewarded for overall performance and/or improvement on a composite measure of care.
Incentive Recipient
The more direct the connection between the incentive and the person delivering the care, the greater is the effect of the incentive. In the NICU setting, however, care practices and results rarely can be attributed to a single provider but rather are a reflection of a team effort that includes a group of caregivers (eg, physicians, nurses, respiratory therapists, and nutritionists). In addition, some patients require multidisciplinary care from surgeons, cardiologists, and other providers. Therefore, in the NICU, a group or hospital incentive is a more-practical design choice. Any financial reward to providers would be redistributed within the group. This design would also foster a collaborative approach to patient care, because all caregivers would participate in the benefits of the reward, although a potential problem with this approach is “free-riding” by providers who contribute relatively little to care improvement within the group.
Incentive Amount
The amount of money needed to change provider effort is variable and is determined by the provider's marginal utility for the extra income. This depends not only on monetary factors (household income) but also on nonmonetary factors (personal ethics, normative professional practices, regulatory control, and clinical uncertainty). An amount too small is unlikely to induce a change in behavior; an amount too large may induce undesirable provider behavior. A survey of health maintenance organization managers indicated that a bonus of at least 5% of a physician's capitation income would be required to influence provider behavior.54
Payment Structure
The principle choice is whether to reward providers through an intermittent bonus or an increase in the fee-for-service schedule. Economic theory suggests that providers would respond most to incentives if they are rewarded every time they do the right thing or achieve a desirable outcome. However, the psychological literature suggests that larger intermittent bonuses for achieving a benchmark of care may create a more powerful motivational effect than regular small payment increases. There is insufficient literature to make a definitive judgment with regard to either method.27,28 For practical reasons related to data collection, we recommend a yearly bonus.
Payment Frequency
Practical impediments to rewarding providers with frequent timely payments to sustain momentum for improvement include the need to collect and to evaluate data. In addition, the frequency depends on the interval of measurement that allows for a meaningful interpretation of change. Specifically, if a measured variable occurs relatively infrequently, then it will take a longer time before a true performance assessment can be obtained. In the NICU setting, at a minimum, yearly feedback would be desirable.
Bringing Pay-for-Performance to the NICU
There is enormous political momentum from health care payers to realign the payment system to reward providers for the quality rather than the quantity of care. However, because the evidence base on pay-for-performance is still in its infancy, we recommend a phased approach to implementation in the NICU setting. Such an approach would use limited funding in select NICUs for specific quality measures. Systems established on the basis of “best guesses” must be designed with the potential for later revision as data are collected. Throughout the process, it is crucial that providers be involved in decisions about defining and measuring neonatal intensive care quality. In addition, controlled trials need to investigate the benefits and potential pitfalls of pay-for-performance in the NICU setting. Heightened attention to measuring (and rewarding) NICU quality should provide unprecedented opportunities to develop valid methods for assessing quality of care, which could have both economic and scientific implications.
Abbreviations
- QI
quality improvement
- IOM
Institute of Medicine
- OECD
Organisation of Economic Cooperation and Development
- CPQCC
California Perinatal Quality Care Collaborative
Footnotes
The authors have indicated they have no financial relationships relevant to this article to disclose.
References
- 1.Institute of Medicine. Crossing the Quality Chasm: A New Health System for the 21st Century. Washington, DC: National Academy Press; 2001. [PubMed] [Google Scholar]
- 2.Olsen IE, Richardson DK, Schmid CH, Ausman LM, Dwyer JT. Intersite differences in weight growth velocity of extremely premature infants. Pediatrics. 2002;110:1125–1132. doi: 10.1542/peds.110.6.1125. [DOI] [PubMed] [Google Scholar]
- 3.Stoll BJ, Hansen N, Fanaroff AA, et al. Late-onset sepsis in very low birth weight neonates: the experience of the NICHD Neonatal Research Network. Pediatrics. 2002;110:285–291. doi: 10.1542/peds.110.2.285. [DOI] [PubMed] [Google Scholar]
- 4.Sankaran K, Chien LY, Walker R, Seshia M, Ohlsson A, Lee SK. Variations in mortality rates among Canadian neonatal intensive care units. CMAJ. 2002;166:173–178. [PMC free article] [PubMed] [Google Scholar]
- 5.Eichenwald EC, Escobar GJ, Zupancic JA, Greene JD, McCormick MC, Richardson DK. Inter-NICU variation in discharge timing of moderately premature infants: earlier discharge does not affect outcome. Pediatr Res. 2004;55:372A. [Google Scholar]
- 6.Rogowski JA, Staiger DO, Horbar JD. Variations in the quality of care for very-low-birthweight infants: implications for policy. Health Aff (Millwood) 2004;23:88–97. doi: 10.1377/hlthaff.23.5.88. [DOI] [PubMed] [Google Scholar]
- 7.Morales LS, Staiger DO, Horbar JD, et al. Mortality among very low-birthweight infants in hospitals serving minority populations. Am J Public Health. 2005;95:2206–2212. doi: 10.2105/AJPH.2004.046730. [DOI] [PMC free article] [PubMed] [Google Scholar]
- 8.Profit J, Zupancic JA, McCormick MC, et al. Moderately premature infants at Kaiser Permanente Medical Care Program in California are discharged home earlier than their peers in Massachusetts and the United Kingdom. Arch Dis Child Fetal Neonatal Ed. 2006;91:F245–F250. doi: 10.1136/adc.2005.075093. [DOI] [PMC free article] [PubMed] [Google Scholar]
- 9.Chow LC, Wright KW, Sola A. Can changes in clinical practice decrease the incidence of severe retinopathy of prematurity in very low birth weight infants? Pediatrics. 2003;111:339–345. doi: 10.1542/peds.111.2.339. [DOI] [PubMed] [Google Scholar]
- 10.Horbar JD, Rogowski J, Plsek PE, et al. Collaborative quality improvement for neonatal intensive care: NIC/Q Project Investigators of the Vermont Oxford Network. Pediatrics. 2001;107:14–22. doi: 10.1542/peds.107.1.14. [DOI] [PubMed] [Google Scholar]
- 11.Horbar JD, Carpenter JH, Buzas J, et al. Collaborative quality improvement to promote evidence based surfactant for preterm infants: a cluster randomised trial. BMJ. 2004;329:1004. doi: 10.1136/bmj.329.7473.1004. [DOI] [PMC free article] [PubMed] [Google Scholar]
- 12.Jackson JK, Vellucci J, Johnson P, Kilbride HW. Evidence-based approach to change in clinical practice: introduction of expanded nasal continuous positive airway pressure use in an intensive care nursery. Pediatrics. 2003;111(4) Available at: www.pediatrics.org/cgi/content/full/111/4/e542. [PubMed]
- 13.Kaempf JW, Campbell B, Sklar RS, et al. Implementing potentially better practices to improve neonatal outcomes after reducing postnatal dexamethasone use in infants born between 501 and 1250 grams. Pediatrics. 2003;111(4) Available at: www.pediatrics.org/cgi/content/full/111/4/e534. [PubMed]
- 14.Kilbride HW, Powers R, Wirtschafter DD, et al. Evaluation and development of potentially better practices to prevent neonatal nosocomial bacteremia. Pediatrics. 2003;111(4) Available at: www.pediatrics.org/cgi/content/full/111/4/e504. [PubMed]
- 15.Kilbride HW, Wirtschafter DD, Powers RJ, Sheehan MB. Implementation of evidence-based potentially better practices to decrease nosocomial infections. Pediatrics. 2003;111(4) Available at: www.pediatrics.org/cgi/content/full/111/4/e519. [PubMed]
- 16.Wirtschafter DD, Danielsen BH, Main EK, et al. Promoting antenatal steroid use for fetal maturation: results from the California Perinatal Quality Care Collaborative. J Pediatr. 2006;148:606–612. doi: 10.1016/j.jpeds.2005.12.058. [DOI] [PubMed] [Google Scholar]
- 17.Wirtschafter DD, Powers RJ. Organizing regional perinatal quality improvement: global considerations and local implementation. NeoReviews. 2004;5:e50. [Google Scholar]
- 18.Abelson R. Hospitals say they're penalized by Medicare for improving care. New York Times. 2003 December 5; [Google Scholar]
- 19.Epstein AM. Paying for performance in the United States and abroad. N Engl J Med. 2006;355:406–408. doi: 10.1056/NEJMe068131. [DOI] [PubMed] [Google Scholar]
- 20.Premier Inc. CMS/Premier Hospital Quality Incentive demonstration. [Accessed May 19, 2006]; Available at: www.premierinc.com/all/quality/hqi/resources/top-performer-summary.pdf.
- 21.Robinson JC. Theory and practice in the design of physician payment incentives. Milbank Q. 2001;79:149–177. III. doi: 10.1111/1468-0009.00202. [DOI] [PMC free article] [PubMed] [Google Scholar]
- 22.Freudenberg M. Composite indicators of country performance: a critical assessment. [Accessed February 22, 2006]; Available at: www.sourceoecd.org/10.1787/405566708255.
- 23.Hibbard JH, Stockard J, Tusler M. Does publicizing hospital performance stimulate quality improvement efforts? Health Aff (Millwood) 2003;22:84–94. doi: 10.1377/hlthaff.22.2.84. [DOI] [PubMed] [Google Scholar]
- 24.Rosenthal MB, Fernandopulle R, Song HR, Landon B. Paying for quality: providers' incentives for quality improvement. Health Aff (Milwood) 2004;23:127–141. doi: 10.1377/hlthaff.23.2.127. [DOI] [PubMed] [Google Scholar]
- 25.Rosenthal MB, Frank RG. What is the empirical basis for paying for quality in health care? Med Care Res Rev. 2006;63:135–157. doi: 10.1177/1077558705285291. [DOI] [PubMed] [Google Scholar]
- 26.Petersen LA, Woodard LD, Urech T, Daw C, Sookanan S. Does pay-for-performance improve the quality of health care? Ann Intern Med. 2006;145:265–272. doi: 10.7326/0003-4819-145-4-200608150-00006. [DOI] [PubMed] [Google Scholar]
- 27.Fairbrother G, Hanson KL, Friedman S, Butts GC. The impact of physician bonuses, enhanced fees, and feedback on childhood immunization coverage rates. Am J Public Health. 1999;89:171–175. doi: 10.2105/ajph.89.2.171. [DOI] [PMC free article] [PubMed] [Google Scholar]
- 28.Fairbrother G, Siegel MJ, Friedman S, Kory PD, Butts GC. Impact of financial incentives on documented immunization rates in the inner city: results of a randomized controlled trial. Ambul Pediatr. 2001;1:206–212. doi: 10.1367/1539-4409(2001)001<0206:iofiod>2.0.co;2. [DOI] [PubMed] [Google Scholar]
- 29.Hillman AL, Ripley K, Goldfarb N, Weiner J, Nuamah I, Lusk E. The use of physician financial incentives and feedback to improve pediatric preventive care in Medicaid managed care. Pediatrics. 1999;104:931–935. doi: 10.1542/peds.104.4.931. [DOI] [PubMed] [Google Scholar]
- 30.Institute of Medicine. Rewarding provider performance: aligning incentives in Medicare. [Accessed December 3, 2006]; Available at: www.iom.edu/CMS/3809/19805/37232.aspx.
- 31.Epstein AM, Lee TH, Hamel MB. Paying physicians for highquality care. N Engl J Med. 2004;350:406–410. doi: 10.1056/NEJMsb035374. [DOI] [PubMed] [Google Scholar]
- 32.Milgate K, Cheng SB. Pay-for-performance: the MedPAC perspective. Health Aff (Millwood) 2006;25:413–419. doi: 10.1377/hlthaff.25.2.413. [DOI] [PubMed] [Google Scholar]
- 33.Donabedian A. Evaluating the quality of medical care. Milbank Mem Fund Q. 1966;44(suppl):166–206. [PubMed] [Google Scholar]
- 34.Parry GJ, Gould CR, McCabe CJ, Tarnow-Mordi WO. Annual league tables of mortality in neonatal intensive care units: longitudinal study. BMJ. 1998;316:1931–1935. doi: 10.1136/bmj.316.7149.1931. [DOI] [PMC free article] [PubMed] [Google Scholar]
- 35.Freed GL, Uren RL. Pay-for-performance: an overview for pediatrics. J Pediatr. 2006;149:120–124. doi: 10.1016/j.jpeds.2006.03.023. [DOI] [PubMed] [Google Scholar]
- 36.Arah OA, Klazinga NS, Delnoij DMJ, Asbroek AHAT, Custers T. Conceptual frameworks for health systems performance: a quest for effectiveness, quality, and improvement. Int J Qual Health Care. 2003;15:377–398. doi: 10.1093/intqhc/mzg049. [DOI] [PubMed] [Google Scholar]
- 37.Roberts MJ, Hsiao W, Berman P, Reich MR. Getting Health Reform Right: A Guide To Improving Performance and Equity. New York, NY: Oxford University Press; 2004. [Google Scholar]
- 38.Brook RH. The RAND/UCLA Appropriateness Method. Rockville, MD: Agency for Health Care Policy and Research; 1994. Report 95–0009. [Google Scholar]
- 39.Wang CJ, McGlynn EA, Brook RH, et al. Quality-of-care indicators for the neurodevelopmental follow-up of very low birth weight children: results of an expert panel process. Pediatrics. 2006;117:2080–2092. doi: 10.1542/peds.2005-1904. [DOI] [PubMed] [Google Scholar]
- 40.Jencks SF, Huff ED, Cuerdon T. Change in the quality of care delivered to Medicare beneficiaries, 1998–1999 to 2000–2001. JAMA. 2003;289:305–312. doi: 10.1001/jama.289.3.305. [DOI] [PubMed] [Google Scholar]
- 41.Mor V. Improving the quality of long-term care with better information. Milbank Q. 2005;83:333–364. doi: 10.1111/j.1468-0009.2005.00405.x. [DOI] [PMC free article] [PubMed] [Google Scholar]
- 42.Petra E, Varughese P, Epifania L, Buneo L, Scarfone K. Use of quality index tracking to drive improvement in clinical outcomes. Nephrol News Issues. 2006;20:67–61. 83. [PubMed] [Google Scholar]
- 43.HealthGrades. The Eighth Annual HealthGrades Hospital Quality in America Study. Golden, CO: HealthGrades; 2005. [Google Scholar]
- 44.Simpson CR, Hannaford PC, Lefevre K, Williams D. Effect of the UK incentive-based contract on the management of patients with stroke in primary care. Stroke. 2006;37:2354–2360. doi: 10.1161/01.STR.0000236067.37267.88. [DOI] [PubMed] [Google Scholar]
- 45.Commission for Healthcare Audit and Inspection. NHS Performance Ratings 2004/2005. London, United Kingdom: Commission for Healthcare Audit and Inspection; 2005. [Google Scholar]
- 46.Epstein AJ. Do cardiac surgery report cards reduce mortality? Assessing the evidence. Med Care Res Rev. 2006;63:403–426. doi: 10.1177/1077558706288831. [DOI] [PubMed] [Google Scholar]
- 47.Grossbart SR. What's the return? Assessing the effect of “pay-for-performance” initiatives on the quality of care delivery. Med Care Res Rev. 2006;63(suppl):29S–48S. doi: 10.1177/1077558705283643. [DOI] [PubMed] [Google Scholar]
- 48.Nardo M, Saisana M, Saltelli A, Tarantolo S, Hoffman A, Giovanini E. Handbook on Constructing Composite Indicators: Methodology and User Guide. Paris, France: Organisation for Economic Co-operation and Development; 2005. [Accessed December 5, 2005]. Available at: www.olis.oecd.org/olis/2005doc.nsf/LinkTo/std-doc(2005)3. [Google Scholar]
- 49.Premier, Inc. Hospital Quality Incentive Project: summary of the composite indicator scoring methodology. [Accessed December 12, 2005]; Available at: www.premierinc.com/quality-safety/tools-services/p4p/hqi/resources/top-performer-summary.pdf.
- 50.Horbar JD, Leahy KA. An assessment of data quality in the Vermont-Oxford Trials Network database. Control Clin Trials. 1995;16:51–61. doi: 10.1016/0197-2456(94)00019-y. [DOI] [PubMed] [Google Scholar]
- 51.Peerzada JM, Richardson DK, Burns JP. Delivery room decision-making at the threshold of viability. J Pediatr. 2004;145:492–498. doi: 10.1016/j.jpeds.2004.06.018. [DOI] [PubMed] [Google Scholar]
- 52.Peterson ED, Roe MT, Mulgund J, et al. Association between hospital process performance and outcomes among patients with acute coronary syndromes. JAMA. 2006;295:1912–1920. doi: 10.1001/jama.295.16.1912. [DOI] [PubMed] [Google Scholar]
- 53.Rosenthal MB, Frank RG, Li Z, Epstein AM. Early experience with pay-for-performance: from concept to practice. JAMA. 2005;294:1788–1793. doi: 10.1001/jama.294.14.1788. [DOI] [PubMed] [Google Scholar]
- 54.Hillman AL, Pauly MV, Kerman K, Martinek CR. HMO managers' views on financial incentives and quality. Health Aff (Millwood) 1991;10:207–219. doi: 10.1377/hlthaff.10.4.207. [DOI] [PubMed] [Google Scholar]