

Abstract
Green tea extract (GTE) is known to be a potential anticancer agent(1) with various biological activities(2, 3) yet the precise mechanism of action is still unclear. The biomechanical response of GTE treated cells taken directly from patient’s body samples was measured using atomic force microscopy(AFM)(4). We found significant increase in stiffness of GTE treated metastatic tumor cells, with a resulting value similar to untreated normal mesothelial cells, whereas mesothelial cell stiffness after GTE treatment is unchanged. Immunofluorescence analysis showed an increase in cytoskeletal-F-actin in GTE treated tumor cells, suggesting GTE treated tumor cells display mechanical, structural and morphological features similar to normal cells, which appears to be mediated by annexin-I expression, as determined by siRNA analysis of an in vitro cell line model. Our data indicates that GTE selectively targets human metastatic cancer cells but not normal mesothelial cells, a finding that is significantly advantageous compared to conventional chemotherapy agents.
Green tea, a beverage widely consumed around the world, has long been known for its beneficial health effects and potential use for cancer prevention (1). It has been shown that the extract of green tea inhibits the formation and development of tumors in animal models (1) and is a more effective and practical cancer preventive than individual constituents of GTE alone (5). While several animal studies and human population-based studies have reported compelling results on the chemopreventitive effects of GTE (6), more information is required to provide a clear understanding of their cellular function. Several studies on GTE associated anticancer activity in cell lines, such as urothelial and lung adenocarcinoma lines (2, 6, 7), have been reported; however, the direct effect of GTE on metastatic or normal cells from clinically obtained human samples has not been studied to date.
Change in the nanomechanical properties of cells has garnered much interest in recent years. In particular, mechanical studies of human diseases such as cancer have recently emerged as research topics of interest (8–11). It is understood that disease states not only cause functional and biological alterations in cells but also result in significant change in their physical, structural and morphological characteristics (10–13). Cytoskeletal actin, one of the major ubiquitous proteins found in all eukaryotic cells, is a key structural and functional element in maintaining cell morphology, cell adhesion, cell motility, cell division, exocytosis and endocytosis (2, 14–17). Alteration of actin remodeling has recently been linked to cellular activity associated with malignant cellular phenotypes, including change in morphology, increased motility, proliferation and angiogenesis (2, 18). Recent studies have shown that actin depolymerization and disrupted actin stress fibers, marked by a shift in filamentous (F) actin to globular (G) actin, occurs in early stages of malignant transformation, whereas abnormal distribution of F-actin favoring cell migration occurs in the later stage of cancer corresponding to tumor cell invasiveness and metastasis (2, 19). It has been shown that cytoskeletal alterations, such as actin polymerization status, are connected to the overall mechanical properties of a cell (8–11). Mechanical properties of the cytoskeleton, transport properties and cell architectonics are largely mediated and regulated by associated cellular proteins (11), and their mechanical properties provide new information on mechanisms associated with molecular reorganization in diseased cells (11).
Here, we report the effect of a green tea extract (GTE) on live metastatic cancer cells and benign mesothelial cells taken from clinical patient effusions. We used atomic force microscopy (AFM) to probe the biomechanical properties associated with the ex-vivo treatment of ten different human body fluid samples (pleural effusions) with GTE (Table 1). Mechanical properties of clinically derived metastatic cancer cells and normal mesothelial cells were reported to show distinct differences in behavior (8). We studied pleural effusions taken from the lung, rather than primary tumor masses, as it provides a native control due to the presence of both mesothelial (normal) and tumor (metastatic) cells in this type of sample, and is used routinely in pathological clinical diagnosis. Individual cells were optically aligned under the AFM tip via optical microscopy [see Methods]. Using AFM software the tip was brought into contact with the central region of a cell and force curves were obtained [see Methods]. Force-displacement curves were recorded on each cell to determine the relative cell stiffness (Young’s modulus, E) of the cell. E was calculated by converting the force curves into force-indentation curves (20) and fitting with the Hertz model, which describes the indentation of an elastic sample using a stiff conical indenter (21, 22). To avoid spurious results in the obtained modulus measurements, force curves were measured with small observable indentations (23, 24) and limited to the central region of the cell (25).
Table 1.
Patient Characteristics and Cytological Diagnosis versus Mechanical Measurements (E).
| Case # | Age/Sex | Clinical History | Cytological Diagnosis of Pleural Fluid* | E (kPa): Tumor | E (kPa): Normal | E (kPa): GTE Treated Tumor | E (kPa): GTE Treated Normal |
|---|---|---|---|---|---|---|---|
| 1 | 65/Male | Pancreatic adenocarcinoma | Positive for metastatic malignant cells | 0.6 ± 0.1 n=18 |
2.7 ± 1.6 n=13 |
2.9 ± 1.5 n=18 |
3.0 ± 1.2 n=22 |
| 2 | 72/Female | Lung adenocarcinoma | Positive for metastatic malignant cells | 0.5 ± 0.1 n=12 |
2.8 ± 1.3 n=18 |
3.0 ± 2.0 n=16 |
2.9 ± 1.5 n=18 |
| 3 | 69/Female | Ovarian adenocarcinoma | Positive for metastatic malignant cells | 0.5 ± 0.1 n=16 |
2.8 ± 1.7 n=22 |
1.8 ± 1.3 n=18 |
2.2 ± 1.0 n=22 |
| 4 | 80/Female | Lung adenocarcinoma | Equivocal | 0.3 ± 0.1 n=32 |
1.7 ± 0.5 n=8 |
2.1 ± 1.0 n=16 |
2.1 ± 1.3 n=22 |
| 5 | 64/Female | Ovarian adenocarcinoma | Positive for metastatic malignant cells | 0.5 ± 0.1 n=18 |
2.5 ± 1.1 n=28 |
1.5 ± 0.6 n=16 |
2.8 ± 1.6 n=4 |
| 6 | 67/Female | Ovarian adenocarcinoma | Positive for metastatic malignant cells | 0.4 ± 0.1 n=18 |
2.4 ± 1.0 n=20 |
3.4 ± 1.4 n=16 |
1.6 ± 1.2 n=22 |
| 7 | 48/Female | Ovarian adenocarcinoma | Equivocal | 0.4 ± 0.1 n=16 |
2.4 ± 1.1 n=22 |
2.7 ± 1.5 n=22 |
3.2 ± 1.7 n=16 |
| 8 | 80/Male | Diabetes, hypo-tension and heart failure | Negative for malignant cells | — | 2.5 ± 1.1 n=20 |
— | — |
| 9 | 73/Female | Lung adenocarcinoma | Positive for metastatic malignant cells | 0.5 ± 0.1 n=12 |
2.9 ± 1.1 n=16 |
3.5 ± 1.3 n=16 |
3.6 ± 1.0 n=14 |
| 10 | 54/Female | Breast adenocarcinoma | Positive for metastatic malignant cells | 0.2 ± 0.1 n=22 |
1.7 ± 0.95 n=12 |
1.9 ± 1.1 n=16 |
1.6 ± 0.8 n=16 |
Cytomorphological diagnosis was made based on morphological analysis combined with immunohistochemical analysis [supplementary material]. Stiffness values (E) represent mean ± s.d.
To investigate the anticancer effect of GTE on regulating phenotypic changes in malignant cells we measured the biomechanical response of clinically derived metastatic and normal mesothelial cells both before and after treatment with GTE for 24 h at a dosage of 40 ug/ml. Consistent with our previous cancer study (8), we found that the average Young’s modulus for the tumor and normal cells from these samples before treatment were 0.41 ± 0.18 kPa (n=164) and 2.53 ± 1.23 kPa (n=177), respectively (P=8.6E-67; Fig. 1a). In contrast, after treatment of these cells with GTE the average cell stiffness measurements were 2.54 ± 1.47 kPa (n=154) and 2.48 ± 1.37 kPa (n=156) for the tumor and normal cells, respectively (Fig. 1a). The obtained measurements show that GTE increased the stiffness of the metastatic tumor cells from 0.41 ± 0.18 kPa (n=164) to 2.54 ± 1.47 (n=154) (P=5.6E-52). The results indicate that GTE causes a significant increase in the measured elasticity of the tumor cells in these patient samples, to a stiffness value quantitatively analogous to normal, healthy cells. Interestingly, no significant change was detected in the biomechanical response of the normal cells before and after treatment with GTE, indicating a very selective action on the metastatic cancer cells.
Figure 1. Patient tumor and normal cell nanomechanics and actin remodeling response to GTE treatment.


(a) Measured Young’s modulus of patient metastatic tumor and normal mesothelial cells before (ctrl) and after treatment with GTE for 24 h (dosage = 40ug/ml). The average Young’s modulus of the untreated tumor and normal cells were 0.41 ± 0.18 kPa (n=164) and 2.53 ± 1.23 kPa (n=177), respectively. Treatment of these cells with GTE yielded average cell stiffness values of 2.54 ± 1.27 kPa (n=154) and 2.48 ± 1.37 kPa (n=156) for the tumor and normal cells, respectively. (b) Immunofluorescence labeling of a clinical pleural effusion before and after treatment with GTE. Untreated normal and tumor cells (upper panel) and GTE(40ug/ml, 24 hours) treated tumor cells (lower panel). Cells were washed, fixed, and labeled for Bodipy Phallacidin-stained F-actin(green), Ber-EP4-stained tumor cells(red) and DAPI-stained DNA(blue, triple-labeled fluorescence). Images were taken using an Olympus BX40 microscope at 40x. Bottom, F-actin fluorescence intensity (FI) in mesothelial cells and tumor cells treated with GTE(40ug/ml), cisplatin(10ug/ml) and Taxol(40nM) (*p<0.05, data from four patient samples, scale bar=10um).
Cell populations chosen for mechanical analysis were confirmed using immunofluorescence labeling. Tumor and normal cell types were assessed with triple-labeling immunofluorescence for Ber-EP4 (red fluorescence), a marker for metastatic cancer cells, Calretinin, a marker for normal mesothelial cells, or F-actin (green fluorescence) and DNA (blue fluorescence) as described in the Methods section. Morphologically, GTE treated tumor cells, marked by red fluorescence (Ber-EP4 staining), displayed a larger cell size with increased cytoplasmic volume and had the appearance of mature epithelial cells compared to the untreated tumor cells, which correlated with increased F-actin stress fiber formation (Fig. 1b) and increased F-actin fluorescence intensity (Fig. 1b). Another notable morphological change displayed by the GTE treated cells was the significant reduction in cell clustering and overlap compared to the untreated cells (Fig. 1b).
The biochemical mechanisms responsible for the observed mechanical change in clinical patient samples were also investigated using human lung adenocarcinoma A549 cell lines. Here, we studied the GTE-induced biomechanical shift in A549 cells resulting from molecular reorganization associated with the actin binding protein (ABP) annexin-I, which is believed to be a protein target responsible for the actin remodeling effect of green tea extract (GTE) (2). Previously, it was shown that that GTE modulates actin remodeling in transformed human urothelial cells (MC-T11) (2, 7). Using a proteomics approach several altered proteins in MC-T11 cells induced by GTE were identified, including the actin binding protein (ABP) annexin-I that showed both a time- and dose-dependent expression (7). The increased annexin-I correlated with actin remodeling, and was the result of transcription level up-regulation, as determined by RT-PCR, pull-down immunoblot, and siRNA analyses (7). Furthermore, decreased annexin-I expression has been shown to be a common event in early stage bladder cancer development (6). Subsequently, similar findings were repeated in human lung A549 cells.
Using immunofluorescence labeling, the stimulatory effect of GTE on actin polymerization was assessed. Consistent with previous observations (2, 6), the presence of GTE caused a significant increase in the level of F-actin present as compared to the untreated control (ctrl) A549 cells (data not shown). Despite the pronounced subcellular structural reorganization due to GTE-induced F-actin polymerization, this does not necessarily mandate a shift in the mechanical properties of these cells post GTE treatment (21, 23, 26).
Cell elasticity measurements (Young’s modulus, E) taken on untreated (ctrl) and 24 hr GTE treated A549 cells are shown in Fig. 2. Measurements yielded average Young’s modulus (E) (mean ± s.d.) values of 0.34 ± 0.10 kPa for untreated (ctrl) cells and 0.41 ± 0.10 kPa and 1.0 ± 0.60 kPa for 6 h and 24 hr GTE treated cells, respectively (Fig. 2a–c). A two sample independent t-test conducted on the untreated and 24 h GTE treated cell populations showed that the population means were significantly different from each other at the 95% confidence level (P = 3.4E-10). The significant number of measurements (n=42) obtained provide a representative average modulus of these cells which excluded potential structural differences or variations in tip contact point.
Figure 2. The effect of GTE on A549 human lung adenocarcinoma cells.

(a–c) Histograms showing the Young’s modulus (kPa) of ctrl (a), 6 h (b) and 24 h (c) GTE treated A549 cells. Note the significant increase in cell stiffness after GTE treatment. The average E for the ctrl cells is 0.34 ± 0.10 kPa (a) and 1.0 ± 0.60 kPa for the 24 hr GTE treated cells (c) (P = 3.4E-10). (d–g)Histograms of the measured cell stiffness after exposure to annexin-I siRNA in the absence and presence of GTE. The average Young’s modulus values for annexin-I siRNA ctrl and 24 h GTE treated cells (dosage: 40 um/ml) were 0.60 ± 0.31 kPa (d; n=49) and 0.67 ± 0.44 kPa (e; n=48), respectively. As an additional level of control, cells were exposed to negative control complex siRNA (−) for comparison. The GTE-induced actin polymerization was not affected by siRNA negative control. The average Young’s modulus of the ctrl and GTE treated cells exposed to the negative control complex of annexin-I RNA interference (siRNA (−)) were 0.74 ± 0.36 kPa (f; n=50) and 2.67 ± 0.94 kPa (g; n=54), respectively.
To reveal the mechanism behind the observed GTE-induced cell stiffening, we probed the effect of annexin-I expression relating to actin remodeling observed in GTE stimulated A549 cells. Annexin-I-specific siRNA complexes were used to investigate further the function and biomechanical consequences of annexin-I upregulation. Cells exposed to annexin-I siRNA in the absence and presence of GTE showed a marked decrease in cell stiffness relative to GTE only treated cells (Fig. 2d–e). The average Young’s modulus values for annexin-I siRNA ctrl and 24 h GTE treated cells (dosage: 40 ug/ml) were 0.60 ± 0.31 kPa (n=49) and 0.67 ± 0.44 kPa (n=48), respectively. As an additional level of control, cells were exposed to negative control complex siRNA (−) for comparison (Fig. 2f–g). The GTE-induced actin polymerization was not affected by siRNA negative control; exposure to both siRNA (−) and GTE together showed an increase in stiffness similar to cells treated only with GTE. The average Young’s modulus of the ctrl and GTE treated cells exposed to the negative control complex of annexin-I RNA interference (siRNA (−)) were 0.74 ± 0.36 kPa (n=50) and 2.67 ± 0.94 kPa (n=54), respectively. However, compared to untreated control cells, cell stiffness was only slightly increased with siRNA complex even without GTE and to a considerably lesser extent than that observed for the GTE only and negative control GTE treated cells. These findings confirm the functional and observed mechanical affect associated with GTE-induced annexin-I expression on stimulating actin polymerization.
Taxol, cisplatin and topotecan, are commonly used chemotherapy agents with intraperitoneal application to treat metastatic cancer in body cavity. However, these drugs all share a similar detrimental irritation side effect when used locally, which may relate to the cytotoxic effect on normal cells among other mechanisms. We therefore, compared the effect of GTE versus these drugs on both metastatic cancer cells and normal mesothelial cells. After treatment of patient samples with Taxol, cisplatin and topotecan there is a noted increase in rounded cell morphology. Topotecan and cisplatin are known to target the DNA of cells leading to alteration in the DNA structure and thus apoptosis and necrosis (27–31). Taxol, initially derived from the bark of the Pacific yew tree, is a mitotic inhibitor that works by interfering with normal microtubule breakdown during cell division.
Figure 3 shows the cell stiffness values of cisplatin (Fig. 3d), topotecan (Fig. 3e) and Taxol (Fig. 3f) treated cells. The average Young’s moduli values for the Taxol, cisplatin and topotecan treated cells were 3.69 ± 2.42 kPa, 3.28 ± 1.72 kPa and 3.11 ± 2.08 kPa, respectively (Taxol treated cells, n = 78; cisplatin treated cells, n = 70; topotecan treated cells, n = 74). These values are notably stiffer than both the average tumor and normal cell stiffness values. The average Young’s moduli for the untreated (ctrl) tumor and normal cells from these same patients were 0.44 ± 0.13 kPa and 2.55 ± 1.09 kPa, respectively (Fig. 3a–b; metastatic tumor cells, n = 46; normal benign cells, n = 58; P=1.49E-23). Moreover, the widths of the associated standard deviation for the drug treated cells are significantly larger, with values both notably softer and stiffer than that of the normal mesothelial cells.
Figure 3. Biomechanical response of anticancer treated cytological samples.

(a–b) Histograms of untreated (ctrl) tumor and normal cell elasticity (E) measurements from patient samples subsequently subjected to anticancer treatment. Mean stiffness values for the tumor and normal cells from these patient samples were 0.44 ± 0.13 kPa (n=46) and 2.55 ± 1.09 kPa (n=58), respectively. (d–f) Histograms representing the measured Young’s modulus of all cisplatin (d) treated effusion cells (mean ± S.D. = 3.28 ± 1.72 kPa; n=70), topotecan (e) treated cells (mean ± S.D. = 3.11 ± 2.08 kPa; n=74) and Taxol (f) treated cells (mean ± S.D. = 3.69 ± 2.42 kPa; n=78).
We then compared the effect of such chemotherapeutic drugs with GTE on morphology as well as cell death in cancer and non-cancer (mesothelial) cells (Figure 4). Here we find that even the normal cells in these clinical pleural effusions, show a significant increase in average cell stiffness, despite the apparent increase in rounded cell morphology after treatment with these three conventional chemotherapeutic drugs. Additionally, an apoptotic response is apparent in the immunofluorescence analysis of these cell populations (Fig. 4a,c,e), as is expected with such chemotherapy agents. Fluorescence images of the cisplatin, topotecan and Taxol treated cells labeled for Ber-EP4 are shown in Figure 4b, d and f, respectively, confirming that the cells selected for analysis were indeed metastatic adenocarcinoma cells. Immunofluorescence images of untreated (ctrl) and GTE treated cells are shown in Figure 4g–j. There is little visible DNA fragmentation in the GTE treated cells compared to both control and other drug treated cells. Moreover, fluorescence labeling with Ber-EP4 before (Fig. 4h) and after (Fig. 4j) treatment with GTE reveals a significant decrease in the relative Ber-EP4 expression after treatment with GTE. The average positive cell count of the untreated cells is about 136 cells per field, whereas the average positive cell count after GTE treatment is reduced to about 86 cells per field. These findings are consistent with the observed increase in cytoskeletal F-actin in metastatic cells after treatment with GTE, which subsequently form less densely clustered metastatic cell populations.
Figure 4. Effect of GTE, cisplatin, topotecan and Taxol on apoptosis in normal and tumor cells.

Clinically derived normal and tumor cells were treated with GTE (40 ug/ml) and other common chemotherapeutic drugs for 24 hours. Treated and untreated cells were washed, fixed, and labeled for DNA (blue) and Ber-EP4 (red). (a–f)Immunofluorescence labeling of tumor cells treated with cisplatin (10ug/ml, a–b), topotecan (440nM, c–d) and Taxol (40nM, e–f). Fluorescence labeling of DNA (blue) reveals the onset of apoptosis in the Taxol, Topotecan and cisplatin treated cells. (g–j)Immunofluorescence images of untreated (ctrl, g–h) and GTE treated (i–j) cells reveal a significant decrease in the relative Ber-EP4 expression after GTE treatment. Images taken using a Nikon Eclipse E400 microscope at 40x. (k)Bar graph showing percent apoptosis rate in normal (cyan) and tumor (blue)cells treated with various reagents (data collected from 4 samples with each sample divided into 4 regions with 500 cells/region).
The relative percentage of apoptosis obtained in the control, GTE, cisplatin and Taxol treated cells is shown in Figure 4k. Biochemical assays for these treatments showed a significant increase in the percent of apoptotic normal cells in the cisplatin and Taxol treated samples compared to the GTE treated cells. The average apoptosis rate for the cisplatin and Taxol treated normal cells was 15.5 ± 8.4% and 38.8 ± 33.3%, respectively. That of the GTE treated cells was 4 ± 4.5%, which is similar to the measured apoptosis rate for the control (untreated) cells (1.5 ± 2.4%). Compared to the cisplatin and Taxol treated cells the GTE treated samples show a significant decrease (between 4 and 10 times) in the associated percent of apoptotic normal cells.
The findings presented here demonstrate that GTE has a strong effect on the functional properties of metastatic cancer cells in both human cell lines as well as live, clinically obtained patient samples, and unlike other chemotherapeutic drugs, the selective effect of GTE on cancer cells but not the non-cancer cells in the same specimen provided basis for developing GTE as an alternative novel agent for localized cancer therapy. The differential effect may be a function of GTE induced actin remodeling mediated by annexin-I. However, why other chemotherapeutic agents do not show the differential effect is not clear. Thus far our studies have yet to find any non-cancer cells in the body (not cell lines) that have a similar stiffness to metastatic tumor cells. In one of our original studies (Cross et al. Nature Nanotechnology, 2007) we presented results from the nanomechanical analysis of cells from cancer patients. We found that the stiffness of metastatic cancer cells taken directly from patient samples was more than 70% softer than the benign (normal) cells in these samples (8). Even when compared with patients suspected of different types of cancer (lung, breast and pancreas cancers) we found the same results (8). Although cancer is extremely biochemically diverse, our studies have shown that mechanically a common modulus for each cell type (metastatic vs. benign) is exhibited even for different tumor types and patient samples (8). While GTE has consistently shown a strong anti-cancer effect in both in vitro and in vivo models, efforts on human clinical trials with oral intake of GTE are hindered by unclear bioavailability of GTE. Positive clinical trials in humans are limited (32–34) and using local topical application of GTE to treat genital warts, a benign tumor that is induced by low risk Human Papilloma virus (HPV), resulted in the approval of GTE as a drug to treat such a condition by the Food and Drug Administration (FDA) (35). This is the first natural product that has ever been approved as a drug by the FDA. Our findings provide evidence which suggests that direct application of GTE to the body cavity may be efficacious to treat metastatic cancer with minimal side effects such as those associated with other conventional chemotherapy drugs.
Methods
Cell culture and cytological sample collection
Pleural effusion samples were collected and processed using standard protocol in cytology labs for conventional cytological analysis including Papanicolaou stain, Gimsa stain, and cellblock preparation. For the standard ex vivo culture procedure, an aliquot of the remaining sample (10 ml) was centrifuged at 500 g for 10 minutes. Cell pellets were resuspended with MEM-F12 culture medium and incubated for 12 h at 37°C in 5% CO2 and 95 % air. Immediately before analysis using AFM the culture medium was changed to wash off any dead or nonadherent cells.
SiRNA transfection for Annexin-A1
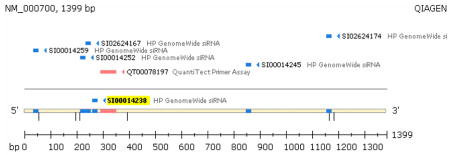
Three independent 21-base double-stranded RNAs were synthesized and purified by Qiagen design tool protocol (Qiagen.Valencia, CA). The Annexin A1 mRNA sequences from gene bank NM_000700. The Annexin A1 target sequences of siRNA were:
-
5′-CAT CAT TGA CAT TCT AAC TAA-3′, (Catalog No; SI00014238)
Sense; r(UCA UUG ACA UUC UAA CUA A)dTdT
Antisense; r(UUA GUU AGA AUG UCA AUG A)dTdG
-
5′-ATG CCT CAC AGC TAT CGT GAA-3′ (Catalog No; SI00014245)
Sense; r(GCC UCA CAG CUA UCG UGA A)dTdT
Antisense; r(UUC ACG AUA GCU GUG AGG C)dAdT
-
5′-TTG CAA GAA GGT AGA GAT AAA-3′ (Catalog No; SI00014259)
Sense; r(GCA AGA AGG UAG AGA UAA A)dTdT
-
Antisense; r(UUU AUC UCU ACC UUC UUG C)dAdA
The fluorescence-labeled 3′-AlexaFluor 488 Negative Control siRNA was;
-
5′-AAT TCT CCG AAC GTG TCA CGT-3′ (catalog no. 1022563)
Sense; r (UUC UUC GAA CGU GUC ACG U) dTdT
Antisense; r (ACG UGA CAC GUU CGG AGA A) dTdG
Negative control was used for detection of transfection efficiency and silencing control. The transfection of A549 cell line with siRNA was performed using Hiperfect transfection reagent kit (Qiagen.Cat.No. 301705. Valencia, CA.). 1×10⁶ A549 cells were cultured in 60mm culture dishes with 4ml F-12 medium and 1% S/P and 10% FCS, cultures were incubated at 37°C in 5% CO2, 95% air for 24 hours. Then samples were diluted with siRNA in 100ul culture medium without serum to give a final siRNA concentration of 5nM. 20ul of HiperFect transfection reagent was added to the diluted siRNA and mixed by vortexing. Samples were incubated for 5–10 min at room temperature. 100ul of the siRNA complex was transferred into the culture dish and incubated for 12 hours at 37°C in 5% CO2, 95% air. GTE was added at 40 μg/ml and incubated for 24 hours, with and without 10% serum. Samples were then submitted for AFM analysis.
GTE and anticancer drug treatment
From an individual patient sample, 10ml of clinical body fluid was centrifuged at 2000 rpm for 5 minutes. The pellet was grown in 3 cm cell culture dishes with 90% D-MEM/F-12 (Ham) medium (GIBCO BRL Island, NY) and 1% Penicillin G 10,000 Units/ml, Streptomycin 10,000 ug/ml Solution (GIBCO BRL Island, NY), 10% FCS. Cultures were incubated at 37°C in 5% CO2, 95% air for 24 hours. Cells were prepared as described above and then treated with four drugs (cisplatin 10ug/ml, topotecan 440nM, Taxol 40nM and GTE 40ug/ml), and incubated at 37°C for an additional 24 hr in 5% CO2 and 95 % air.
Nanomechanical analysis of cells using AFM
All analysis was conducted using a Nanoscope IV Bioscope (Veeco Digital Instruments) set on a combined inverted optical microscope (Nikon). The combined inverted optical stage allowed precise lateral positioning of the AFM tip over the central (nuclear) region of the cell. Mechanical measurements were made using sharpened silicon nitride cantilevers with experimentally determined (36) spring constants of 0.02 N/m and a tip radius of <20 nm. Measurements were obtained at 37°C with force measurements recorded at a pulling rate of 1 Hz.
For mechanical analysis force-displacement curves were recorded to determine the relative cell stiffness (Young’s modulus, E) and cell surface adhesion of individual cells. Young’s moduli was calculated by converting force-displacement curves into force-indentation curves (20) and fitting with the Hertz model, which describes the indentation of an elastic sample using a stiff conical indenter. More detailed discussion on the calculation and application of this model to mechanical properties of living cells can be found in previous publications (21, 22, 26). For calculation of the elastic moduli the Poisson ratio of the cell was taken to be 0.5, as is typical for soft biological material (20), and the half opening angle of the tip was 36°. Analysis of measurements was restricted to low force ranges resulting in shallow cell indentations (<500 nm) to prevent any damage to the cell surface and to reduce any possible influence from substrate-induced effects (24, 26).
Immunofluorescence triple labeling
Analysis of Ber-Ep4, F-actin, and DNA on fixed cells
For fluorescence analysis, cells cultured directly on 1 cm diameter cover glass were fixed with 3.7% paraformaldehyde for 30 min. Cells were then incubated with 1% BSA in PBS PH 7.4 for 30 min at RT (room temperature). They were then incubated with Anti-Human Epithelial Antigen Clone Ber-EP4 (DAKO.CA) diluted 1:300 with 1% BSA in PBS Ph 7.4 for 1 hr at RT. Next, they were incubated in 1:500 Cy3-conjugated AffiniPure Goat Anti-Mouse IgG (H+L) (Jackson ImmunoResearch Lab, Inc) for 30 min, followed by 1:40 Bodipy phallacidin (for F-actin) (Molecular Probes Inc., Eugene, OR) for 20 min, and then in a 1:10,000 dilution of DAPI for 5 min. Between each incubation step, the cover glass was rinsed with PBS three times. The stained cover glass was then transferred onto a regular microscopic slide and mounted in 100 mM n-propyl gallate (Sigma Chemical Co., St Louis, MO) in spectranalyzed glycerol (Fisher Scientific), pH 6.5, for fluorescence examination and automated quantitative analysis (AQUA, PM-2000, HistoRx, New Haven, Connecticut) and analysis of F-actin fluorescence intensity (FI) in tumor and mesothelial cells. The lowest possible AQUA score is 0 and the highest is 255. For analysis, cells with and without red fluorescence (tumor cells versus mesothelial cells, respectively) were selected for F-actin measurement separately whereas for each specimen, at least 500 total cells were selected for the measurement, and the mean fluorescence intensity of each cell population (red intensity, tumor cells versus absence of red intensity, mesothelial cells) was calculated.
Fluorescence labeling of Ber-Ep4 on live cells
Live cell fluorescence labeling was performed in 3 cm cell culture dishes. Anti-Human Epithelial Antigen Clone Ber-EP4 (DAKO.CA) was diluted 1:1000 in 1% BSA in PBS pH 7.4. Conjugation was achieved by combining 1ug of the diluted antibody with 5ul of Alexa Fluor 488 reagent (Invitrogen Molecular Probes) and incubating for five minutes at RT. 5ul of blocking reagent was added to the reaction mixture and incubated for additional five minutes at RT. The resulting complex was applied to the samples and incubated for 1 hr at RT.
Statistical analysis
To summarize results, data were expressed as mean ± SD. Statistical significance of differences in mean values was assessed using a two sample independent Student’s t-test at the 95% confidence level and differences among means are reported using exact P values.
Acknowledgments
S.E.C. and J.K.G. acknowledge partial support from National Institutes of Health research grant No. 5 R21 GM074509. J.R. and Y.J. acknowledge partial support from National Institutes of Health research grant No. U01CA96116 and Alper grant, Johnsson Comprehensive Cancer Center. Q.Y.L, J.R. and Y.J. acknowledge partial support from National Institutes of Health research grant No. 1R03CA125859.
Footnotes
COMPETING INTERESTS STATEMENT The authors declare that they have no competing financial interests.
References
- 1.Yang CS, Wang X, Lu G, Picinich SC. Cancer prevention by tea: animal studies, moleculer mechanisms and human relevance. Nature Reviews Cancer. 2009;9:429–439. doi: 10.1038/nrc2641. [DOI] [PMC free article] [PubMed] [Google Scholar]
- 2.Lu Q-Y, Jin Y-S, Pantuck A, Zhang Z-F, Heber D, Belldegrun A, et al. Green Tea Extract Modulates Actin Remodeling via Rho Activity in an In vitro Multistep Carcinogenic Model. Clin Cancer Res. 2005;11(4):1675–1683. doi: 10.1158/1078-0432.CCR-04-1608. [DOI] [PubMed] [Google Scholar]
- 3.Yang GY, Liao J, Kim K, Yurkow EJ, Yang CS. Inhibition of growth and induction of apoptosis in human cancer cell lines by tea polyphenols. Carcinogenesis. 1998;19(4):611–616. doi: 10.1093/carcin/19.4.611. [DOI] [PubMed] [Google Scholar]
- 4.Binnig G, Quate CF, Gerber C. Atomic Force Microscope. Physical Review Letters. 1986;56(9):930. doi: 10.1103/PhysRevLett.56.930. [DOI] [PubMed] [Google Scholar]
- 5.Fujiki H. Green Tea: Health Benefits as Cancer Preventive for Humans. The Chemical Record. 2005;5:119–132. doi: 10.1002/tcr.20039. [DOI] [PubMed] [Google Scholar]
- 6.Lu Q, Jin Y, Zhang Z, Le A, Heber D, Li F, Dubinett S, Rao J. Green tea induces annexin-I expression in human lung adenocarcinoma A549 cells: involvement of annexin-I in actin remodeling. Laboratory Investigation. 2007;87:456–465. doi: 10.1038/labinvest.3700534. [DOI] [PubMed] [Google Scholar]
- 7.Gui-Shan Xiao Y-SJ, Qing-Yi Lu, Zhang Zuo-Feng, Belldegrun Arie, Figlin Robert, Pantuck Allan, Yen Yun, Li Frederick, Rao JianYu. Annexin-I as a potential target for green tea extract induced actin remodeling. International Journal of Cancer. 2006;120(1):111–120. doi: 10.1002/ijc.22164. [DOI] [PubMed] [Google Scholar]
- 8.Cross SE, Jin Y-S, Rao J, Gimzewski JK. Nanomechanical analysis of cells from cancer patients. Nat Nano. 2007;2(12):780–783. doi: 10.1038/nnano.2007.388. [DOI] [PubMed] [Google Scholar]
- 9.Guck J, Schinkinger S, Lincoln B, Wottawah F, Ebert S, Romeyke M, et al. Optical Deformability as an Inherent Cell Marker for Testing Malignant Transformation and Metastatic Competence. Biophys J. 2005;88(5):3689–3698. doi: 10.1529/biophysj.104.045476. [DOI] [PMC free article] [PubMed] [Google Scholar]
- 10.Suresh S. Biomechanics and biophysics of cancer cells. Acta Materialia. 2007;55(12):3989–4014. doi: 10.1016/j.actbio.2007.04.002. [DOI] [PMC free article] [PubMed] [Google Scholar]
- 11.Suresh S, Spatz J, Mills JP, Micoulet A, Dao M, Lim CT, et al. Connections between single-cell biomechanics and human disease states: gastrointestinal cancer and malaria. Acta Biomaterialia. 2005;1(1):15–30. doi: 10.1016/j.actbio.2004.09.001. [DOI] [PubMed] [Google Scholar]
- 12.Dao M, Lim CT, Suresh S. Mechanics of the human red blood cell deformed by optical tweezers. Journal of the Mechanics and Physics of Solids. 2003;51(11–12):2259–2280. [Google Scholar]
- 13.Yamazaki DKS, Takenawa T. Regulation of Cancer Cell Motility Through Actin Reorganization. Cancer Science. 2005;96:379–386. doi: 10.1111/j.1349-7006.2005.00062.x. [DOI] [PMC free article] [PubMed] [Google Scholar]
- 14.Lazarides E, Weber K. Actin Antibody: The Specific Visualization of Actin Filaments in Non-Muscle Cells. Proceedings of the National Academy of Sciences. 1974;71(6):2268–2272. doi: 10.1073/pnas.71.6.2268. [DOI] [PMC free article] [PubMed] [Google Scholar]
- 15.Luna EJ, Hitt AL. Cytoskeleton--plasma membrane interactions. Science. 1992;258(5084):955–964. doi: 10.1126/science.1439807. [DOI] [PubMed] [Google Scholar]
- 16.Nobes CD, Hall A. Rho, Rac, and Cdc42 GTPases regulate the assembly of multimolecular focal complexes associated with actin stress fibers, lamellipodia, and filopodia. Cell. 1995;81(1):53–62. doi: 10.1016/0092-8674(95)90370-4. [DOI] [PubMed] [Google Scholar]
- 17.Sato M, Schwarz WH, Pollard TD. Dependence of the mechanical properties of actin/[alpha]-actinin gels on deformation rate. Nature. 1987;325(6107):828–830. doi: 10.1038/325828a0. [DOI] [PubMed] [Google Scholar]
- 18.Rao JY, Li N. Microfilament Actin Remodeling as a Potential Target for Cancer Drug Development. Current Cancer Drug Targets. 2004;4:345–354. doi: 10.2174/1568009043332998. [DOI] [PubMed] [Google Scholar]
- 19.Rao JY, Hemstreet Gp, III, Hurst RE, Bonner RB, Jones PL, Min KW, et al. Alterations in Phenotypic Biochemical Markers in Bladder Epithelium During Tumorigenesis. Proceedings of the National Academy of Sciences. 1993;90(17):8287–8291. doi: 10.1073/pnas.90.17.8287. [DOI] [PMC free article] [PubMed] [Google Scholar]
- 20.Touhami A, Nysten B, Dufrene YF. Nanoscale Mapping of the Elasticity of Microbial Cells by Atomic Force Microscopy. Langmuir. 2003;19(11):4539–4543. [Google Scholar]
- 21.Matzke R, Jacobson K, Radmacher M. Direct, high-resolution measurement of furrow stiffening during division of adherent cells. Nat Cell Biol. 2001;3(6):607–610. doi: 10.1038/35078583. [DOI] [PubMed] [Google Scholar]
- 22.Rotsch C, Braet F, Wisse E, Radmacher M. AFM imaging and elasticity measurements on living rat liver macrophages. Cell Biol Int. 1997;21:685–696. doi: 10.1006/cbir.1997.0213. [DOI] [PubMed] [Google Scholar]
- 23.Pelling AE, Dawson DW, Carreon DM, Christiansen JJ, Shen RR, Teitell MA, et al. Distinct contributions of microtubule subtypes to cell membrane shape and stability. Nanomedicine: Nanotechnology, Biology and Medicine. 2007;3(1):43–52. doi: 10.1016/j.nano.2006.11.006. [DOI] [PubMed] [Google Scholar]
- 24.Stolz M, Raiteri R, Daniels AU, VanLandingham MR, Baschong W, Aebi U. Dynamic Elastic Modulus of Porcine Articular Cartilage Determined at Two Different Levels of Tissue Organization by Indentation-Type Atomic Force Microscopy. Biophys J. 2004;86(5):3269–3283. doi: 10.1016/S0006-3495(04)74375-1. [DOI] [PMC free article] [PubMed] [Google Scholar]
- 25.Cross SE, Jin Y, Rao J, Gimzewski JK. Applicability of AFM in cancer detection. Nature Nanotechnology. 2009;4:72–73. doi: 10.1038/nnano.2009.004. [DOI] [PubMed] [Google Scholar]
- 26.Rotsch C, Radmacher M. Drug-Induced Changes of Cytoskeletal Structure and Mechanics in Fibroblasts: An Atomic Force Microscopy Study. Biophys J. 2000;78(1):520–535. doi: 10.1016/S0006-3495(00)76614-8. [DOI] [PMC free article] [PubMed] [Google Scholar]
- 27.Gay M, Montana AM, Moreno V, Prieto Ma-J, Llorens R, Ferrer L. Studies of interaction of dichloro[[eta]2-dimethyl-(2-methylidene-cyclohexylmethyl)-amino]platinum(II) with DNA: Effects on secondary and tertiary structures of DNA - Cytotoxic assays on human cancer cell lines Capan 1 and A431. Journal of Inorganic Biochemistry. 2005;99(12):2387–2394. doi: 10.1016/j.jinorgbio.2005.09.006. [DOI] [PubMed] [Google Scholar]
- 28.Gonzalez VM, Fuertes MA, Alonso C, Perez JM. Is Cisplatin-Induced Cell Death Always Produced by Apoptosis? Mol Pharmacol. 2001;59(4):657–663. doi: 10.1124/mol.59.4.657. [DOI] [PubMed] [Google Scholar]
- 29.Onoa GB, Cervantes G, Moreno V, Prieto MJ. Study of the interaction of DNA with cisplatin and other Pd(II) and Pt(II) complexes by atomic force microscopy. Nucl Acids Res. 1998;26(6):1473–1480. doi: 10.1093/nar/26.6.1473. [DOI] [PMC free article] [PubMed] [Google Scholar]
- 30.Ramachandran S, Quist AP, Kumar S, Lal R. Cisplatin Nanoliposomes for Cancer Therapy: AFM and Fluorescence Imaging of Cisplatin Encapsulation, Stability, Cellular Uptake, and Toxicity. Langmuir. 2006;22(19):8156–8162. doi: 10.1021/la0607499. [DOI] [PubMed] [Google Scholar]
- 31.Sato T, Serikawa T, Sekine M, Aoki Y, Tanaka K. Increased efficiency of cisplatin-resistant cell lines to DNA-mediated gene transfer with cationic liposome. Journal of Obstetrics and Gynaecology Research. 2005;31(5):368–374. doi: 10.1111/j.1447-0756.2005.00304.x. [DOI] [PubMed] [Google Scholar]
- 32.Bettuzzi SBM, Rissi F, Castagnetti G, Peracchia G, Corti A. Chemoprevention of human prostate cancer by oral administration of green tea catechins in volunteers with high-grade prostate intraepithelial neoplasia: a preliminary report from a one-year proof-of-principle study. Cancer Res. 2006;66:1234–1240. doi: 10.1158/0008-5472.CAN-05-1145. [DOI] [PubMed] [Google Scholar]
- 33.Brausi M, Rizzi F, Bettuzzi S. Chemoprevention of Human Prostate Cancer by Green Tea Catechins: Two Years Later. A Follow-up Update. European Urology. 2008;54(2):472–473. doi: 10.1016/j.eururo.2008.03.100. [DOI] [PubMed] [Google Scholar]
- 34.Shimizu MFY, Ninomiya M, Nagura K, Kato T, Araki H, Suganuma M, Fujiki H, Moriwaki H. Green tea extracts for the prevention of metachronous colorectal adenomas: a pilot study. Cancer Epidemiol Biomarkers Prev. 2008;17(11):3020–5. doi: 10.1158/1055-9965.EPI-08-0528. [DOI] [PubMed] [Google Scholar]
- 35.Stockfleth EBH, Orasan R, Grigorian F, Mescheder A, Tawfik H, Thielert C. Topical Polyphenon E in the treatment of external genital and perianal warts: a randomized controlled trial. Br J Dermatol. 2008;158(6):1329–38. doi: 10.1111/j.1365-2133.2008.08520.x. [DOI] [PubMed] [Google Scholar]
- 36.Levy R, Maaloum M. Measuring the spring constant of atomic force microscope cantilevers: thermal fluctuations and other methods. Nanotechnology. 2002;(1):33. [Google Scholar]