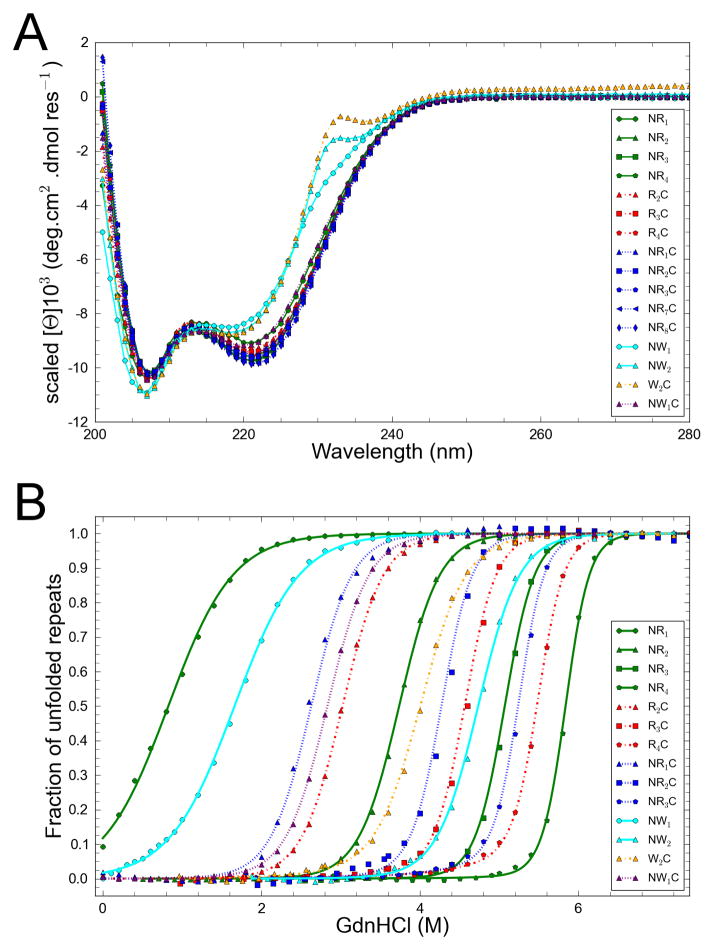
Figure 1. Far UV CD spectra and GdmHCl unfolding transitions of consensus ankyrin repeat proteins.
To compare shape (A), spectra are scaled to the same average intensity as NR2 from 206–222 nm. Spectra have similar shapes, except for constructs with trp substitution at position 5. (B) GdnHCl titration of CARPs. Constructs are as indicated in the legend. Lines result from global fits of an Ising model the transitions shown here and to two replicate transitions for each construct (not shown). Curves are normalized after fitting by subtracting the fitted baselines. Transitions are independent of concentration over the range studied here (see text and Figure S1). Conditions: 150 mM NaCl, 25 mM Tris-HCl pH 8.0, 20°C.

