Abstract
To devise successful imaging and therapeutic strategies, the identification of β-cell surface markers is one of the challenges in diabetes research that has to be resolved. We previously showed that IC2, a rat monoclonal IgM antibody, can be used for ex vivo determination of β-cell mass by imaging. Further progress toward the development of an antibody-based imaging agent was hampered by the lack of knowledge regarding the nature and composition of the IC2 antigen. Here, we show a series of systematic experiments involving classical lipid extraction and chromatography techniques combined with immunochemistry, which led to the identification of sphingomyelin as the target antigen assembled in the form of patches on the β-cell surface. Our findings were verified by modulating SM by enzymatic cleavage, downregulation, upregulation, and perturbation of membrane SM and observation of corresponding changes in IC2 binding. Cholesterol participates in stabilization of these patches, as its removal results in loss of IC2 binding. We believe that these findings have implications for identifying future ligands for the proposed antigen for imaging purposes as well as for potential therapy, as sphingomyelin has been shown to play a role in the apoptotic cascade in pancreatic β cells.
Keywords: beta cell marker, beta cell mass, beta cell imaging
Increased blood glucose levels mostly accompanied by a decrease in functional β-cell mass are a key characteristic of human diabetes. While type 1 diabetes results from autoimmune destruction of insulin-producing β cells, type 2 diabetes is characterized by insulin resistance and relative insulin deficiency. In both cases, pancreatic β-cell mass is affected by the disease. Patients suffering from these conditions would benefit from clinical interventions aimed at restoring functional β-cell mass and methods to monitor this restoration noninvasively (1). Recent years have seen exponential progress in applying various imaging modalities (MRI, positron emission tomography, optical) for noninvasive detection and monitoring of pancreatic β-cell mass (2–6). A crucial prerequisite for clinical application of these techniques is the availability of a contrast agent with high affinity and high specificity toward β-cell surface markers.
Antibodies or their fragments, owing to their high specificity, biocompatibility and ability to carry payload to the target site, could serve as an ideal molecule for imaging applications. A number of different antibodies have been suggested for noninvasive determination of β-cell mass (7–9). However, most of them suffer from lack of specificity for islet β cells. Part of this problem emanates from the fact that β cells share the same lineage as other cells in the pancreas, making it difficult to elucidate unique targets on the β-cell surface. In addition, there is a challenging requirement for imaging agents to be retained by β cells at least 1,000-fold more strongly than by exocrine cells (10). No antibodies/antibody fragments have yet been described that fulfill all the requirements, necessitating a further search for β-cell biomarkers. The single-chain antibody SCA B5 has shown promise in the past (11). However, its target and its utility for β-cell imaging are unknown.
In a previous study, we showed that the 125I-labeled β-cell-specific IC2 antibody accumulates in the pancreas of streptozotocin-induced mice in direct proportion to β-cell mass (2). However, further progress toward the development of an antibody-based in vivo imaging probe was impeded due to lack of information about the nature and identity of the β-cell surface antigen. IC2 is a rat monoclonal antibody of the IgM isotype, obtained by fusing lymphocytes from diabetes-prone BB rats with a rat myeloma partner and selected by screening hybridoma supernatants against Rin5F insulinoma cells (12). In this study, we present experiments that lead to the identification of sphingomyelin (SM)-rich patches as a target of this antibody. These patches are only present on the surface of β cells, making them suitable for ligand binding. We believe that our findings have implications for identifying future ligands for the proposed antigen for in vivo imaging purposes as well as for potential therapy, as SM-derived ceramide has been shown to have a role in the regulation of insulin synthesis (13, 14) and contributes to β-cell apoptosis (15–18).
MATERIALS AND METHODS
Cell culture
Rat insulinoma RinM5F (CRL-11605) and Ins-1E (19) cells were grown in RPMI medium supplemented with 10% FBS. Rat gliosarcoma cell line 9L was cultured in Minimum Essential Medium supplemented with 10% FBS. Media were changed every second day to keep the cultures in exponential phase of growth.
Purification of IC2 antibody
IC2-producing hybridoma cells (12) were grown in RPMI supplemented with 10% FBS. The supernatant from the culture was diluted 1:1 with 100 mM PBS containing 0.05% sodium azide, passed through a 0.22 micron syringe filter, and then circulated overnight through a 5 ml protein-L column (Pierce) as suggested by the manufacturer. The next day, the column was extensively washed with freshly prepared 100 mM PBS without sodium azide, eluted with IgG elution buffer (Pierce), and immediately neutralized with 0.1 N NaOH. The antibody was concentrated using an Amicon filter (50,000 cutoff) and washed in 10 mM PBS. Protein concentration was determined using a BCA assay kit (Pierce), and the antibody was stored frozen in aliquots at −20°C. Purity and antibody class were confirmed by gel electrophoresis and Western blotting with peroxidase-conjugated goat anti-Rat IgM antibody (Sigma).
Animals
Mice (C57BL/6, 6-10 weeks old) were purchased from Charles River Laboratories and maintained in a germ-free environment at the Massachusetts General Hospital. All animal-related procedures were reviewed and approved by the Institutional Animal Care and Use Committee at MGH. Organs (pancreas, brain, kidney, liver, and spleen) were harvested following standard procedures, snap frozen in liquid nitrogen, and stored at −80°C until use. All tissues were cut into 7-8 µm sections using a Leica CM3050 S cryostat and collected on pretreated slides (Fisher Scientific).
Flow cytometry
Exponentially growing cells were dislodged with a mild trypsin treatment and collected by centrifugation at 4°C. The cell pellet was washed with chilled PBS and then incubated with 1 µg/ml of IC2 on ice for 1 h followed by incubation with anti-rat IgM-FITC (1:1000) containing TO-PRO-3 (1 µM) and incubated on ice for another h. The cells were then pelleted, washed three times with chilled PBS, fixed with 4% formaldehyde, and analyzed by flow cytometry. Unstained cells and cells stained with irrelevant rat IgM (isotype control) served as controls.
Immunofluorescence microscopy
RinM5f cells were grown on poly-L-lysine-coated coverslips (BioCoat, BD Biosciences), fixed with 4% formaldehyde, and then blocked with 1% BSA. Staining was performed by first incubating coverslips with 1 µg/ml of IC2 antibody for 2 h at RT and then with Alexa Fluor 594-labeled goat anti-rat IgM (1:500 dilution, Invitrogen) followed by incubation with Alexa Fluor 488-labeled B-subunit of cholera toxin (Invitrogen) for 2 h. Cells were washed, mounted with DAPI-containing mounting medium (Invitrogen), and observed using a confocal microscope (Zeiss LSM 5 Pascal) with a 100× oil emersion objective in place. Sections of human pancreas were kindly provided by Dr. Christian Schuetz (Massachusetts General Hospital). Human and mouse pancreatic tissue sections were stained as above except that a cocktail of IC2, guinea pig anti-insulin (Abcam), rabbit anti-glucagon (Abcam), or rabbit anti-somatostatin (Invitrogen) antibodies were used. After incubation and washing, another cocktail of respective secondary antibodies (Alexa Fluor 594 anti-Rat IgM, FITC-anti-guinea pig, and Alexa Fluor 680 anti-rabbit) was added. Tissue sections were mounted in DAPI-containing mounting medium and observed under a fluorescence microscope. For lysenin staining, the cells were incubated with 1:1000 dilution of lysenin (250 µg/ml stock, Peptide International) in PBS for 1 h and then washed. Incubations for rabbit anti-lysenin antibody (Peptide International) and Alexa Fluor 488 anti-rabbit antibody (Invitrogen) were similar to that described for IC2. Grayscale images were recorded with SPOT RT3 CCD camera and SPOT advanced software and then pseudocolored for colocalization studies. In all of the immunofluorescence experiments, a 1:500 dilution of an irrelevant purified rat myeloma IgM (Invitrogen) was used as an isotype control.
Immunodetection of IC2 antigen on dot blots, lipid arrays, and TLC plates
To determine the presence of IC2 antigen on polyvinylidene fluoride (PVDF) membrane, commercially available lipid arrays (PIP Strips and SphingoStrips, Invitrogen), homemade lipid array with 5 µg lipid/spot, or TLC plates were first blocked with 5% milk in Tris buffer with 0.05% Tween 20 (TBST) for 1 h and then incubated with 1 µg/ml of IC2 antibody for 2 h. The blot or TLC plate were washed with TBST to remove unbound antibody and then incubated with HRP-conjugated goat anti-rat IgM (1:5000 dilution, Sigma) for 1 h at RT and developed with SuperSignal West Pico Chemiluminescent Substrate (Pierce). The chemiluminescent signal was recorded using an IVIS Spectrum imaging station (Caliper). The actual images were displayed by the instrument as heatmaps. A signal of two logs above the background was considered a positive signal. For control, duplicate blots or TLC plates were incubated in a 1:500 dilution of an irrelevant Rat IgM (Invitrogen) instead of IC2 and processed similarly.
Antigen extraction and purification by TLC
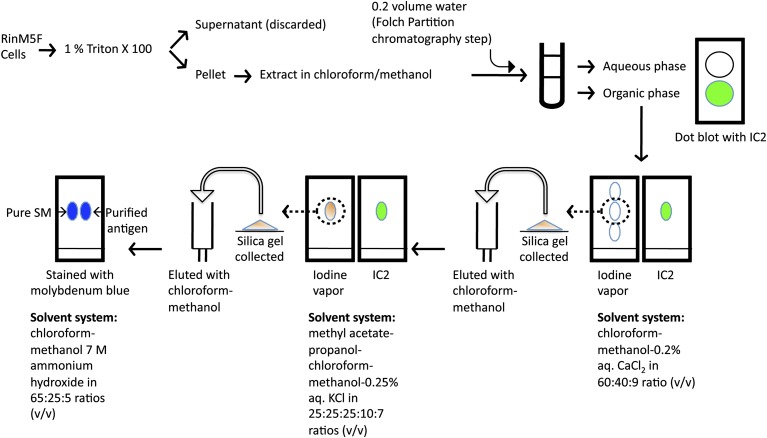
RinM5f cells grown to 90% confluence were washed with chilled Dulbecco's PBS and permeabilized by adding 1% Triton X100. The insoluble fraction was scraped from the plate and collected by centrifugation. Lipid extraction was carried out following the Folch procedure (20) with some modifications. Briefly, the insoluble fraction was incubated in a chloroform-methanol mixture (2:1), vortexed, and incubated on a reciprocal mixer for 1 h. The supernatant was collected by centrifugation at 10,000 g for 10 min. The pellet was extracted two more times, and all of the supernatants were pooled. The monophasic pooled extract was then partitioned into two phases by the addition of 0.2 vol of water, and the two phases (upper aqueous and lower organic) were collected in separate tubes and concentrated using a Speed-Vac (Savant). Dot blot was performed on PVDF membrane as described above. Three successive rounds of TLC were performed in different solvent systems to purify the antigen. First, the dried lower organic phase obtained following the Folch procedure as described above was dissolved in chloroform-methanol mixture (1:1) and spotted on aluminum-backed G-60 silica plates (Fluka). The TLC was developed in chloroform-methanol-0.2% aqueous CaCl2 in 60:40:9 ratio (v/v) (21) and stained in iodine vapors. The position of spots was marked with a pencil, and the presence of IC2 antigen was detected by immunoblotting. The chemiluminescent signal was recorded on an IVIS Spectrum imaging station as described above. For further purification, preparative TLC was performed in the same solvent system, and the spots were detected by incubating the plates in iodine vapor. The spots corresponding to IC2 antigen were marked, and silica gel from these spots was scrapped with a spatula. The silica gel was added to an empty column, and the antigen was eluted with a chloroform-methanol mixture (1:1) and concentrated on a Speed-Vac. A second round of TLC purification was performed by spotting a small portion of this concentrate on a TLC plate and developing it in a second solvent system (methyl acetate-propanol-chloroform-methanol-0.25% aqueous KCl in 25:25:25:10:7 v/v ratios) optimized for phospholipids (22). The spot profile was developed in iodine vapors, and the plate was then subjected to immunoblotting against IC2 antibody as described above. Then preparative TLC was performed with the remaining extract in the second solvent system, the antigen was eluted from the silica gel as above and concentrated. The third round of TLC was performed in a solvent system containing chloroform/methanol/7 M ammonium hydroxide mixture at 65:25:5 ratio (23). In this third round of TLC, commercially available purified phosphatidylcholine (PC) and SM standards were run in parallel, and the TLC plate was stained with molybdenum blue stain (Sigma) to detect phospholipids as described by the manufacturer (see antigen purification scheme in Fig. 1).
Fig. 1.
Antigen purification scheme. Triton X100 insoluble fraction of RinM5f cells was extracted in methanol-chloroform mixture and then further fractionated and purified following classical chromatography steps. Enrichment of antigen at every step was followed by immunoblotting with IC2 antibody on TLC plates.
ELISA
For competition ELISA, the plate was coated with antigen extracted from RinM5f cells and blocked with BSA. Lipid vesicles were prepared by sonicating 1 ml of 1% defatted BSA solution in tubes coated with 2.5 mg of SM or PC in a bath sonicator for 5 min. The lipid vesicles were serially diluted, added to the wells containing 400 ng/ml of IC2, and incubated at room temperature for 2 h. Peroxidase-conjugated anti-rat IgM (1:5000) was added to the wells and incubated for another h. The color was developed with Sigmafast OPD and read on a plate reader.
Cell treatment with lipase
Cultures of RinM5f grown to 80% confluence on poly-L-Lysine coated coverslips were fixed with 4% formaldehyde and extensively washed. Enzymes were dissolved in 1% defatted BSA (sphingomyelinase 0.1 U/ml, phospholipase C 1.0 U/ml and phospholipase A2 0.16 U/ml), added to the coverslips and incubated for 4 h at room temperature. After washing, cells were stained with IC2 as described above and observed under a fluorescence microscope. Coverslips not treated with any enzyme but stained with IC2 served as positive controls, while cells treated with enzymes and stained with isotype control served as negative control. The images were then analyzed using Image J software. Fluorescence values were averaged and represented as percent of positive control. Error bars represent standard deviations.
Fumonisin B1 treatment and serum starvation
RinM5f were seeded at a density of 20,000 cells/ml in culture plates on glass coverslips and cultured for 48 h. Next, fresh medium containing Fumonisin B1 (25 µM/l) was added, and cells were allowed to grow for another 24 h. Coverslips were then removed, fixed with 4% formaldehyde, and coimmunostained with IC2 and lysenin. For lipid analysis, cells were scraped, and total lipids were isolated following the Floch procedure and resolved on TLC plate using the solvent system described by Yu and Ariga (21). After staining with iodine, images were recorded and the TLC plate was subjected to immunoblotting with IC2 as described earlier. For serum starvation experiments, media were replaced with serum-free RPMI 1640. All other steps were similar to Fumonisin B1 treatment.
Dexamethasone and concanavalin A treatment
RinM5f cells were seeded in a 12-well culture plate and allowed to grow for 48 h. The media were replaced with fresh medium containing 0.1 µM/l of dexamethasone (Sigma) and allowed to incubate for 6 h. Next, coverslips were washed with PBS and fixed with formaldehyde. The cells were then coimmunostained with IC2 and lysenin and subjected to fluorescence microscopy as described earlier. For concanavalin A (Con A) treatment, cells were seeded on the coverslips in the media containing 0.2 µg/ml Con A and cultured for 48 h. Then coverslips were washed, fixed, and stained as described for dexamethasone. Coverslips not receiving dexamethasone or Con A served as control in respective experiments.
Methyl-β-cyclodextrin treatment
Exponentially growing RinM5f cells were collected with mild trypsin treatment and washed with PBS. Cells were then suspended in 10 mM methyl-β-cyclodextrin (MβCD, Sigma) in PBS or 0.1 U/ml of sphingomyelinase (SMase), which served as negative control and incubated at 37°C. After 20 min, cells were pelleted and the treatments were repeated. After 20 min, cells were washed with ice-cold PBS and stained in suspension with IC2 as described earlier or with lysenin by first incubating them in 2.5 µg/ml solution of lysenin for 20 min, followed by successive incubations in 1:1000 dilutions of anti-lysenin antiserum and FITC-conjugated anti-rabbit antibody for 1 h each on ice. Following the staining, cells were fixed with 4% formaldehyde and analyzed by flow cytometry. Untreated similarly stained cells served as control. For isotype control, an irrelevant purified rat myeloma IgM (Invitrogen) was used. Part of MβCD-treated cells were also stained with filipin III (1 µg/ml) for 5 min and observed under the fluorescence microscope. Untreated cells served as positive control.
RESULTS
Specificity of IC2 antibody
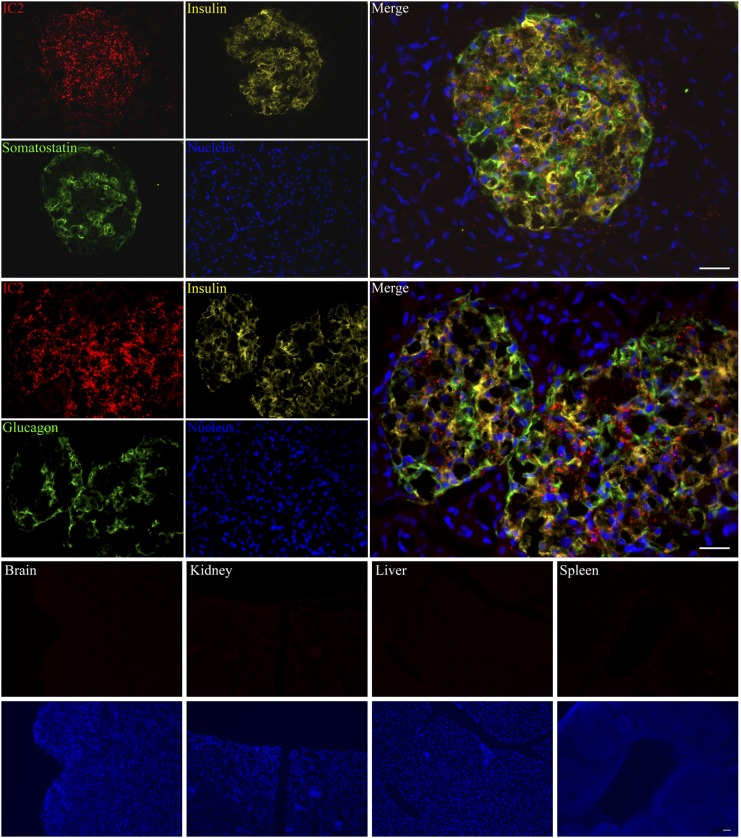
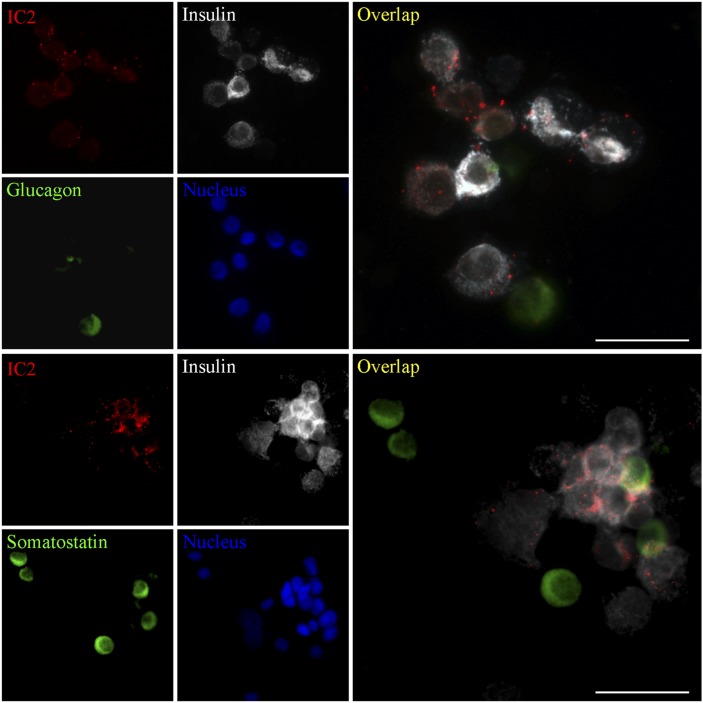
To test the ability of IC2 antibody to stain pancreatic islets, we incubated sections of human pancreas with IC2, anti-insulin, antisomatostatin, or antiglucagon antibody. We found that IC2 was binding specifically to the islets with no staining of the surrounding nonendocrine pancreatic tissue. This staining had good colocalization with insulin, suggesting IC2 binding to the β cells (Fig. 2). There was also occasional colocalization of IC2 with somatostatin and glucagon, which, however, was not significant. To further test the specificity of IC2, we incubated sections of mouse brain, kidney, liver, and spleen with this antibody. No staining was observed within any of these organs, confirming that the antibody was specific for β cells (Fig. 2). To confirm the results of tissue staining, normal human islets were dissociated into single-cell suspension and coimmunostained with IC2, insulin, and somatostatin or glucagon (Fig. 3). IC2 was found to bind exclusively to β cells (Fig. 3).
Fig. 2.
Immunostaining with IC2. Cryosections of human pancreas were stained with IC2 along with insulin and somatostatin or glucagon and observed under a fluorescence microscope. Similarly, cryosections of mouse brain, kidney, liver, and spleen were stained with IC2 alone and observed under a fluorescence microscope. Bar = 100 µm.
Fig. 3.
IC2 binds with islet β cells. Human islets were dissociated with trypsin and stained with IC2 along with insulin and glucagon or somatostatin. Bar = 50 µm.
Cell surface localization of IC2
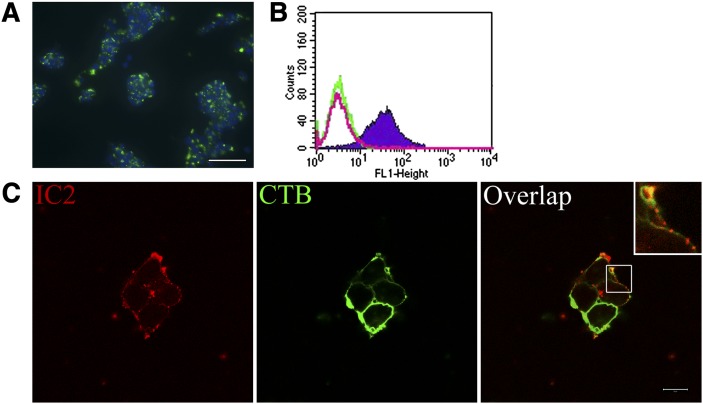
For simplicity, most of our experiments were performed in β-cell-like cell lines. Therefore, we tested RinM5f insulinoma cells for binding with IC2. Fluorescence microscopy showed punctate staining on RinM5f cells characteristic for this antibody and similar to that shown in our prior work (Fig. 4A and Ref. 2). Fluorescence-activated cell sorting (FACS) analysis of Ins-1E cells dislodged with a mild trypsin treatment showed that almost 96% of the cells were stained with IC2 (Fig. 4B). To confirm the presence of IC2 antigen on the surface of the cells, RinM5f cells were stained with IC2 and with FITC-labeled cholera toxin subunit B (CTB) that specifically localizes to the cell membrane. Confocal microscopy revealed the presence of IC2-specific fluorescence at the periphery of the cells, confirming that the antigen was located on the surface of the cells (Fig. 4C).
Fig. 4.
Cell surface localization of IC2. A: Characteristic punctate staining of RinM5f insulinoma cells shows strong binding with IC2 antibody (IC2, green; DAPI nuclear stain, blue). B: FACS analysis of Ins-1E cells shows specific binding with IC2 antibody (shaded region). No nonspecific uptake was observed with isotype control antibody (green line); unstained cells, red line. C: Confocal microscopy with RinM5f cells confirmed cell surface localization of the antigen. Staining for IC2 (red) colocalized with the staining for membrane marker cholera toxin B subunit (green). Note punctate staining on the membrane (insert). Bar = 10 µm.
Extraction, purification, and identification of the IC2 antigen
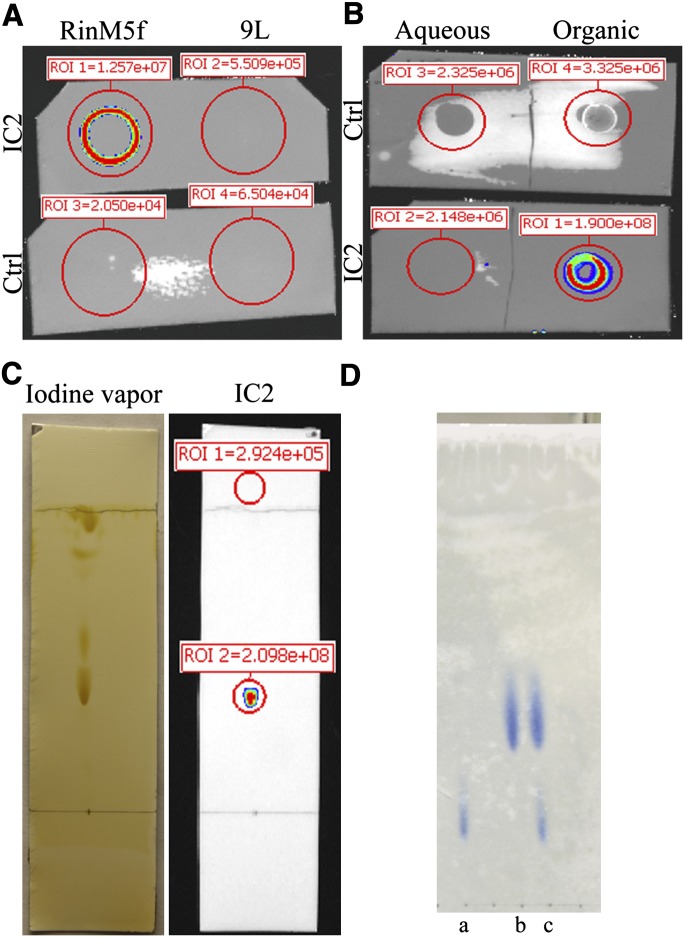
On the basis of susceptibility to proteases, Brogren et al. pointed toward the proteinaceous nature of the IC2 antigen (12). Therefore, to solubilize the antigen, we started with methods conventionally used for protein isolation. The antigen resisted extraction with RIPA buffer and other commonly used nonionic and zwitterionic detergents (saponin, Triton X100, NP-40, Tween 20, Tween 40, IGEPAL, CHAPS and OBG; see supplementary data) and precipitated at the bottom of the tube. This pellet stained well with IC2 antibody (supplementary Fig. I). The antigen in the pellet was further dissolved in SDS buffer, but gel electrophoresis (SDS-PAGE with or without β-ME) followed by immunoblotting could not identify any band specific for the IC2 antigen. Next we performed immunoprecipitation with a thiol-cleavable cross-linker to covalently cross-link IC2 bound to its antigen on the surface of live cells. Although this experiment pulled down the IC2 antibody, no band specific for the antigen was detected. This was a surprising result, considering earlier reports identifying the antigen as a protein (12). Therefore, we next revisited the protease digestion experiments described by Brogren et al. (12). Ins-1E cells were treated with trypsin or pronase (see supplementary data) for various periods. Contrary to the reported data, the antigen was found to resist trypsin (supplementary Fig. II) and pronase (data not shown) digestion. Next, attempts were made to solubilize the antigen in organic solvents. The insoluble pellet formed after detergent treatment was extracted in a 1:1 mixture of chloroform/methanol and dotted onto a PVDF membrane. Immunoblotting with IC2 antibody confirmed solubility of the antigen in organic solvents (Fig. 5A). An irrelevant cell line (9L gliosarcoma) showed negative staining after undergoing a similar procedure (Fig. 5A). No signal was obtained with irrelevant rat monoclonal IgM antibodies used as isotype control. Solubility of the antigen in methanol was also confirmed by treatment of fixed RinM5f cells with this solvent. Cells that were not washed with methanol retained the antigen (supplementary Fig. III). Successful treatment with methanol was confirmed by the loss of binding of methanol-treated cells with CTB, which normally stains ganglioside M1, a methanol-soluble glycolipid present in cell membranes. Similarly, we did not observe IC2 staining on paraffin-fixed pancreatic sections treated with alcohol, which presumably removed the antigen (data not shown; see supplementary data for standard staining procedure). Next, we applied a systematic approach that involved partition chromatography and TLC to identify the IC2 antigen (see Fig. 1 for antigen purification scheme). First, the Triton X100-resistant fraction was extracted with a monophasic chloroform-methanol mixture as outlined above, followed by a partitioning into a biphasic system as described by Folch et al. (20). This procedure resulted in two phases, which were separated, dried, and dissolved in a chloroform-methanol mixture. The dot blot of both phases with IC2 antibody revealed the presence of a signal only in the lower organic phase. No signal was detected in the upper aqueous phase or with the isotype control antibody (Fig. 5B), suggesting that the antigen might be a lipid species. Next, the lower organic phase was resolved into several components on TLC plates using a solvent system described by Yu and Ariga (21). Iodine vapors revealed the presence of several spots, which were probed with IC2 antibody (Fig. 5C). A single IC2-positive spot on the lower part of the TLC plate revealed the presence of the antigen (Fig. 5C). To establish whether the spot on the iodine-stained TLC plate contained more than one component, we further purified the antigen. First the silica gel from the positive spot was collected, then the antigen was eluted with methanol and concentrated. The concentrate was spotted onto TLC plates and developed in a solvent system described by Vitiello and Zanetta (22) to separate sphingomyelin from phosphatidylcholine. Only two clear spots were visible with iodine vapors. Probing with IC2 antibody produced a strong signal with the lower spot on the TLC plate (supplementary Fig. IV). A duplicate TLC plate probed with irrelevant antibody served as control and did not produce any signal (data not shown). The comparison of Rf values of IC2-positive spots with published data for the solvent systems used in the first and second rounds of TLC separations strongly indicated that the antigen could be a phospholipid. Therefore, we subjected the antigen purified after the second round of TLC to a third round of TLC using a solvent system that separates sphingomyelin from other phospholipids, particularly phosphatidylcholine (23). The TLC plate was stained with molybdenum blue for detection of phospholipids. In this solvent system, the IC2 antigen ran as a single spot parallel to the purified sphingomyelin standard and produced the same Rf value as the published data for that standard (24, 25) (Fig. 5D). Blue staining of the spot confirmed the presence of phosphate residue. Taken together, these experiments established the identity of the IC2 antigen as sphingomyelin.
Fig. 5.
Purification of IC2 antigen. A: Dot blot of chloroform/methanol (1:1) extract of Triton X100-insoluble fraction of RinM5f and 9L cells probed with IC2 antibody. B: The chloroform/methanol extract from RinM5f cells was partitioned into aqueous and organic phase. Dot blot with IC2 antibody demonstrated positive signal in organic phase. C: Lipids present in organic phase were resolved on TLC plate and stained with iodine vapors. After documenting the image, the TLC plate was immunostained with IC2 antibody. D: Purified IC2 antigen (b) was run along with PC (a) and a mixture of SM and PC (c) and stained with molybdenum blue.
Lipid array
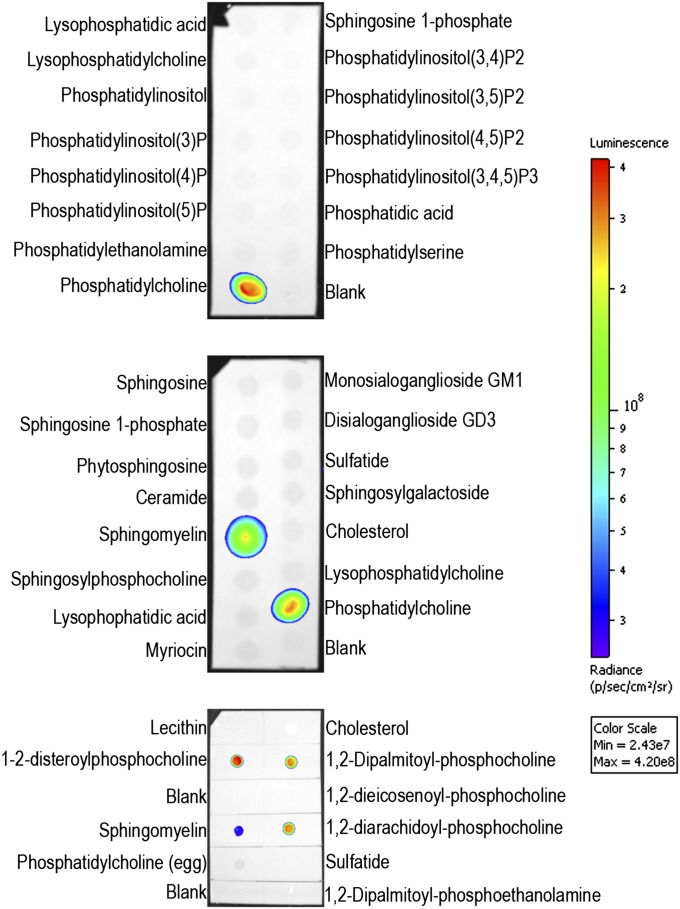
Sphingomyelin is a phospholipid that shares structural homology with many other lipid molecules. To investigate IC2 cross reactivity toward them, dot blots were performed with homemade and commercially available lipid arrays (Fig. 6). We found that IC2 bound specifically with sphingomyelin and phosphatidylcholines that had both of their acyl chains fully saturated (1,2-disteroylphosphocholine, 1,2-dipalmatoylphosphocholine, and 1,2-diarachidoylphosphocholine). Phosphatidylcholines that had a double bond on their acyl chains (1,2-dieicosenoylphosphocholine, lecithin, and phosphatidylcholine) failed to bind with IC2. Any modification of the choline subgroup (as in phosphatidylethanolamine) or its complete removal (as in ceramide) resulted in a loss of IC2 binding, suggesting a requirement for a choline head group for IC2 recognition. Enzymatic removal of the choline head group from sphingomyelin also resulted in loss of binding, confirming its requirement for antibody recognition (see below). In addition, we did not observe any binding with sulfatides, which is in contrast with a previously reported study (26). Also, no signal was observed with duplicate blots that were probed with irrelevant purified rat IgM. Since blotting against sphingomyelin and phosphatidylcholine on solid supports such as PVDF membrane or TLC plates represents a nonphysiological environment, we prepared lipid vesicles (liposomes) containing SM and PC, which to some extent mimicked cell membranes. These vesicles were tested in a competitive ELISA in which lipids extracted from RinM5f cells were coated onto the plate. Increasing concentrations of liposomes were added together with IC2 antibody to the plate. Competition was observed only in the case of sphingomyelin liposomes but not in the case of phosphatidylcholine, which did not compete for binding with the antibody (supplementary Fig. V), confirming the findings noted with dot blots. As expected, no binding was observed with irrelevant IgM used as isotype control.
Fig. 6.
Immunoblotting on lipid array. Two commercially available (PIPStrip and SphingoStrip) and one homemade lipid arrays (bottom) were immunoblotted against IC2 antibody.
Enzymatic treatment of the cells
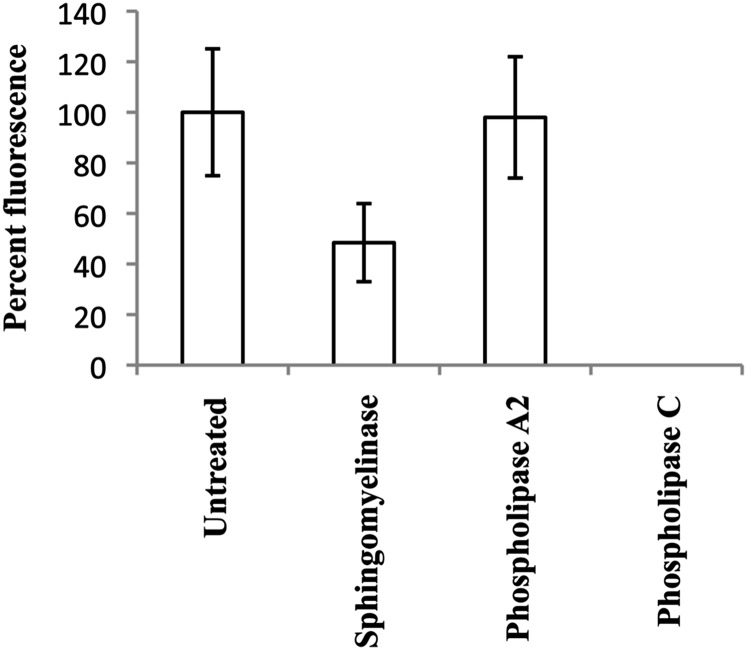
The results obtained from the experiments described above indicated that IC2 might interact with SM and tightly packed saturated acyl chain of PC. However, to understand which of these two is present in the patches on the cell membrane and participate in binding to IC2, we treated cells with specific lipases to observe a specific loss of antibody binding. Phospholipase C and sphingomyelinase are enzymes that remove the phosphocholine head group from phospholipids, but their substrate specificities are different. Phospholipase C removes the phosphocholine head group from all phospholipids, whereas sphingomyelinase is specific for sphingomyelin, resulting in formation of ceramide. Another enzyme, phospholipase A2, selectively removes fatty acid from the second carbon of glycerol in phosphatidylcholine. If IC2 is specific for sphingomyelin, then its binding would be affected by both sphingomyelinase and phospholipase C, but if it has specificity for phosphatidylcholine, then the binding would be affected by phospholipase C and phospholipase A2 but not by sphingomyelinase. We found that the binding was sensitive to digestion with sphingomyelinase and phospholipase C, but it was not affected by digestion with phospholipase A2 (Fig. 7). Interestingly, in these experiments, short treatments with SMase did not completely abrogate IC2 binding. In later experiments, the digestion was repeated after washing the cells once with PBS. This resulted in complete loss of IC2 binding as demonstrated by flow cytometry (described below). Similarly, we did not observe any binding with lyso-SM, lyso-PC, or ceramide on lipid arrays (Fig. 6). No signal was observed with isotype control antibody with enzyme-treated or untreated cells. This experiment proves that the antibody binds to sphingomyelin on the surface of the cells and that phosphatidylcholine most likely is not involved in binding.
Fig. 7.
Lipase treatment affects IC2 binding. RinM5f cells were treated with lipases and then stained with IC2. There was a significant decrease in IC2 binding after the treatment with sphingomyelinase and phospholipase C.
Colocalization of IC2 with lysenin
Lysenin is a sphingomyelin-specific, pore-forming protein that has been extensively used to study SM. As SM was found to be a ligand for IC2, in our next experiments we studied lysenin and IC2 colocalization using confocal microscopy. We found that lysenin colocalized with IC2 staining. However, the pattern of this colocalization differed for the two molecules. Whereas IC2 staining was restricted to patches, staining for lysenin was more homogeneous throughout the cell (Fig. 8). Importantly, patches highlighted by IC2 were also highlighted by lysenin.
Fig. 8.
Coimmunolocalization of IC2 and lysenin. RinM5f cells were stained with IC2 and lysenin and observed under a confocal microscope. Bar = 10 µm.
Downregulation of SM results in loss of IC2 and lysenin binding
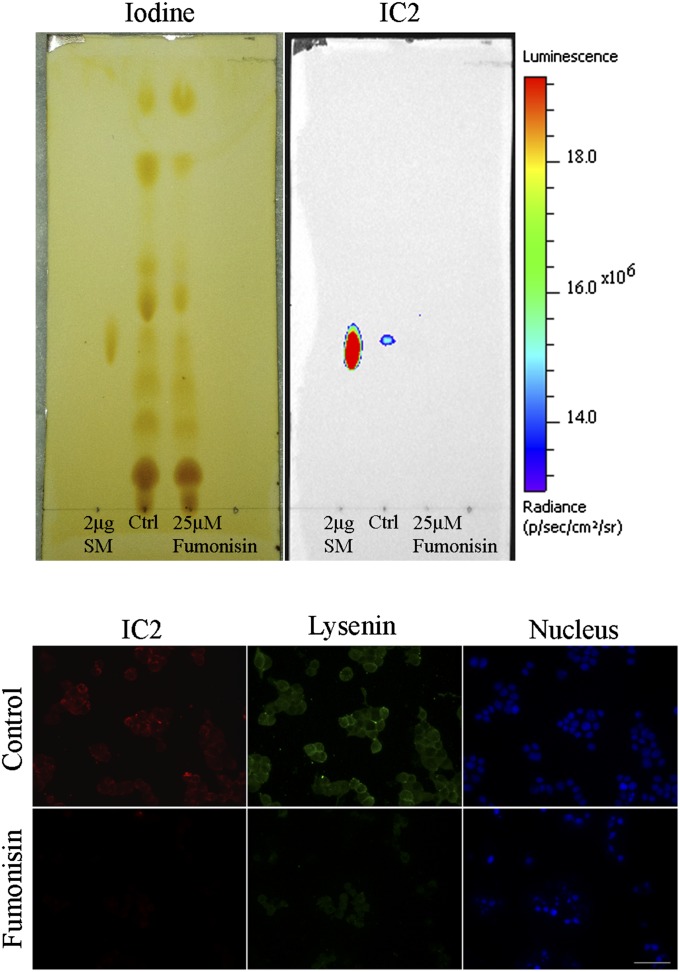
Fumonisin B1 is a fungal toxin that blocks ceramide synthase, preventing formation of ceramide, a precursor of SM (27). To test whether toxin-induced downregulation of SM would have an effect on IC2 binding, RinM5F cells were grown for 24 h in the presence of 25 µM of Fumonisin B1. Total lipids extracted from the cells, resolved on TLC, and stained with IC2 showed a complete loss of SM binding (Fig. 9, top). Interestingly, both IC2 and lysenin lost their binding with Fumonisin B1-treated RinM5F cells due to downregulation of SM (Fig. 9, bottom). Similarly, serum starvation also decreased the concentration of sphingomyelin due to activation of magnesium-dependent sphingomyelinase (28). RinM5f cells, serum starved for 24 to 48 h, exhibited near complete loss of IC2 and lysenin binding, further proving that IC2 binds to sphingomyelin (supplementary Fig. VI).
Fig. 9.
Fumonisin B1 treatment. Top: Cells were treated with Fumonisin B1, total lipids were extracted, resolved on TLC plate, stained with iodine vapors, and then subjected to immunoblotting against IC2 antibody. Untreated cells (Ctrl) and purified SM served as controls. Bottom: Cells treated with Fumonisin B1 were coimmunostained with IC2 and lysenin and observed under a fluorescence microscope. Bar = 50 µm.
Upregulation of SM causes an increase in IC2 binding
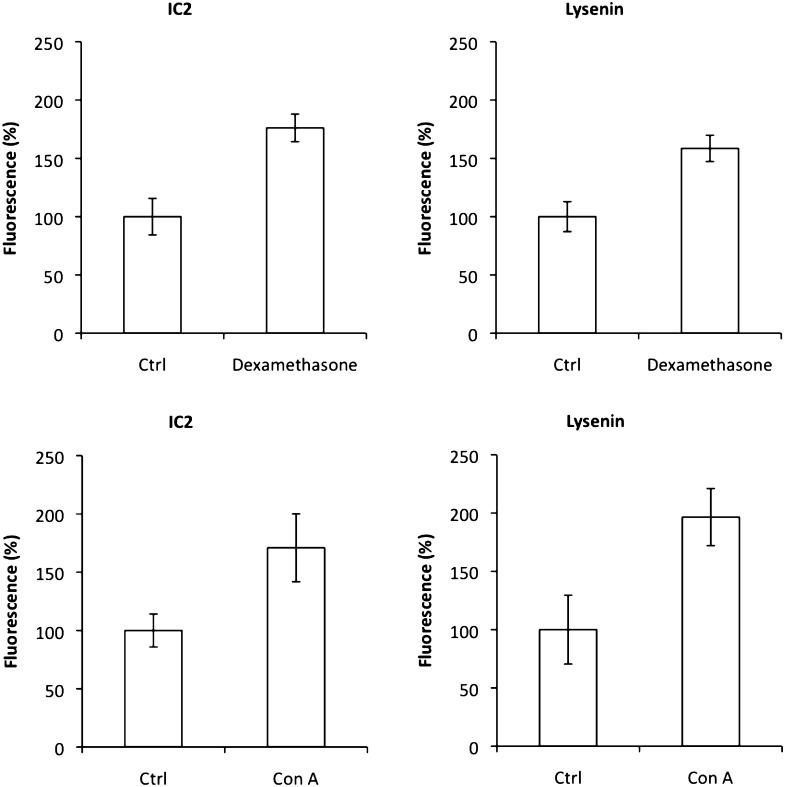
It has been reported that dexamethasone treatment causes an increase in SM production and membrane SM concentration (29). We exposed RinM5f cells to 25 µM of dexamethasone and observed an increase in IC2 and lysenin binding (Fig. 10). Quantitative microscopy revealed an almost 78% increase in fluorescence for both IC2 and lysenin, confirming that IC2 indeed binds to SM patches. In another experiment, we exposed RinM5f cells to 0.2 µg/ml concanavalin A, a mitogen known to perturb SM concentrations (30). Similar to dexamethasone treatment, concanavalin A increased fluorescence signal for both IC2 and lysenin, confirming IC2 specificity to SM (Fig. 10).
Fig. 10.
Upregulation of sphingomyelin. RinM5f cells were treated with dexamethasone or concanavalin A and then stained with IC2 or lysenin. Both treatment regimens resulted in increased signal from the cells.
MβCD treatment
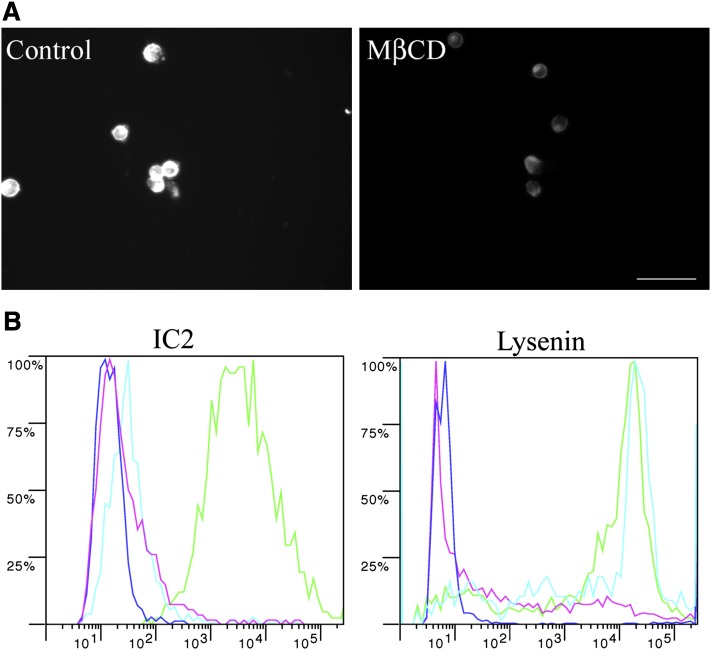
Next, we investigated whether there are components other than sphingomyelin that participate in binding with IC2 on the cell membrane. One such molecule is cholesterol, which, owing to its hydrophobicity, cooperates with sphingomyelin in forming liquid-ordered platforms. To study if this interaction is important for IC2 binding, we extracted cholesterol with MβCD. Cholesterol removal was confirmed with filipin III staining (Fig. 11A) and resulted in complete loss of IC2 binding. In contrast, lysenin staining was not lost (Fig. 11B). These results confirmed the need of cholesterol association with SM for IC2 recognition.
Fig. 11.
MβCD treatment. A: RinM5f cells were treated with MβCD to remove membrane cholesterol and then stained with the cholesterol-specific fluorescent antibiotic Filipin III. Untreated cells served as a positive control. Bar = 50 µm. B: MβCD-treated cells were stained with IC2 or lysenin and analyzed by flow cytometry. Positive control, green; negative control, blue; SMase treatment as the second negative control, red; MβCD-treated cells, cyan.
DISCUSSION
β-cell mass is tightly linked to the pathogenesis of diabetes. Therefore, the ability to evaluate this property of the pancreas quantitatively and temporally is one of the central goals of diabetes research. Considering the therapeutic implications of the ability to measure β-cell mass in intact subjects, it becomes important to devise strategies toward overcoming the issues associated with β-cell imaging (31). Identification of β-cell surface antigens is one of the challenges hampering progress in this area. To this end, we attempted to identify the antigen for the IC2 monoclonal antibody, which showed promise in our previous imaging studies. We have shown that this antibody accumulates in the pancreas proportionally to β-cell mass in the streptozotocin-induced mouse model of diabetes (2), further highlighting the importance of this antibody.
Even though this antibody has been known for well over two decades, its antigen has eluded identification. Also, no information is available as to whether the target of this antibody is also present in humans. This information is essential not only for developing this particular antibody as a targeted imaging or therapeutic carrier but also for elucidating antigenic structures on β-cell surfaces that are largely unknown at this point.
In this study, we demonstrated for the first time that IC2 antibody specifically stains β cells isolated from human islets. Importantly, other islet cells, the surrounding nonendocrine pancreatic tissue, and other major organs produced no staining, suggesting the possibility of using this antibody for β-cell mass determination in humans.
After confirming the cell surface localization of the antigen, we performed a series of experiments establishing its nature. Contrary to previously published data regarding the proteinaceous nature of the antigen, all of our experiments directed toward extracting a protein antigen produced negative results. After systematic purification steps, we confirmed that the purified IC2 antigen was sphingomyelin.
Sphingomyelin is an important phospholipid localized to the outer leaflet of the plasma membrane (32, 33). It shares structural homology with many different lipid molecules, especially PC. Therefore, it was not surprising that we observed IC2 cross reactivity with the saturated acyl chain of PC on lipid arrays. However, no binding with more common unsaturated acyl chains of PC was observed. This difference in reactivity toward saturated and unsaturated acyl chains of PC can be ascribed to the way the lipid molecules are packed. It is known that a double bond introduces a bend in hydrocarbon chains that prevents close packing of unsaturated PC molecules. Sphingomyelins, on the other hand, have an acceptor and donor of hydrogen bond between the head group and sphingosine base, allowing their close packing irrespective of their acyl chain composition (34, 35).
Hirota et al. described a similar mouse monoclonal IgM antibody that binds with PC with saturated acyl chains but fails to bind if even one of the chains has a double bond (30). This is particularly important because IC2 belongs to the IgM isotype, which is known for its low affinity, normally compensated by multiplicity of binding that requires appropriately spaced epitopes. Tight packaging of saturated PC seems to provide these conditions, allowing for IC2 binding that we observed on lipid arrays. Although unknown at this point, it is possible that PC with a saturated acyl chain is present on the surface of islet β cells and could contribute to IC2 binding. However, one of our major findings of this study was that only one IC2-reactive spot was observed on the TLC plate after lipid extraction from the cells. This spot was further identified as sphingomyelin. Cell digestion with specific lipases confirmed this observation (Fig. 7). Final confirmations of our findings were obtained in the experiments modulating (by down- or upregulation) SM concentrations with corresponding changes in IC2 binding.
This is the first report on sphingomyelin being present on β cells in the form of patches that are antigenic in Biobreeding (BB) rats. IC2, an antibody isolated from a recently diabetic BB rat, binds to these patches and produces a punctate staining pattern on the surface of islet cells and in pancreatic tissue sections. We found that sphingomyelin is not evenly distributed on the outer leaflet of the plasma membrane and is partly associated with cholesterol in patches. The possibility that these patches are an artifact was ruled out, because before staining with IC2, the cells were fixed in formaldehyde, which cross links cellular proteins, greatly reducing the mobility of molecules and preventing patch formation as a result of antibody interactions. Another evidence for patchy distribution of sphingomyelin was reported by Tyteca et al., who showed clustering of sphingomyelin analogs in micrometric patches on Chinese hamster ovary (CHO) cells (36), confirming that sphingomyelin was heterogeneously distributed on the cell surface. Additional confirmation was provided by Hirota et al. showing punctate staining on activated macrophages using the sphingomyelin-specific mouse monoclonal antibody VJ41 (30). Although many references showed an association of SM with proteins and other lipid molecules, including cholesterol and PC, none of them showed the utility of two different probes to stain two different stockpiles of SM at the same time. We showed that, whereas lysenin nonspecifically stained all SM, IC2 antibody specifically stained SM patches stabilized by cholesterol. Selective removal of cholesterol with MβCD resulted in redistribution of lipids and loss of IC2 binding without loss of sphingomyelin itself. These experiments indicated that the mere presence of sphingomyelin was not enough for IC2 binding. Similarly, cholesterol alone did not produce any binding with IC2 (Fig. 5). These results point toward tight cooperation between SM and cholesterol for IC2 binding. It is also possible that underlying cytoskeleton and membrane proteins have a role in stabilization of these unique patches (37). Cholesterol removal with MβCD is known to induce restructuring of cortical cytoskeleton (37), which most likely caused a loss in IC2 binding. There are indications that lipids associated with cortical cytoskeleton resist detergent extraction (38). We believe that resistance of IC2-reactive patches to extraction with Triton X100 (supplementary Fig. I) indicates the involvement of cortical skeleton in formation and/or stabilization of these patches.
In conclusion, our findings have important implications for diabetes research, including the discovery of novel affinity ligands for this newly identified antigen with the purpose of targeting pancreatic β cells for imaging and/or therapy.
Supplementary Material
Acknowledgments
The authors thank Pamela Pantazopoulos for excellent technical support.
Footnotes
Abbreviations:
- CTB
- cholera toxin subunit B
- MβCD
- methyl-beta-cyclodextrin
- PC
- phosphatidylcholine
This work was supported in part by Juvenile Diabetes Research Foundation Award JDRF 37-2009-30 (A.M.).
The online version of this article (available at http://www.jlr.org) contains supplementary data in the form of text and six figures.
REFERENCES
- 1.Moore A. 2009. Advances in beta-cell imaging. Eur. J. Radiol. 70: 254–257. [DOI] [PMC free article] [PubMed] [Google Scholar]
- 2.Moore A., Bonner-Weir S., Weissleder R. 2001. Noninvasive in vivo measurement of beta-cell mass in mouse model of diabetes. Diabetes. 50: 2231–2236. [DOI] [PubMed] [Google Scholar]
- 3.Antkowiak P., Tersey S., Carter J., Vandsburger M., Nadler J., Epstein F., Mirmira R. 2008. Noninvasive assessment of pancreatic beta-cell function in vivo with manganese-enhanced magnetic resonance imaging. Am. J. Physiol. Endocrinol. Metab. 296: 573–578. [DOI] [PMC free article] [PubMed] [Google Scholar]
- 4.Souza F., Simpson N., Raffo A., Saxena C., Maffei A., Hardy M., Kilbourn M., Goland R., Leibel R., Mann J., et al. 2006. Longitudinal noninvasive PET-based β cell mass estimates in a spontaneous diabetes rat model. J. Clin. Invest. 116: 1506–1513. [DOI] [PMC free article] [PubMed] [Google Scholar]
- 5.Kung M., Hou C., Lieberman B., Oya S., Ponde D., Blankemeyer E., Skovronsky D., Kilbourn M. R., Kung H. 2008. In vivo imaging of β-cell mass in rats using 18F-FP-(+)-DTBZ: a potential PET ligand for studying diabetes mellitus. J. Nucl. Med. 49: 1171–1176. [DOI] [PubMed] [Google Scholar]
- 6.Virostko J., Radhika A., Poffenberger G., Chen Z., Brissova M., Gilchrist J., Coleman B., Gannon M., Jansen D., Powers A. 2010. Bioluminescence imaging in mouse models quantifies β cell mass in the pancreas and after islet transplantation. Mol. Imaging Biol. 12: 42–53. [DOI] [PMC free article] [PubMed] [Google Scholar]
- 7.Hadjivassiliou V., Green M., Green I. 2000. Immunomagnetic purification of beta-cells from rat islets of Langerhans. Diabetologia. 43: 1170–1177. [DOI] [PubMed] [Google Scholar]
- 8.Hampe C., Wallen A., Schlosser M., Ziegler M., Sweet I. 2005. Quantitative evaluation of a monoclonal antibody and its fragment as potential markers for pancreatic beta cell mass. Exp. Clin. Endocrinol. Diabetes. 113: 381–387. [DOI] [PubMed] [Google Scholar]
- 9.Ladriere L., Malaisse-Lagae F., Malaisse W. J. 2000. Uptake of tritiated glibenclamide by endocrine and exocrine pancreas. Endocrine. 13: 133–136. [DOI] [PubMed] [Google Scholar]
- 10.Sweet I., Cook D., Lernmark A., Greenbaum C., Krohn K. 2004. Non-invasive imaging of beta cell mass: a quantitative analysis. Diabetes Technol. Ther. 6: 652–659. [DOI] [PubMed] [Google Scholar]
- 11.Ueberberg S., Ziegler D., Schechinger W., Dietrich J., Akinturk S., Klein H., Schneider S. 2010. In vitro phage display in a rat beta cell line: a simple approach for the generation of a single-chain antibody targeting a novel beta cell-specific epitope. Diabetologia. 53: 1384–1394. [DOI] [PubMed] [Google Scholar]
- 12.Brogren C. H., Hirsch F., Wood P., Druet P., Poussier P. 1986. Production and characterization of a monoclonal islet cell surface autoantibody from the BB rat. Diabetologia. 29: 330–333. [DOI] [PubMed] [Google Scholar]
- 13.Kelpe C., Moore P., Parazzoli S., Wicksteed B., Rhodes C., Poitout V. 2003. Palmitate inhibition of insulin gene expression is mediated at the transcriptional level via ceramide synthesis. J. Biol. Chem. 278: 30015–30021. [DOI] [PubMed] [Google Scholar]
- 14.Moore P., Ugas M., Hagman D., Parazzoli S., Poitout V. 2004. Evidence against the involvement of oxidative stress in fatty acid inhibition of insulin secretion. Diabetes. 53: 2610–2616. [DOI] [PubMed] [Google Scholar]
- 15.Morales A., Lee H., Goni F., Kolesnick R., Fernandez-Checa J. 2007. Sphingolipids and cell death. Apoptosis. 12: 923–939. [DOI] [PubMed] [Google Scholar]
- 16.Lei X., Zhang S., Bohrer A., Bao S., Song H., Ramanadham S. 2007. The group VIA calcium-independent phospholipase A2 participates in ER stress-induced INS-1 insulinoma cell apoptosis by promoting ceramide generation via hydrolysis of sphingomyelins by neutral sphingomyelinase. Biochemistry. 46: 10170–10185. [DOI] [PMC free article] [PubMed] [Google Scholar]
- 17.Lei X., Zhang S., Barbour S., Bohrer A., Ford E., Koizumi A., Papa F., Ramanadham S. 2010. Spontaneous development of endoplasmic reticulum stress that can lead to diabetes mellitus is associated with higher calcium-independent phospholipase A2 expression: a role for regulation by SREBP-1. J. Biol. Chem. 285: 6693–6705. [DOI] [PMC free article] [PubMed] [Google Scholar]
- 18.Zhang Y., Ranta F., Tang C., Shumilina E., Mahmud H., Foller M., Ullrich S., Haring H., Lang F. 2009. Sphingomyelinase dependent apoptosis following treatment of pancreatic beta-cells with amyloid peptides Abeta(1–42) or IAPP. Apoptosis. 14: 878–889. [DOI] [PubMed] [Google Scholar]
- 19.Merglen A., Theander S., Rubi B., Chaffard G., Wollheim C. B., Maechler P. 2004. Glucose sensitivity and metabolism-secretion coupling studied during two-year continuous culture in INS-1E insulinoma cells. Endocrinology. 145: 667–678. [DOI] [PubMed] [Google Scholar]
- 20.Folch J., Lees M., Sloane Stanley G. H. 1957. A simple method for the isolation and purification of total lipides from animal tissues. J. Biol. Chem. 226: 497–509. [PubMed] [Google Scholar]
- 21.Yu R. K., Ariga T. 2000. Ganglioside analysis by high-performance thin-layer chromatography. Methods Enzymol. 312: 115–134. [DOI] [PubMed] [Google Scholar]
- 22.Vitiello F., Zanetta J. P. 1978. Thin-layer chromatography of phospholipids. J. Chromatogr. A. 166: 637–640. [DOI] [PubMed] [Google Scholar]
- 23.Rouser G., Fkeischer S., Yamamoto A. 1970. Two dimensional then layer chromatographic separation of polar lipids and determination of phospholipids by phosphorus analysis of spots. Lipids. 5: 494–496. [DOI] [PubMed] [Google Scholar]
- 24.Hamilton R. J., Hamilton S. 1992. Lipid Analysis: A Practical Approach. Oxford University Press, New York. [Google Scholar]
- 25.Christie W. W. 1982. Lipid Analysis: Isolation, Separation, Identification, and Structural Analysis of Lipids. 2nd edition. Pergamon Press, New York. [Google Scholar]
- 26.Saudek F., Brogren C. H., Manohar S. 2008. Imaging the beta-cell mass: why and how. Rev. Diabet. Stud. 5: 6–12. [DOI] [PMC free article] [PubMed] [Google Scholar]
- 27.Hidari K., Ichikawa S., Fujita T., Sakiyama H., Hirabayashi Y. 1996. Complete removal of sphingolipids from the plasma membrane disrupts cell to substratum adhesion of mouse melanoma cells. J. Biol. Chem. 271: 14636–14641. [DOI] [PubMed] [Google Scholar]
- 28.Jayadev S., Liu B., Bielawska A. E., Lee J. Y., Nazaire F., Pushkareva M., Obeid L. M., Hannun Y. A. 1995. Role for ceramide in cell cycle arrest. J. Biol. Chem. 270: 2047–2052. [DOI] [PubMed] [Google Scholar]
- 29.Nelson D. H., Murray D. K. 1982. Dexamethasone increases the synthesis of sphingomyelin in 3T3–L1 cell membranes. Proc. Natl. Acad. Sci. USA. 79: 6690–6692. [DOI] [PMC free article] [PubMed] [Google Scholar]
- 30.Hirota K., Momoeda K., Ono K., Hanaoka K., Horikawa K., Okumura K., Iwamori M. 1995. Alteration in the reactivity of sphingomyelin in mitogen-stimulated lymphocytes. J. Biochem. 118: 4–8. [DOI] [PubMed] [Google Scholar]
- 31.Medarova Z., Moore A. 2007. Cellular and molecular imaging of the diabetic pancreas. In Molecular and Cellular MR Imaging Modo M. M. J., Bulte J. W. M., CRC Press, Boca Raton, FL: 343–369. [Google Scholar]
- 32.Verkleij A. J., Zwaal R. F., Roelofsen B., Comfurius P., Kastelijn D., van Deenen L. L. 1973. The asymmetric distribution of phospholipids in the human red cell membrane. A combined study using phospholipases and freeze-etch electron microscopy. Biochim. Biophys. Acta. 323: 178–193. [DOI] [PubMed] [Google Scholar]
- 33.Calderon R. O., DeVries G. H. 1997. Lipid composition and phospholipid asymmetry of membranes from a Schwann cell line. J. Neurosci. Res. 49: 372–380. [PubMed] [Google Scholar]
- 34.Simons K., Vaz W. L. 2004. Model systems, lipid rafts, and cell membranes. Annu. Rev. Biophys. Biomol. Struct. 33: 269–295. [DOI] [PubMed] [Google Scholar]
- 35.Lingwood D., Simons K. 2010. Lipid rafts as a membrane-organizing principle. Science. 327: 46–50. [DOI] [PubMed] [Google Scholar]
- 36.Tyteca D., D'Auria L., Der Smissen P. V., Medts T., Carpentier S., Monbaliu J. C., de Diesbach P., Courtoy P. J. 2010. Three unrelated sphingomyelin analogs spontaneously cluster into plasma membrane micrometric domains. Biochim. Biophys. Acta. 1798: 909–927. [DOI] [PubMed] [Google Scholar]
- 37.Harder T., Kellner R., Parton R. G., Gruenberg J. 1997. Specific release of membrane-bound annexin II and cortical cytoskeletal elements by sequestration of membrane cholesterol. Mol. Biol. Cell. 8: 533–545. [DOI] [PMC free article] [PubMed] [Google Scholar]
- 38.Luna E. J., Hitt A. L. 1992. Cytoskeleton-plasma membrane interactions. Science. 258: 955–964. [DOI] [PubMed] [Google Scholar]
Associated Data
This section collects any data citations, data availability statements, or supplementary materials included in this article.


