Abstract
The dosimetric accuracy of treatment planning systems (TPSs) decreases for locations outside the treatment field borders. However, the true accuracy of specific TPSs for locations beyond the treatment field borders is not well documented. Our objective was to quantify the accuracy of out-of-field dose predicted by the commercially available Eclipse version 8.6 TPS (Varian Medical Systems, Palo Alto, CA) for a clinical treatment delivered on a Varian Clinac 2100. We calculated (in the TPS) and determined (with thermoluminescent dosimeters) doses at a total of 238 points of measurement (with distance from the field edge ranging from 3.75 to 11.25 cm). Our comparisons determined that the Eclipse TPS underestimated out-of-field doses by an average of 40% over the range of distances examined. As the distance from the treatment field increased, the TPS underestimated the dose with increasing magnitude—up to 55% at 11.25 cm from the treatment field border. These data confirm that accuracy beyond the treatment border is inadequate, and out-of-field data from TPSs should be used only with a clear understanding of this limitation. Studies that require accurate out-of-field dose should use other dose reconstruction methods, such as direct measurements or Monte Carlo calculations.
1. Introduction
Radiotherapy treatment planning systems (TPSs) are not commissioned for out-of-field dose calculations (Aspradakis et al 2003, Das et al 2008) and the accuracy of TPS dose calculations is known to decrease beyond the borders of the treatment fields. However, the true accuracy of specific TPSs for out-of-field dose is not well documented in the literature. Because comparative effectiveness studies of radiotherapy techniques are becoming more common (Schneider et al 2000, Kry et al 2005, Howell et al 2006, Fontenot et al 2009), and because these studies typically begin with dosimetric comparisons of dose–volume histograms calculated by a TPS for the target volumes and organs at risk (OARs), including those outside the treatment field, it is becoming more important to accurately predict out-of-field dose. For example, Weber et al (2009) compared volumetric-modulated arc therapy and intensity-modulated radiation therapy for Hodgkin lymphoma, and noted that the TPS may have underestimated the dose to the out-of-field OARs because of limitations in its ability to accurately predict such dose. Given the potential consequences of under- or overestimation of dose (e.g. inaccurate dose values applied to risk of second cancers) it would be useful to document the accuracy of out-of-field dose for specific TPSs. Such data would help researchers and clinicians determine when TPS data should be supplemented by either measurements in a phantom or calculations from other analytical models or Monte Carlo simulations. Therefore, the objective of this work was to quantify the accuracy of out-of-field dose for a commonly used, commercially available TPS, Eclipse version 8.6 (Varian Medical Systems, Palo Alto, CA). Specifically, we compared calculated doses from the TPS with doses determined from measurements (hereafter referred to as measured doses) in an anthropomorphic phantom for a clinical treatment delivered with a commonly used linear accelerator (linac), the Clinac 2100 (Varian Medical Systems, Palo Alto, CA).
2. Materials and methods
2.1. Treatment plan
A standard, clinically relevant treatment plan was selected for use in this study. The treatment plan was designed to be representative of a historic mantle field irradiation and consisted of two opposed 6 MV photon beams, one anterior and one posterior, with custom blocks to shield the lungs. The treatment plan was developed for previous work by Scarboro et al (2010) and was created on a computed tomography (CT) dataset of the ATOM anthropomorphic male reference phantom (CIRS, Inc., Norfolk, VA) rather than an actual patient data set. The phantom is composed of tissue-equivalent material of various densities representing bone, lung, brain and soft tissue (ICRP-23 1975). The phantom size represents the height and weight of an average adult male and is horizontally transected into 39 2.5-cm-thick slices. The plan was calculated using Eclipse’s analytic anisotropic algorithm (AAA) version 8.6 with heterogeneity corrections and a 2 mm grid size. Prior to this study, the treatment planning system was fully commissioned and validated by an American Board of Radiology (ABR)-certified medical physicist for use in our clinic using the methodology described by Das et al (2008).
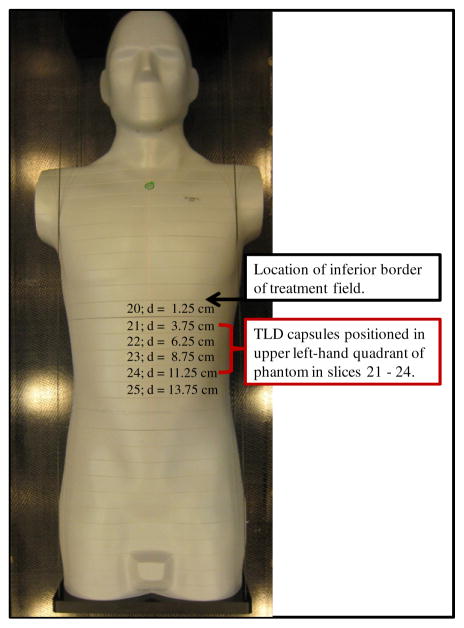
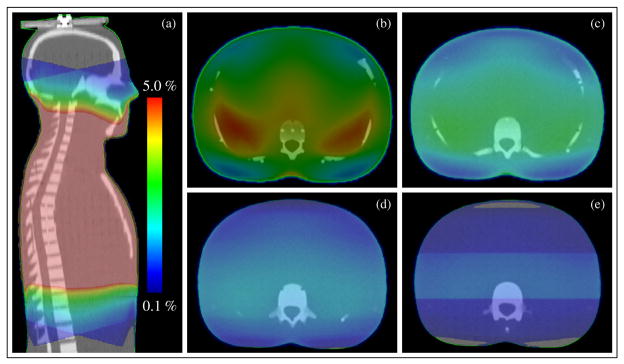
The inferior edge of the mantle fields abutted the superior border of slice 20 of the phantom. The TPS calculation grid extended approximately 12.5 cm inferior to the field border, through slice 24 of the phantom. The fully assembled phantom is shown in figure 1. The out-of-field dose distribution (range of 5% to 0.1% of prescription dose) reported by the treatment planning system is shown in figure 2.
Figure 1.
Phantom used for TLD measurements. The inferior edge of the treatment field abutted the superior border of slice 20 of the phantom. TLD capsules were loaded in slices 21 through slice 24 of the phantom, corresponding to distances of 3.75 cm to 11.25 cm from the field edge.
Figure 2.
Out-of-field dose reported by the treatment planning system. Dose scale is set to show 5% to 0.1% of the prescription dose. Dose color wash distributions are shown for (a) sagittal view and axial plane at the center of phantom slices: (b) slice 21, (c) slice 22, (d) slice 23 and (e) slice 24. Note that all dose values above 5% are at the center of the phantom and are shown in dark pink.
2.2. Phantom irradiation
Within each slice of the phantom, there is a 1.5 cm × 1.5 cm grid for thermoluminescent detector (TLD) capsule placement. To determine the out-of-field dose throughout a representative region of the phantom, we loaded the upper left-hand quadrant of each phantom slice of interest (slices 21–24, all inferior to the treatment fields) with approximately 60 (total 238) LiF TLD-100 (Quantaflux Radiological Services, San Jose, CA) capsules. Each TLD capsule was 2.5 cm long (corresponding to the phantom slice thickness) and contained TLD powder at its center. The measurement points within slice 21 were ≥ 3.75 cm inferior to the treatment field, corresponding to TPS-reported dose values below the 5% isodose value. The plane of TLD capsules in each slice corresponded to a specified distance from the field edge, and these distances can be found in table 1 and figure 1.
Table 1.
Mean measured doses (μmeas ± σ) and mean TPS-calculated doses (μcalc ± σ) for all TLD data for each phantom slice and for all phantom slices. The standard deviation (σ) is reported as one standard deviation of the mean. This value is dominated by the spread of doses across each phantom slice as compared to an additional standard uncertainty in each TLD measurement of ≤3%.
| Phantom slice | Distance from field edge (cm) | Count | μcalc, cGy/GyRx (σ) | μmeas, cGy/GyRX (σ) | Mean TPS underestimation of measured dose (σ) | |||
|---|---|---|---|---|---|---|---|---|
| 21 | 3.75 | 56 | 3.08 | (0.61) | 4.24 | (0.45) | 28% | (17%) |
| 22 | 6.25 | 59 | 2.02 | (0.43) | 3.01 | (0.24) | 32% | (12%) |
| 23 | 8.75 | 62 | 1.16 | (0.32) | 2.09 | (0.14) | 44% | (15%) |
| 24 | 11.25 | 61 | 0.66 | (0.33) | 1.49 | (0.13) | 55% | (23%) |
| All slices | N/A | 238 | 1.7 | (1.01) | 2.65 | (1.05) | 40% | (20%) |
cGy/GyRx: cGy per prescribed Gy.
The phantom was irradiated on a Varian Clinac 2100 at The University of Texas M D Anderson Cancer Center (Houston, TX) using the treatment plan described above. The linac used in this study was calibrated by an ABR certified medical physicist according to the American Association of Physicists in Medicine Task Group 51 calibration protocol (Almond et al 1999). Additionally, for this study, the linac output was verified on the day of phantom irradiation. A total of 30 Gy was delivered to the treatment isocenter in a single irradiation using 6 MV photons. This corresponded to a range of doses to the TLD of 50–500 cGy.
2.3. TLD analysis
TLD analysis was performed using an established protocol that is consistent with Accredited Dosimetry Calibration Laboratory (ADCL) procedures. Important details of the protocol are provided here, while the full protocol is thoroughly described in the literature (Kirby et al 1986, 1992). The protocol accounts for system sensitivity, energy response, linearity and dosimeter fading; in total the TLD system has a reported uncertainty of ≤3%. For the purpose of this study, standards and controls were both irradiated using two Co-60 units, one of which has been certified and maintained by an ADCL and the other of which was cross-calibrated within our institution. A nanocoulomb-to-centigray calibration coefficient was established from a set of reference TLDs irradiated with the ADCL-certified Co-60 unit. The readings from the TLD capsules in the phantom were converted to dose in muscle using the calibration factor and necessary correction factors and then normalized per centigray delivered to the isocenter.
2.4. Accuracy of the TPS-calculated out-of-field dose
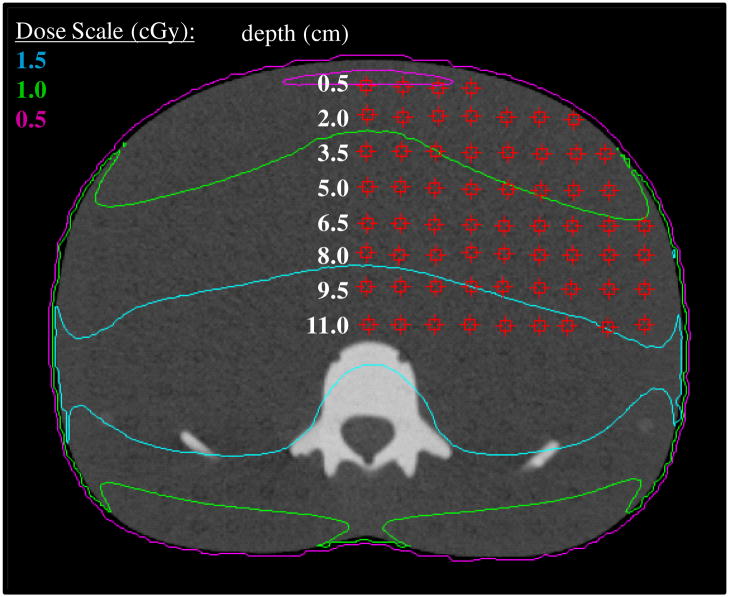
We compared the point dose value reported by the TPS to the TLD-measured dose at the equivalent location for all 238 measurement locations. The TPS point doses were each determined at the center of the phantom slice using the point dose tool. Each measured data point represented a single TLD capsule lying at the equivalent position in the phantom. Each slice included approximately 60 TLD. An example of the data point grid for one phantom slice, slice 23, is provided in figure 3. Each row of TLDs in figure 3 is labeled according to its depth from the anterior surface of the phantom. Similar grids were defined for slices 20, 21 and 24. Mean dose and standard deviation about the mean were calculated for all TLD-measured (μmeas ± σ) and TPS-calculated (μcalc ± σ) data for each phantom slice (included all depths). In addition, we calculated μmeas and μcalc for each phantom slice at a depth of 9.5 cm which corresponded approximately to the mid-plane depth for each slice. The standard deviation (σ) is reported as one standard deviation of the mean. This value is dominated by the spread of doses across each phantom slice as compared to an additional standard uncertainty in each TLD measurement of ≤ 3%
Figure 3.
Axial image for slice 23 of the phantom corresponding to the center of the phantom, with the data point grid shown by red squares. Within the TPS, point doses were determined at each location on the grid using the point dose measurement tool. Each point within the point dose grid corresponds to a single TLD capsule lying at the equivalent position in the phantom.
3. Results
Table 1 shows the mean and standard deviation for each of the calculated (μcalc ± σ) and measured (μmeas ± σ) doses. The standard deviations provide a measure of the spread of values rather than an estimate of uncertainty in the data. The total number of TLDs per phantom slice, the distance of the measurement plane of each phantom slice from the field edge and the degree to which the TPS calculations underestimated the actual measured doses are also provided in table 1.
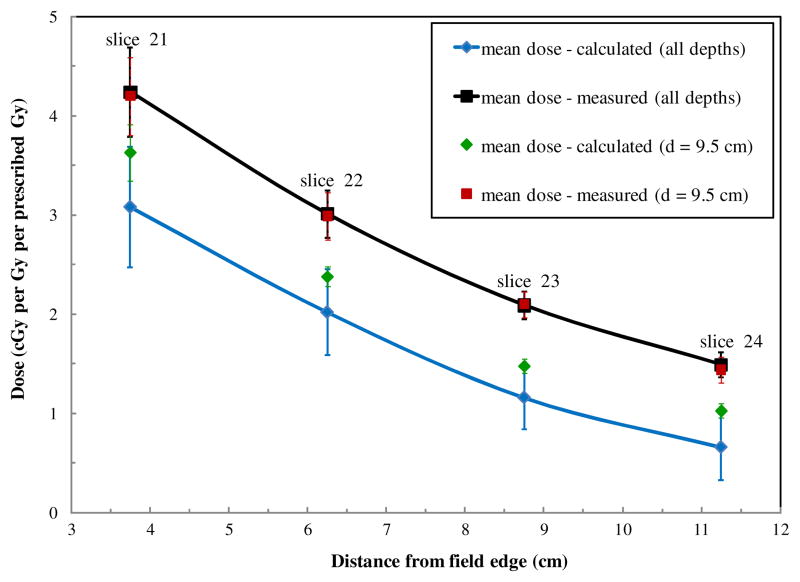
Figure 4 shows the variation in the mean calculated dose and mean measured dose for all locations within each phantom slice as a function of the distance from the field edge. We found that in the range of 3.75–11.25 cm from the edge of the treatment field, the TPS underestimated dose by an average of 40% ± 20%. As the distance from the treatment field increased, the TPS underestimated the dose with increasing magnitude. Also shown in figure 4 are the mean doses for all TLDs within each phantom slice at a single depth of 9.5 cm from the anterior surface of the phantom (approximately mid-plane) as a function of distance from the field edge. The mean TPS-calculated dose for all depths was approximately 20% lower (range 15–25% lower, depending on distance) than the mean TPS-calculated dose at a depth of 9.5 cm at all distances from the field edge. Conversely, the mean dose measured at all depths was similar to the mean dose measured at a depth of 9.5 cm at all distances from the field edge.
Figure 4.
Plots of mean measured and calculated doses. Mean dose (μ ± σ) was calculated for all TLDs in each phantom slice (corresponding to specific distances from the field edge). Also shown are mean measured and calculated doses along the mid-plane (depth = 9.5 cm) for each phantom slice. The uncertainty bars on each data point represent one standard deviation of the mean. This value is dominated by the spread of doses across each phantom slice as compared to an additional standard uncertainty in each TLD measurement of ≤3%.
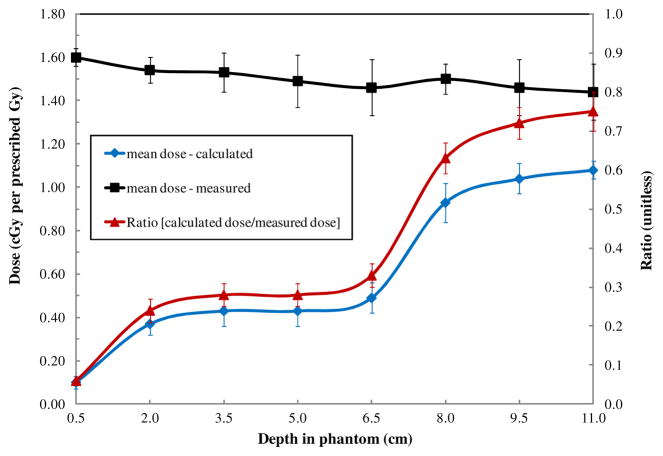
Variations in measured and calculated dose with depth in the phantom at a given distance from the field edge (11.25 cm from the treatment field (phantom slice 24)) are shown in figure 5. At all depths, the measured doses were higher than the calculated doses. We found that calculated doses at a given distance from the treatment field varied substantially with depth, with lower doses at shallow depths and higher doses at deeper ones. However, the measured data did not show a corresponding trend. Measured doses at a given distance remained essentially constant with increasing depth in phantom. These two observations further highlight the observation in figure 4, that the TPS-calculated dose varies with depth (i.e. data at a single depth differ from data averaged over all depths) whereas measured data show little variation with depth. The ratio of mean measured to calculated doses, also shown in figure 5, followed the same trend as the calculated data; that is, the underestimation of dose by the TPS was greater at shallow depths than at deeper depths.
Figure 5.
Mean measured and calculated absorbed doses at various depths in the phantom at a constant distance of 11.25 cm from the edge of the treatment field (i.e. in phantom slice 24). The uncertainty bars on each data point represent one standard deviation of the mean. This value is dominated by the spread of doses across each phantom slice as compared to an additional standard uncertainty in each TLD measurement of ≤3%.
4. Discussion
In this study, we quantified the accuracy of the out-of-field dose calculated by the Eclipse TPS for a clinical treatment delivered with a Varian 2100 Clinac. The results show that in comparison with measured data, the calculated dose underestimated the actual dose by 40% ± 20% on average for the example examined here. The underestimation of dose increased with increasing distance from the field edge. The largest disagreement was observed in the most inferior slice of the phantom for which the treatment planning system reported dose (slice 24, near the edge of the calculation grid). For this slice of the phantom, the dose calculations are not able to account for missing scatter from slices beyond the calculation grid. We also found that calculated doses at a given distance from the treatment field varied substantially with depth, while measured doses remained constant.
Comparing the dose distributions in figures 2(b)–(e), it appears that the TPS applies a scaling function to out-of-field dose (i.e. that it decreases the intensity of out-of-field dose as the distance from the field edge increases). This trend is likely related to how the TPS models out-of-field dose. The Eclipse AAA models extra-focal photon radiation (all photons emerging from outside the target) using a finite-size virtual source (referred to as the second source). The second source has a Gaussian intensity distribution. According to the Eclipse manual (2008) the second source energy fluence is defined at an arbitrary plane and is computed by adding the contributions from each element of the source for each pixel in the destination fluence array. The contribution is scaled by the Gaussian weight of the source element, by the inverse square of the distance between the elements at the source and destination planes, and by the cosine of the ray angle. In contrast to how the out-of-field dose is modeled in Eclipse, the out-of-field dose is actually composed of scatter and leakage radiation and is underestimated by the Gaussian intensity distribution as demonstrated by the results of this study.
Measured doses in this study are consistent with our earlier findings (Scarboro et al 2010); there we compared data measured at 9.5 cm in depth to those reported in American Association of Physicists in Medicine Task Group Report Number 36 (TG-36) (Stovall et al 1995) and found that data measured in an anthropomorphic phantom for a modern Varian linac were approximately 39% higher than the dose values reported in TG-36. This finding is also consistent with work by Kry et al (2007b), who found that TG-36 underestimated the dose measured in anthropomorphic phantoms for clinical treatments with modern accelerators by approximately 31%.
Numerous previous studies have demonstrated that the Eclipse AAA accurately calculates the dose inside the treatment field and within the penumbra region in both water and heterogeneous media (Aspradakis et al 2003, Sievinen et al 2005, Fogliata et al 2006, 2008, Huyskens et al 2006, Murray et al 2006, Van Esch et al 2006, Breitman et al 2007, Tillikainen et al 2008). In general, the inaccuracies reported in this study are for low dose regions at large distances outside the irradiation target and are of modest significance when considering acute toxicities. The impact of this work is therefore reserved for situations where low doses are relevant. This would include use of low dose information for the evaluation of late effects such as second cancers, and for the development dose response models for these low dose effects. In these cases, the errors in excess of 50% reported in this study are relevant. A 50% change in low dose was suggested as sufficient to cause a significant difference in second cancer risk (Kry et al 2007a).
Our results were specific to the Eclipse TPS version 8.6 and Varian 2100 Clinac; the exact amount that a different TPS and linac combination may estimate out of field dose is dependent on the particular algorithm used, the commissioning data and the manufacturer. Future work is needed to examine several commercially available TPSs and linacs. In this study, we considered only one simple conventional beam arrangement with a single field size. The accuracy of TPS calculations for out-of-field dose may also be affected by beam angle, field size and delivery technique, e.g. intensity-modulated versus conventional radiation therapy. Thus, future work should consider a variety of field sizes, beam orientations and delivery techniques.
5. Conclusions
We determined that the Eclipse TPS underestimated doses far outside the treatment field by an average of 40% for a clinical treatment delivered on a Varian Clinac 2100. While inaccuracies in dose predictions may vary between TPSs and linacs, this result quantifies the accuracy of this particular TPS at distances several centimeters beyond the treatment border. Out-of-field data from this and other TPSs should only be used with a clear understanding of the accuracy of dose calculations outside the treatment field. Studies that require accurate out-of-field doses should use other dose reconstruction methods, such as measurements or simulated phantom calculations. These alternative methods have been described in detail in the literature (Stovall et al 2006) and provide the necessary accuracy for rigorous studies.
Acknowledgments
We would like to thank Kathryn B Carnes for reviewing and scientific editing of this manuscript. This work was funded by a K01 Career Development grant (5K01CA125204-04; Howell) and an award from the American Legion Auxiliary (Scarboro).
References
- Almond PR, Biggs PJ, Coursey BM, Hanson WF, Huq MS, Nath R, Rogers DWO. AAPM’s TG-51 protocol for clinical reference dosimetry of high-energy photon and electron beams. Med Phys. 1999;26:1847–70. doi: 10.1118/1.598691. [DOI] [PubMed] [Google Scholar]
- Aspradakis MM, Morrison RH, Richmond ND, Steele A. Experimental verification of convolution/superposition photon dose calculations for radiotherapy treatment planning. Phys Med Biol. 2003;48:2873–93. doi: 10.1088/0031-9155/48/17/309. [DOI] [PubMed] [Google Scholar]
- Breitman K, et al. Experimental validation of the eclipse AAA algorithm. J Appl Clin Med Phys. 2007;8:76–92. doi: 10.1120/jacmp.v8i2.2350. [DOI] [PMC free article] [PubMed] [Google Scholar]
- Das IJ, Cheng CW, Watts RJ, Ahnesjo A, Gibbons J, Li XA, Lowenstein J, Mitra RK, Simon WE, Zhu TC. Accelerator beam data commissioning equipment and procedures: report of the TG-106 of the therapy physics committee of the AAPM. Med Phys. 2008;35:4186–215. doi: 10.1118/1.2969070. [DOI] [PubMed] [Google Scholar]
- Fogliata A, Nicolini G, Vanetti E, Clivio A, Cozzi L. Dosimetric validation of the anisotropic analytical algorithm for photon dose calculation: fundamental characterization in water. Phys Med Biol. 2006;51:1421–38. doi: 10.1088/0031-9155/51/6/004. [DOI] [PubMed] [Google Scholar]
- Fogliata A, Nicolini G, Vanetti E, Clivio A, Winkler P, Cozzi L. The impact of photon dose calculation algorithms on expected dose distributions in lungs under different respiratory phases. Phys Med Biol. 2008;53:2375–90. doi: 10.1088/0031-9155/53/9/011. [DOI] [PubMed] [Google Scholar]
- Fontenot JD, Lee AK, Newhauser WD. Risk of secondary malignant neoplasms from proton therapy and intensity-modulated x-ray therapy for early-stage prostate cancer. Int J Radiat Oncol Biol Phys. 2009;74:616–22. doi: 10.1016/j.ijrobp.2009.01.001. [DOI] [PMC free article] [PubMed] [Google Scholar]
- Howell RM, Hertel NE, Wang ZL, Hutchinson J, Fullerton GD. Calculation of effective dose from measurements of secondary neutron spectra and scattered photon dose from dynamic MLC IMRT for 6 MV, 15 MV, and 18 MV beam energies. Med Phys. 2006;33:360–8. doi: 10.1118/1.2140119. [DOI] [PubMed] [Google Scholar]
- Huyskens D, Van Esch A, Pyykkonen J, Tenhunen M, Hannu Helminen H, Tillikainen L, Siljamaki S, Alakuijala J. Improved photon dose calculation in the lung with the analytical anisotropic algorithm (AAA) Radiother Oncol. 2006;81:S513. doi: 10.1118/1.2358333. [DOI] [PubMed] [Google Scholar]
- ICRP. ICRP-23. Oxford: Pergamon; 1975. International Commission on Radiation Protection Report of the Task Group on Reference Man. [Google Scholar]
- Kirby TH, Hanson WF, Gastorf RJ, Chu CH, Shalek RJ. Mailable TLD system for photon and electron therapy beams. Int J Radiat Oncol Biol Phys. 1986;12:261–5. doi: 10.1016/0360-3016(86)90107-0. [DOI] [PubMed] [Google Scholar]
- Kirby TH, Hanson WF, Johnston DA. Uncertainty analysis of absorbed dose calculations from thermoluminescence dosimeters. Med Phys. 1992;19:1427–33. doi: 10.1118/1.596797. [DOI] [PubMed] [Google Scholar]
- Kry SF, Followill D, White RA, Stovall M, Kuban DA, Salehpour M. Uncertainty of calculated risk estimates for secondary malignancies after radiotherapy. Int J Radiat Oncol Biol Phys. 2007a;68:1265–71. doi: 10.1016/j.ijrobp.2007.04.014. [DOI] [PubMed] [Google Scholar]
- Kry SF, Salehpour M, Followill DS, Stovall M, Kuban DA, White RA, Rosen II. The calculated risk of fatal secondary malignancies from intensity-modulated radiation therapy. Int J Radiat Oncol Biol Phys. 2005;62:1195–203. doi: 10.1016/j.ijrobp.2005.03.053. [DOI] [PubMed] [Google Scholar]
- Kry SF, Starkschall G, Antolak JA, Salehpour M. Evaluation of the accuracy of fetal dose estimates using TG-36 data. Med Phys. 2007b;34:1193–7. doi: 10.1118/1.2710332. [DOI] [PubMed] [Google Scholar]
- Murray B, et al. Experimental validation of the eclipse AAA algorithm. Med Phys. 2006;33:2661. doi: 10.1120/jacmp.v8i2.2350. [DOI] [PMC free article] [PubMed] [Google Scholar]
- Scarboro SB, Stovall M, White A, Smith SA, Yaldo D, Kry SF, Howell RM. Effect of organ size and position on out-of-field dose distributions during radiation therapy. Phys Med Biol. 2010;55:7025–36. doi: 10.1088/0031-9155/55/23/S05. [DOI] [PMC free article] [PubMed] [Google Scholar]
- Schneider U, Lomax A, Lombriser N. Comparative risk assessment of secondary cancer incidence after treatment of Hodgkin’s disease with photon and proton radiation. Radiat Res. 2000;154:382–8. doi: 10.1667/0033-7587(2000)154[0382:craosc]2.0.co;2. [DOI] [PubMed] [Google Scholar]
- Sievinen J, Ulmer W, Kaissl W. AAA Photon Dose Calculation Model in Eclipse. Palo Alto, CA: Varian Medical Systems; 2005. [Google Scholar]
- Stovall M, Blackwell CR, Cundiff J, Novack DH, Palta JR, Wagner LK, Webster EW, Shalek RJ. Fetal dose from radiotherapy with photon beams: report of AAPM radiation therapy committee task group no. 36. Med Phys. 1995;22:63–82. doi: 10.1118/1.597525. [DOI] [PubMed] [Google Scholar]
- Stovall M, Weathers R, Kasper C, Smith SA, Travis L, Ron E, Kleinerman R. Dose reconstruction for therapeutic and diagnostic radiation exposures: use in epidemiological studies. Radiat Res. 2006;166:141–57. doi: 10.1667/RR3525.1. [DOI] [PubMed] [Google Scholar]
- Tillikainen L, Helminen H, Torsti T, Siljamaki S, Alakuijala J, Pyyry J, Ulmer W. A 3D pencil-beam-based superposition algorithm for photon dose calculation in heterogeneous media. Phys Med Biol. 2008;53:3821–39. doi: 10.1088/0031-9155/53/14/008. [DOI] [PubMed] [Google Scholar]
- Van Esch A, Tillikainen L, Pyykkonen J, Tenhunen M, Helminen H, Siljamaki S, Alakuijala J, Paiusco M, Iori M, Huyskens DP. Testing of the analytical anisotropic algorithm for photon dose calculation. Med Phys. 2006;33:4130–48. doi: 10.1118/1.2358333. [DOI] [PubMed] [Google Scholar]
- Varian Medical Systems I. Eclipse Algorithms Reference Guide, Version 86. Palo Alto, CA: Varian Medical Systems; 2008. [Google Scholar]
- Weber DC, Peguret N, Dipasquale G, Cozzi L. Involved-node and involved-field volumetric modulated arc vs. fixed beam intensity-modulated radiotherapy for female patients with early-stage supra-diaphragmatic Hodgkin lymphoma: a comparative planning study. Int J Radiat Oncol Biol Phys. 2009;75:1578–86. doi: 10.1016/j.ijrobp.2009.05.012. [DOI] [PubMed] [Google Scholar]


