


Abstract
Multicloning sites (MCSs) in standard expression vectors are widely used and thought to be benign, non-interacting elements that exist for mere convenience. However, MCSs impose a necessary distance between promoter elements and genes of interest. As a result, the choice of cloning site defines the genetic context and may introduce significant mRNA secondary structure in the 5′-untranslated region leading to strong translation inhibition. Here, we demonstrate the first performance-based assessment of MCSs in yeast, showing that commonly used MCSs can induce dramatic reductions in protein expression, and that this inhibition is highly promoter and gene dependent. In response, we develop and apply a novel predictive model of structure-based translation inhibition to design improved MCSs for significantly higher and more consistent protein expression. In doing so, we were able to minimize the inhibitory effects of MCSs with the yeast TEF, CYC and GPD promoters. These results highlight the non-interchangeable nature of biological parts and represent the first complete, global redesign of a genetic circuit of such widespread importance as a multicloning site. The improved translational control offered by these designed MCSs is paramount to obtaining high titers of heterologous proteins in eukaryotes and to enabling precise control of genetic circuits.
INTRODUCTION
Expression vectors with predefined multiple cloning sites (MCSs) are among the most common tools employed in molecular biology and genetics. These vectors have enabled the facile expression and cloning of recombinant genes and have recently ushered in the era of synthetic biology (1). The flexibility of restriction enzyme sites in MCSs facilitate easy cloning of genes of interest for diverse applications from genetic analysis to creation of biofuels-producing strains. Common improvements to vectors containing MCSs are focused at controlling transcript levels [via promoter replacement/engineering (2), transcription machinery engineering (3) or copy number manipulations (4)] or translation rate [e.g. by improving codon bias (5) or by reducing expression noise (6)]. In all these applications, multiple cloning sites are thought to be benign, non-interacting elements that exist for mere convenience. However, a promoter element is usually placed upstream of the MCS. As a result, several base pairs (or even multiple restriction sites) will appear in the 5′-untranslated region (5′-UTR) of the mRNA of the cloned gene depending on the restriction site chosen. Thus, it is conceivable that the composition of these sites can significantly influence translation efficiencies of the downstream gene. Here, we demonstrate the first performance-based assessment of multiple cloning sites and develop a novel theoretical framework enabling the prediction of a MCS's effect on translation. Furthermore, we apply this understanding to rationally redesign these sites for improved function and reduced variability associated with restriction enzyme choice. We posit that this phenomenon of 5′-UTR structure inhibition is most pronounced when using shorter, codon-optimized genes.
Secondary structure in the 5′-UTR of mRNA has been found to affect expression in both prokaryotes (7,8) and eukaryotes (9–14) at the translational level. In prokaryotes, translation is initiated by the assembly of the 70S initiation complex on the ribosome binding site (RBS), normally within a few base pairs of the start codon, and it is thought that RNA secondary structure can inhibit translation by occluding the RBS (7,15). In fact, predictive models of RBS performance explicitly treat the inhibitory effect of 5′-UTR secondary structure (7). Due to the differences in translation initiation in prokaryotes, the design criteria of prior methods would be of little use in highly relevant eukaryotic systems such as Saccharomyces cerevisiae. Hence, a novel modeling approach resulting from a distinct theoretical framework is needed to address the issue of 5′-UTR secondary structure for yeast systems. In eukaryotes, the 43S initiation complex must scan along the 5′-UTR before commencing translation at the start codon, often 50 bp or more from the 5′-cap structure (15). It has been hypothesized that the presence of secondary structure in these organisms decreases the rate of translation initiation by impeding ribosome scanning (12). Multicloning sites impose distance (and therefore a high likelihood of structure) between a promoter and the gene of interest in a restriction site-dependent manner, leading to the hypothesis that cloning location affects protein expression, especially in eukaryotes. In several cases, irreproducible or conflicting results have been explained by differences in restriction site usage (16,17). However, most attempts at mitigating translation-inhibiting secondary structure in eukaryotes result in ‘quick fixes’ such as point mutations, which are only applicable for the precise gene construct under consideration (18–22). Moreover, no prior work has successfully minimized secondary structure to optimize a genetic component of such widespread importance as the multicloning site or to develop a system which achieves nearly context-independent levels of protein expression, both of which are of critical significance to obtaining high titers of heterologous proteins in eukaryotes and to enabling precise control of genetic circuits. Therefore, due to their enormous utility and widespread use for heterologous gene expression, the characterization and optimization of MCSs to minimize the effects of mRNA structure in a more general context represents a promising and novel avenue toward improving protein titers and controlling protein production.
A variety of algorithms exist for the prediction of RNA secondary structure (23–25). A common approach is to compute the free energy of the strand of interest through a partition function, using empirically determined base-stacking energies to weight each possible conformation (26,27). One limitation of this approach is that enumeration of all possible conformations becomes impractical for large strands, so certain classes of folds (e.g. pseudoknots) are commonly ignored, though are possibly significant. It is important to note that a strand's free energy of folding computed in this manner is not a simple function of its composition. Since MCSs must additionally contain certain sequence motifs, any attempt to rationally design MCSs based on minimized free energy is prohibitively difficult, necessitating the use of a metaheuristic such as a genetic or hill-climbing algorithm. This difficulty is exacerbated by the requirement that designed MCSs refrain from folding regardless of where the gene of interest is inserted, highlighting the potential rarity of desirable MCSs.
In this study, we establish the variations in downstream protein translation imparted by multicloning sites and isolate the effect of secondary structure-based inhibition especially in cases of short, codon-optimized genes. This effect is demonstrated using the MCS of a common yeast vector system (28,29). Due to the unacceptably large variance found along the cloning site, a predictive model was developed to redesign multiple cloning sites with minimized secondary structure and thus improved mRNA translation. These models led to promoter specific, redesigned multiple cloning sites that outperform standard constructs.
MATERIALS AND METHODS
Strains and media
Yeast expression vectors were propagated in Escherichia coli DH10β. All yeast experiments were carried out in S. cerevisiae BY4741 (MATa; his3Δ1; leu2Δ0; met15Δ0; ura3Δ0) obtained from EUROSCARF, Frankfurt, Germany. Escherichia coli strains were routinely cultivated in Lysogeny Broth (LB) medium (30) (Teknova) at 37°C with 225 RPM orbital shaking. LB was supplemented with 100 µg/ml ampicillin (Sigma) when needed for plasmid maintenance and propagation. Yeast strains were cultivated on a yeast synthetic complete (YSC) medium containing 6.7 g of Yeast Nitrogen Base (Difco)/l, 20 g glucose/l and a mixture of appropriate nucleotides and amino acids (CSM-URA, Qbiogene) referred to here as YSC Ura−. All medium was supplemented with 1.5% agar for solid media.
For E. coli transformations, 25 µl of electrocompetent E. coli DH10β (30) were mixed with 30 ng of ligated DNA and electroporated [2 mm Electrporation Cuvettes (Bioexpress) with Biorad Genepulser Xcell] at 2.5 kV. Transformants were rescued for 1 h at 37°C in 1 ml SOC Buffer (Cellgro), plated on LB agar and incubated overnight. Single clones were amplified in 5 ml LB medium and incubated overnight at 37°C. Plasmids were isolated (QIAprep Spin Miniprep Kit, Qiagen) and confirmed by sequencing.
For yeast transformations, 50 µl of chemically competent S. cerevisiae BY4741 were transformed with 1 µg purified plasmid according to manufacturer's instructions (Frozen EZ Yeast Transformation II Kit, Zymo Research), plated on YSC Ura− agar, and incubated for 2 days at 30°C. Single colonies were picked into 5 ml YSC Ura− and incubated at 30°C.
Plasmid construction
Cloning procedures
PCR reactions were performed with Phusion DNA Polymerase (Finnzymes Inc.) according to manufacturer specifications. Digestions were performed according to manufacturer's (NEB) instructions, with digestions close to the end of a linearized strand running overnight and digestions of circular strands running for 1 h at 37°C. PCR products and digestions were cleaned with a QIAquick PCR Purification Kit (Qiagen). Phosphatase reactions were performed with Antarctic Phosphatase (NEB) according to manufacturer's instructions and heat-inactivated for 15 min at 65°C. Ligations (T4 DNA Ligase, Fermentas) were performed for 6 h at 22°C followed by heat inactivation at 65°C for 15 min.
yECitrine pBLUESCRIPT SK multicloning site series
yECitrine was cloned from pT5Y (Supplementary Table S1) using PCR. Primers matching 29 bp of yECitrine were used to add restriction sites to both ends of the gene, for a total of eight different yECitrine PCR products (forward primers: 16–23, reverse primer: 25). After digestion, these yECitrine fragments were each ligated separately into the multi-cloning sites of p416-TEF, p416-GPD and p416-CYC. The pCYC0xYFP series used oligo 26 as reverse primer because the XhoI site is not unique in p416-CYC. pGPD06YFP, pTEF06YFP, pCYC06YFP and pCYC08YFP were made with assembly PCR [see Designed Multicloning Site Series. TEFp, GPDp or CYC1p, CYC1 terminator, and assembly oligos (pGPD06YFP, pTEF06YFP and pCYC06YFP: 28,29, pCYC08YFP: 28 and 30) comprised the first reaction. Full-length product was amplified, digested and ligated as for the designed MCS series]. pCYC09YFP was constructed by swapping CYC1 for GPD in construct pGPD09YFP through SacI–XbaI fragmentation. This resulted in 27 distinct plasmids (Supplementary Table S4).
yECitrine designed multicloning site series
Novel MCSs were generated with assembly PCR. PCR products of TEFp (primers 31–32), GPDp (primers 33–34) or CYC1p (primers 35–36) were combined with CYC1 terminator (primers 37–38) and assembly oligos (39–42, 43–45, 46–48, 49–52 or 53–56) at 30 nM each and amplified (94°C for 1 min, 68°C for 2 min, 72°C for 3 min, 25 cycles). Full-length product was then amplified from 2.5 µl of this mixture (forward primers 31, 33 or 35; reverse primer 38), digested with SacI and KpnI and ligated to a phosphatased SacI–KpnI fragment of p416. yECitrine was inserted at each restriction site as for the pBLUESCRIPT SK series (forward primers 16–24, reverse primers 25, 26 or 57 as necessary) resulting in the constructs shown in Supplementary Table S2. pCYC111YFP was constructed with CYC1p, CYC1 terminator and primer 58 using assembly PCR because XhoI is not unique in this construct.
LacZ pBLUESCRIPT SK multicloning site series
LacZ was isolated from whole-genome extract of E. coli K12-MG1665 (Wizard Genomic DNA Purification Kit, Promega) with PCR (primers 59–60), fragmented with XbaI and ClaI and ligated to p416-GPD. LacZ was inserted at XbaI as for the pBLUESCRIPT SK series (primers 61–62). pTEF03LacZ, pTEF05LacZ, pTEF07LacZ and pTEF09LacZ were constructed using assembly PCR [LacZ-CYC1term (primers 38 and 63) and assembly oligos (pTEF03LacZ: 65, pTEF05LacZ: 66–67, pTEF07LacZ: 66 and 68, pTEF09LacZ: 66, 69–70) comprised the first reaction. Full-length product was amplified in a second reaction (primers 38 and 64)]. Each product was digested with XbaI and KpnI, and ligated to p416-TEF. The resulting plasmids are shown in Supplementary Table S5.
GFP pBLUESCRIPT SK multicloning site series
GFP was isolated from pZE-GFP (31) using PCR (forward primers 71–75, reverse primer 76), fragmented and ligated to p416-TEF at XbaI, BamHI, EcoRI, ClaI and XhoI as for the pBLUESCRIPT SK series. The resulting plasmids are shown in (Supplementary Table S6).
Flow cytometry analysis
Yeast colonies were picked in triplicate, grown in YSC Ura− to mid-log phase, resuspended to an optical density of 0.5 in ice-cold water, and analyzed (FACSCalibur Flow Cytometer, BD Biosciences. Excitation wavelength: 488 nm, detection wavelength: 530 nm). Day-to-day variability was accounted for by analyzing all comparable transformants on the same day. An average fluorescence and standard deviation was calculated from the mean values for the biological replicates. Flow cytometry data was analyzed using FlowJo software.
β-Galactosidase assay
Yeast colonies were picked in triplicate, grown in YSC Ura− to an optical density of 0.5, and prepared according to manufacturer's instructions (Novabright β-Galactosidase Enzyme Reporter Gene Chemiluminescent Detection Kit for Yeast Cells, Invitrogen). Luminescence was quantified with a SpectraMax M3 Multi-Mode Microplate Reader (Molecular Devices). Day-to-day variability was accounted for by analyzing all comparable transformants on the same day.
Computational studies and modeling efforts
Nupack2.1.2 (24) was used to perform all RNA folding calculations. Folding conditions of 30°C, 1 M Na+ and 0 M Mg2+ were utilized. All reported energies are the free energies of the ensemble of potential structures, as opposed to the minimum free energy structure. Pseudoknots were not considered due to computational limitations. First and second round computations were run on an intel Xeon processor running MATLAB. Third round computations were run on all cores of an intel core i7 processor running MATLAB. Most optimizations were run over 24 h.
First round of optimization
The first set of MCSs (pTEF1xYFP and pCYC11xYFP) were designed with the goal of maximizing the ensemble free energy of the complete 5′-UTR (32–35). Design proceeded using a hill-climbing algorithm in a two-step process, using the free energy of the longest possible 5′-UTR (i.e. cloning into the last possible restriction site in the MCS) as its score. The restriction sites were first reordered to maximize free energy, followed by the addition of up to 5 bp between each restriction site to further increase free energy (Figure 1B and C).
Figure 1.

Model construction and multicloning site design methodology. (A) The first round of modeling implemented a hill-climbing algorithm to search for regions of the mRNA whose free energy of folding correlated strongly with fluorescence. MCSs were then designed via a two-step process, (B) a hill-climbing algorithm to find the optimal ordering of restriction sites followed by, (C) a hill-climbing algorithm to further decrease the likelihood of secondary structure formation and (D) the second round of modeling undertook an exhaustive search of all possible pairs of regions to find the set which showed the greatest predictive ability.
Second round of modeling and optimization
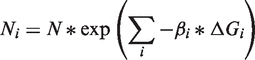
To address the limitations of the first model of structure-based translation inhibition, a model framework was developed incorporating two (or more) regions whose free energy of folding correlates with protein production. These free energy barriers can occur as the complex is scanning along the 5′-UTR or as the complex is binding to the 5′-cap structure. If Ni is the number of complexes in state i and Ni + 1 is the number of complexes in the next state, then we have:
where ΔG is the magnitude of the free energy barrier and β represents the Boltzmann constant of the system (i.e. how energetic each complex is and thus how likely it is to traverse energetic barriers). Such results from statistical mechanics are valid due to the large number of yeast cells measured. If there are N complexes in the first (unbound) state, we have:
where βi are the Boltzmann constants at each state, ΔGi are the free energies of each barrier between them. We can rewrite the product to yield
 |
Assuming there are i states and the rate of translation initiation (hence protein production) is proportional to the number of initiation complexes in the last state (the state closest to the start codon), we have
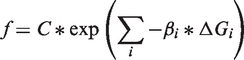 |
where f is the fluorescence value and C is a proportionality constant (since the data have been normalized to the fluorescence of a particular construct). If we take the logarithm of both sides, we can correlate the logarithm of the fluorescence to barrier free energies by fitting the Boltzmann constants and the proportionality constant, C:
where the hat denotes the estimator of a variable. This framework was used to develop models for the second and third rounds of modeling.
Models and novel MCSs were evaluated using the ensemble free energies of two disjoint segments of RNA as predictors. The boundaries for each segment were measured relative to the start codon. Although possibly between the boundaries of each segment, nucleotides which were not between the start of the 5′-UTR and 30 bp after the start codon were not included in folding calculations.
In addition to the pBLUESCRIPT SK MCS data, the yECitrine expression resulting from a number of other post-promoter ‘inserts’ (see ‘yECitrine insert series’) were also used to train the predictive model for each promoter. A hill-climbing algorithm was implemented to search for the two segments whose free energies best correlated with the data for all the available constructs according to the framework above (Figure 1A). The correlation coefficient was used to score each potential model.
Hill-climbing algorithms were similarly used to search for the best possible MCS in a two-step process similar to the first round of optimization (Figure 1B and C). For each potential MCS, a score was calculated using the model developed above. A positive value was given to those positions which, when yECitrine was inserted at that site, resulted in a higher predicted fluorescence than had been predicted at the same position (e.g. the third site from the end of the promoter) in other MCSs. A negative score was similarly given to underperforming positions. The total score for each potential MCS was the sum of these positive and negative values, and the MCSs with the greatest scores were selected.
Third round of modeling
Due to increased computational resources, the third round of modeling used an exhaustive search of pairs of disjoint predictive regions in all available data instead of a hill-climbing algorithm (Figure 1D). The predicted residual sum of squares (PRESS) was used to score each pair, as computed by the hat matrix.
RESULTS
Performance-based assessment of the pBLUESCRIPT SK multiple cloning site in yeast
To gain a quantitative performance assessment of a commonly used multiple cloning site in yeast, we inserted an optimized YFP fluorescent protein, yECitrine (36), after each restriction site in the p416 vector (29). This base vector is derived from the commonly used pRS yeast shuttle vector (28) and contains the popular pBLUESCRIPT SK MCS. Three common distinct yeast promoters were chosen to drive expression of these cassettes. Protein output [as measured by fluorescence of yECitrine (YFP)] changes significantly and exhibits drastic decreases as a function of position along the MCS (Figure 2). These results demonstrate that the choice of restriction site is not benign and can significantly influence performance. Moreover, this phenomenon is not strictly controlled by spacing/length as the relative fluorescence at each site depends strongly on the promoter being used to drive transcription. Additionally, it is clear that there exist promoter-specific effects beyond what would be expected from strength differences. Indeed, if the fluorescence trend was simply scaled by promoter strength, the graphs shown in Figure 2 would be identical. It is also worthy of note that the fluorescence trends are not monotonically decreasing, implying that any predictor function of MCS performance must not vary monotonically with the length of mRNA between the end of the promoter and the start codon. Finally, transcript analysis of yECitrine was not found to significantly correlate with fluorescence, thus implying the observed restriction site-dependent performance was predominately a translation-level effect (Information I in Supplementary Data). Based on this characterization, it is therefore imperative that any studies relying on the precise quantity of protein (e.g. promoter strength assays or comparative enzyme assays) consider and report the intervening nucleotides between the promoter and the gene of interest, as they can confound measurements of gene expression or activity.
Figure 2.

Performance assessment of the pBLUESCRIPT SK multicloning site. Three promoters (TEF, CYC1and GPD) were used to drive yECitrine inserted at each available restriction site of the pBLUESCRIPT SK MCS in the p416 vector. Each series has been scaled to unity at the first restriction site. Unscaled fluorescence values for pGPD01YFP, pTEF01YFP and pCYC101YFP are 1050, 611 and 30.2, respectively (Supplementary Table S4). Error bars represent the standard deviation in fluorescence observed across biological triplicates. Fluorescence is seen to vary in a promoter-specific manner across each of the sites in the MCS.
Determination of possible correlates of 5′-UTR-dependent translational inhibition
Given evidence that the restriction site-dependent inhibition is a translation-level effect, several physical characteristics of mRNA were considered as possible correlates of yECitrine fluorescence. Initially, both 5′-UTR GC content and length were evaluated using an expanded data set consisting of the TEFpmut5 promoter (2,37) and various intervening sequences (Supplementary Table S1). This data set represented the first instance in which we observed this translational inhibition, inspiring a more complete characterization of this effect in the wild-type, canonical TEF, GPD and CYC1 promoters in subsequent experiments. TEFpmut5 is almost identical to TEF, containing eight point mutations and retaining 95% of TEF's promoter activity, indicating that the two promoters are comparable. Relative fluorescence was plotted against length and GC content for these TEFpmut5 constructs (Figure 3A and B), and no clear relationship was observed in either variable. However, upon plotting the computed thermodynamic folding energy of the 5′-UTR (a more direct predictor of secondary structure) against yECitrine expression (Figure 3C), a clear monotonic downward trend was observed, consistent with earlier reports that significant 5′-UTR secondary structure can inhibit gene expression (11–13). Since RNA transcription begins in the 3′-end of the promoter, different promoters will yield different base pair compositions (and hence differing secondary structure) in the 5′-UTR. This result partially explains the promoter-specific impact of MCS found in Figure 2. Therefore, it was hypothesized that restriction site-dependent inhibition in the multicloning site was best explained by the thermodynamic free energy of folding of the 5′-UTR.
Figure 3.

Prospective correlates of expression in the TEFpmut5 insert series. yECitrine expression levels were measured in each of the TEFpmut5 constructs listed in Supplementary Table S1 and plotted against (A) 5′-UTR length, (B) GC content and (C) folding energy. Each plot has been scaled relative to the fluorescence of pT5Y. Error bars represent the standard deviation in fluorescence observed across biological triplicates. Fluorescence is seen to monotonically vary with free energy level, thus suggesting 5′-UTR secondary structure as the leading cause of this phenomenon.
Comparing the impact of 5′-UTR structure to codon usage and gene length
Beyond 5′-UTR structure, gene-specific traits such as length and codon usage can impact translation. To this end, genes for β-galactosidase and an E. coli optimized green fluorescent protein (GFP) (31) were inserted into the MCS of p416-TEF and performance was compared with yECitrine. The codon adaptation index (CAI) (38), a common measure of codon optimality, for both β-galactosidase and GFP in yeast are quite low. In addition, β-galactosidase is relatively long (>3 kb), whereas the lengths of GFP and yECitrine are almost identical (∼700 bp) (Table 1). In the case of yECitrine, a short, codon-optimal gene, 5′-UTR structure dominated as reporter output varied greatly as a function of cloning position (Figure 4). In contrast, as the gene of interest becomes longer and uses progressively rarer codons (as with β-galactosidase and GFP), the effects of gene length or codon biases become the rate-limiting steps in translation, dwarfing the effects of secondary structure. As a result, the restriction site-dependent effects of mRNA secondary structure are substantially muted by poor codon usage and/or large size (Figure 4). Therefore, the effect documented here of 5′-UTR structure inhibition is extremely relevant to synthetic biology in which codon-optimized genes are routinely being synthesized and used.
Table 1.
Genetic parameters for yECitrine, eGFP and LacZ
| Gene | Length (bp) | Codon adaptation index |
|---|---|---|
| yECitrine | 717 | 0.519 |
| eGFP | 756 | 0.0888 |
| LacZ | 3075 | 0.0570 |
Codon adaptation indices were computed with JCat (40) in S. cerevisiae and gene lengths are reported.
Figure 4.

Effect of gene length and codon usage on translational inhibition. LacZ and eGFP expression levels were measured in each of the constructs listed in Supplementary Tables S5 and S6, respectively, and compared with data for yECitrine. Each series has been normalized to unity at the first restriction site. Position on the MCS has been measured according to the unique restriction sites in the p416 vector. Error bars represent the standard deviation in reporter output observed across three biological replicates. The impact of 5′-UTR inhibition is most pronounced in short, codon optimized genes.
Re-engineering multicloning sites
Given the substantial effect MCSs can have on protein production, we sought to redesign these elements by mitigating secondary structure inhibition. An initial, crude model based on complete minimization of secondary structure across the entire 5′-UTR enabled the design of improved MCSs: TEF1 and CYC11 (Information II in Supplementary Data). However, this model is fundamentally limited as it suggested that protein output always decreased as a function of length across the 5′-UTR. Counterexamples to this feature were found in our data set. Due to this shortcoming, GPD1 was not constructed and a more accurate model framework was developed to redesign multicloning sites.
To address the observation that adding specific sets of nucleotides between the promoter and the start codon can yield increases in translational efficiency, a new model framework was developed incorporating two (or more) regions whose free energy of folding correlates with protein production (Figure 5). Such a model is grounded in the fundamental biology of the process. Successful initiation requires the presence of eIF4a, an ATP-dependent helicase, which unwinds mRNA in preparation for ribosome loading. In addition, scanning through a structured 5′-UTR requires ATP, though the enzyme responsible is unknown (15). Thus, the initiation complex can be modeled as a particle passing through several states (Figure 5), each separated by a free energy of folding, before reaching the start codon (see ‘Materials and Methods’ section). The models which best explained the available data (CYCModel1, TEFModel1 and GPDModel1) are shown in Table 2. It is important to note that in no model was the presence of mRNA structure beneficial for reporter expression. To validate these models, a second set of promoter-specific MCSs were generated: TEF2, CYC12 and GPD2, detailed in Supplementary Table S2. It is important to note that this design process was nontrivial due to the large number of sequence constraints which must be satisfied in addition to the requirement that the designed MCSs refrain from folding in a variety of genetic contexts, in contrast to attempts at structure minimization in other systems, for which the number of sequence constraints is relatively low and applicability is restricted to a specific gene construct (7). Furthermore, the promoters for which these MCSs are designed differ in transcriptional output by up to two orders of magnitude from one another, providing an excellent test of our framework's applicability in multiple transcriptional contexts. yECitrine was cloned at each restriction site for the three MCSs, and the fluorescence measurements are shown in Figure 6.
Figure 5.

Model of translation inhibition by secondary structure in the 5′-UTR. The pre-initiation complex (green) scans in the 3′-direction and is impeded by one or more regions of mRNA structure, decreasing the rate of translation initiation. To capture this effect, a model was created that allowed for two or more regions of secondary structure that can influence translational efficiency.
Table 2.
Computational models of yECitrine fluorescence based on 5′-UTR structure
| Name | Region 1 | Region 2 | Model | Correlation coefficient | Predicted residual sum of squares | Residual sum of squares |
|---|---|---|---|---|---|---|
| CYC1Model1 | [−166, −45] | [−37, 6] | ln( f ) = 0.0986 × ΔG1 + 0.1253 × ΔG2 + 0.5004 | 0.7809 | 0.3016 | 0.01701 |
| TEFModel1 | [−137, −7] | [−6, −1] | ln( f ) = 0.1042 × ΔG1 + 41.5185 × ΔG2 − 0.6856 | 0.5922 | 1.5128 | 1.5226 |
| GPDModel1 | [−115, −98] | [−53, 19] | ln( f ) = 2.3378 × ΔG1 + 0.1227 × ΔG2 − 1.4524 | 0.8340 | 1.2294 | 0.02174 |
| CYC1Model2 | [−105, −95] | [−53, −5] | ln( f ) = 1.1331 × ΔG1 + 0.0936 × ΔG2 − 0.1545 | 0.8600 | 0.1904 | |
| TEFModel2 | [−93, −87] | [−32, −8] | ln( f ) = 106.9974 × ΔG1 + 0.3197 × ΔG2 + 0.4363 | 0.9100 | 0.2278 | |
| GPDModel2 | [−126, −99] | [−76, −4] | ln( f ) = 0.6411 × ΔG1 + 0.1221 × ΔG2 + 1.2860 | 0.9536 | 0.2264 |
Indicated regions are measured relative to the first nucleotide of the start codon. The correlation coefficient was computed for all data available at the time of model training. The PRESS was computed with the hat matrix after regression. The residual sum of squares was computed for CYCModel1, TEFModel1 and GPDModel1 with the natural log of the data from pCYC12xYFP, pTEF2xYFP and pGPD2xYFP, respectively.
Figure 6.

Performance of designed multicloning sites. Performance of (A) pGPD2xYFP, (B) pTEF2xYFP and (C) pCYC12xYFP are depicted. Three MCSs were designed with the aid of the models listed in Table 2 and inserted after GPD, TEF or CYC1, respectively. Data in (A) have been scaled to the fluorescence of pGPD01YFP, in (B) to pTEF01YFP and in (C) to pCYC101YFP. The scaling for each series within each graph are identical. Position on the MCS has been measured according to the unique restriction sites in the p416 vector. Error bars represent the standard deviation in fluorescence observed across three biological replicates. These MCSs had improved performance compared with pBLUESCRIPT SK.
The redesigned MCS for the GPD promoter exhibited superior performance over the original, unoptimized MCS (Figure 6A). This new MCS, GPD2, shows negligible multicloning site inhibition for the first eight restriction sites, which coupled with high levels of yECitrine expression, makes this the ideal MCS for this strong promoter (Figure 6A). Furthermore, this trend was predicted by GPDModel1, lending support to the hypothesis that protein expression is influenced by secondary structure in a few key regions of the 5′-UTR (Supplementary Figure S3A). The excellent agreement between model and observation suggests that secondary structure may be the only significant translational rate-limiting step in protein expression for this extraordinarily strong promoter with a short, codon-optimized protein.
In further extension of this approach, the TEF-promoter-specific MCS TEF2 shows improved performance over pBLUESCRIPT SK or TEF1, exhibiting similar or increased expression levels across the sites in the MCS (Figure 6B). Furthermore, the observed expression trend was predicted remarkably well by TEFModel1, showing that mRNA structure is also a major limiting factor in this promoter (Supplementary Figure S3B), albeit not as limiting as in the GPD promoter case.
Applying this approach for a yet weaker promoter (CYC1), a new MCS, CYC12, was designed that provides better, more consistent performance across the first four restriction sites than CYC11 or pBLUESCRIPT SK (Figure 6C). However, CYC11 (Supplementary Figure S2B) provides better performance than CYC12 or pBLUESCRIPT SK when cloning after the fourth restriction site. The measured performance of CYC12 was well predicted by CYC1Model1, validating its predictive ability (Supplementary Figure S3C).
Taken together, these results indicate that the expression-inhibiting effects of multicloning sites can be substantially mitigated in a variety of transcriptional contexts through minimization of 5′-UTR secondary structure. In addition, no designed MCS elicited a significant change in gene expression noise, indicating that these constructs are ideal for development of precisely controlled gene networks (Supplementary Figure S4). However, it should be noted that neither TEF2 nor CYC12 matched the outstanding performance of GPD2, either due to random errors in the modeling process or due to the manifestation of other rate-limiting steps in expression not accounted for in our simplistic structure-based model of expression. As TEF and CYC1 are both substantially weaker promoters than GPD, the presence of additional rate-limiting factors (possibly stemming at the transcriptional level) is not surprising. Finally, all data collected above was used to upgrade the weighting factors and relevant 5′-UTR regions in our models (Table 2). These upgraded models are expected to give researchers more accurate predictions of 5′-UTR structure-based inhibition of protein expression in yeast.
DISCUSSION
We have demonstrated that simplistic models of 5′-UTR RNA secondary structure can be used to predict and rationally design multicloning site performance. The approach defined here is novel and significant for several reasons: (i) most modeling and prediction efforts in this area have examined prokaryotic systems (especially for ribosome binding sites), whereas this work utilizes yeast, a eukaryotic system. The mechanics of eukaryotic translation are sufficiently different and require a novel mechanistic approach. (ii) Most prior studies evaluate the impact of 5′ hairpin loops and their inhibitory effect on translation, especially when sequestering the start AUG. In contrast, our work demonstrates that the observed translation inhibition by structure was highly dependent on the position of the secondary structure, and not always a set distance from the transcription initiation site. (iii) Most prior studies evaluate the impact of specific point mutations that can change secondary structure. No prior work has successfully predicted and achieved a global redesign of a genetic circuit of such widespread importance as a multicloning site.
In contrast to prior studies, this method of prediction and optimization of 5′-UTR structure is valid in a general context, enabling significant increases in expression despite the implementation of a diverse set of promoters and restriction sites. This aspect of translation-level control seems to be most strongly pronounced when expressing short, codon-optimized gene products. Moreover, this effect exhibits a promoter-specific nature implying that individual components of gene expression cassettes cannot be designed in isolation. It is also important to note that this phenomenon is not a generic effect of 5′-UTR length, as indicated by (i) the significant increases in expression observed upon adding length to the 5′-UTR and (ii) the inability of one-part folding models to predict the behavior of TEF1 and CYC11. Although this effect was first experimentally characterized here for pBLUESCRIPT SK, it is expected that other MCSs will behave similarly in yeast and perhaps other eukaryotes. In particular, 5′-UTR based folding models predict that significant secondary structure issues can arise in other common MCSs such as the one present in pUC. As a result, it is important to understand and appreciate this impact especially when attempting to compare experiments or genes cloned into distinct sites.
Optimization of 5′-UTR secondary structure, therefore, represents a facile and cost-effective way to increase protein expression and product titers in eukaryotic bioprocesses, especially when it is undesirable to change promoters. Designed MCSs were found to be superior to the multicloning site found in the commonly used pBLUESCRIPT SK plasmids, and in the case of GPD2 showed negligible activity reduction along the MCS. This experiment shows not only that MCSs have a significant effect on translation, but also that MCSs can be rationally engineered to mitigate this effect. Such a model-based optimization approach is unprecedented for this ubiquitous genetic component and highlights the importance of rational design in synthetic biology. It is expected that a similar approach can be undertaken for other eukaryotic expression vectors. Control of 5′-UTR secondary structure also represents an alternative to promoter engineering, allowing protein expression to be controllably weakened by up to an order of magnitude without altering the dynamics of its regulation.
As demonstrated, optimization of 5′-UTR secondary structure is context specific, making the performance of each multicloning site highly dependent on the upstream promoter. It is not unreasonable to expect that the nucleotides of the open reading frame could also participate in translation-inhibiting secondary structure. Therefore, in cases where inhibition due to secondary structure is significant (i.e. in highly codon optimized genes), the assumption of interchangeability of promoter, MCS and gene becomes highly questionable. These results go against several of the tenets of synthetic biology, especially with respect to the assumption of completely interchangeable, non-interacting parts and are part of a growing body of work indicating the non-modularity of genetic components (39). Yet, as the cost of gene synthesis decreases, these results demonstrate that it is more desirable to create entire self-sustained transcriptional/translational units—from promoter to terminator. This paradigm is in contrast to the widespread assumption that two arbitrary sequences, when attached, will not generate translation-inhibiting structure.
These results have significant implications beyond redesign of gene expression cassettes. Expression vectors with multiple cloning sites have seen widespread use across the field of functional genetics and basic cloning. Given the strong difference in performance across sites in the MCS, experiments and conclusions will be highly dependent on these sites. Therefore, conclusions about gene impact, function or activity as well as promoter strength analysis will depend highly on the cloning sites used. As a result, many conflicting results and conclusions may be attributed to this phenomenon.
In conclusion, we have demonstrated the first performance-based analysis of multiple cloning sites in yeast systems. Following this, we have shown that a simplistic model of 5′-UTR secondary structure with two regions can predict this phenomenon when it is the most dominant determinant of protein translation. Under these conditions, we have for the first time successfully redesigned multiple cloning sites for function rather than simple convenience. It is anticipated that this work can be extended to other vectors and potentially to other organisms, both eukaryotic and prokaryotic. The capacity to design MCSs with consistent performance across cloning sites will greatly impact the ease and utility of recombinant cloning and genetic analysis.
SUPPLEMENTARY DATA
Supplementary Data are available at NAR Online.
FUNDING
National Institutes of Health (grant number R01GM090221); the National Science Foundation (Graduate Research Fellowship to N.C.); University of Texas at Austin Institute for Cellular and Molecular Biology (Summer Undergraduate Research Fellowship to E.F.). The content is solely the responsibility of the authors and does not necessarily reflect the official views of the National Institute of General Medical Sciences or the National Institutes of Health. Funding for open access charge: National Institutes of Health (grant R01GM090221).
Conflict of interest statement. None declared.
Supplementary Material
ACKNOWLEDGEMENTS
We are grateful to Dr Roger Bonnecaze for computational resources and Dr Vishy Iyer for helpful discussions.
REFERENCES
- 1.Keasling JD. Gene-expression tools for the metabolic engineering of bacteria. Trends Biotechnol. 1999;17:452–460. doi: 10.1016/s0167-7799(99)01376-1. [DOI] [PubMed] [Google Scholar]
- 2.Alper H, Fischer C, Nevoigt E, Stephanopoulos G. Tuning genetic control through promoter engineering. Proc. Natl Acad. Sci. USA. 2005;102:12678–12683. doi: 10.1073/pnas.0504604102. [DOI] [PMC free article] [PubMed] [Google Scholar]
- 3.Alper H, Moxley J, Nevoigt E, Fink GR, Stephanopoulos G. Engineering yeast transcription machinery for improved ethanol tolerance and production. Science. 2006;314:1565–1568. doi: 10.1126/science.1131969. [DOI] [PubMed] [Google Scholar]
- 4.Christianson TW, Sikorski RS, Dante M, Shero JH, Hieter P. Multifunctional Yeast High-Copy-Number Shuttle Vectors. Gene. 1992;110:119–122. doi: 10.1016/0378-1119(92)90454-w. [DOI] [PubMed] [Google Scholar]
- 5.Gustafsson C, Govindarajan S, Minshull J. Codon bias and heterologous protein expression. Trends Biotechnol. 2004;22:346–353. doi: 10.1016/j.tibtech.2004.04.006. [DOI] [PubMed] [Google Scholar]
- 6.Blake WJ, Kaern M, Cantor CR, Collins JJ. Noise in eukaryotic gene expression. Nature. 2003;422:633–637. doi: 10.1038/nature01546. [DOI] [PubMed] [Google Scholar]
- 7.Salis HM, Mirsky EA, Voigt CA. Automated design of synthetic ribosome binding sites to control protein expression. Nat. Biotechnol. 2009;27:946–U112. doi: 10.1038/nbt.1568. [DOI] [PMC free article] [PubMed] [Google Scholar]
- 8.Kudla G, Murray AW, Tollervey D, Plotkin JB. Coding-Sequence Determinants of Gene Expression in Escherichia coli. Science. 2009;324:255–258. doi: 10.1126/science.1170160. [DOI] [PMC free article] [PubMed] [Google Scholar]
- 9.Paik SY, Ra KS, Cho HS, Koo KB, Baik HS, Lee MC, Yun JW, Choi JW. The influence of the nucleotide sequences of random Shine-Dalgarno and spacer region on bovine growth hormone gene expression. J. Microbiol. 2006;44:64–71. [PubMed] [Google Scholar]
- 10.Pickering BM, Willis AE. The implications of structured 5′ untranslated regions on translation and disease. Semin. Cell Dev. Biol. 2005;16:39–47. doi: 10.1016/j.semcdb.2004.11.006. [DOI] [PubMed] [Google Scholar]
- 11.McCarthy JEG. Posttranscriptional control of gene expression in yeast. Microbiol. Mol. Biol. Rev. 1998;62:1492–1553. doi: 10.1128/mmbr.62.4.1492-1553.1998. [DOI] [PMC free article] [PubMed] [Google Scholar]
- 12.Kozak M. Regulation of translation via mRNA structure in prokaryotes and eukaryotes. Gene. 2005;361:13–37. doi: 10.1016/j.gene.2005.06.037. [DOI] [PubMed] [Google Scholar]
- 13.Baim SB, Sherman F. Messenger-RNA Structures Influencing Translation in the Yeast Saccharomyces cerevisiae. Mol. Cell. Biol. 1988;8:1591–1601. doi: 10.1128/mcb.8.4.1591. [DOI] [PMC free article] [PubMed] [Google Scholar]
- 14.Ringner M, Krogh M. Folding free energies of 5′-UTRs impact post-transcriptional regulation on a genomic scale in yeast. PLoS Comput. Biol. 2005;1:585–592. doi: 10.1371/journal.pcbi.0010072. [DOI] [PMC free article] [PubMed] [Google Scholar]
- 15.Kapp LD, Lorsch JR. The molecular mechanics of eukaryotic translation. Annu. Rev. Biochem. 2004;73:657–704. doi: 10.1146/annurev.biochem.73.030403.080419. [DOI] [PubMed] [Google Scholar]
- 16.Partow S, Siewers V, Bjorn S, Nielsen J, Maury J. Characterization of different promoters for designing a new expression vector in Saccharomyces cerevisiae. Yeast. 2010;27:955–964. doi: 10.1002/yea.1806. [DOI] [PubMed] [Google Scholar]
- 17.Muller S, Sandal T, Kamp-Hansen P, Dalboge H. Comparison of expression systems in the yeasts Saccharomyces cerevisiae, Hansenula polymorpha, Klyveromyces lactis, Schizosaccharomyces pombe and Yarrowia lipolytica. Cloning of two novel promoters from Yarrowia lipolytica. Yeast. 1998;14:1267–1283. doi: 10.1002/(SICI)1097-0061(1998100)14:14<1267::AID-YEA327>3.0.CO;2-2. [DOI] [PubMed] [Google Scholar]
- 18.Kozak M. Circumstances and mechanisms of inhibition of translation by secondary structure in eukaryotic messenger-RNAs. Mol. Cell. Biol. 1989;9:5134–5142. doi: 10.1128/mcb.9.11.5134. [DOI] [PMC free article] [PubMed] [Google Scholar]
- 19.Wang LJ, Wessler SR. Role of mRNA secondary structure in translational repression of the maize transcriptional activates L-C. Plant Physiol. 2001;125:1380–1387. doi: 10.1104/pp.125.3.1380. [DOI] [PMC free article] [PubMed] [Google Scholar]
- 20.Short JD, Pfarr CM. Translational regulation of the JunD messenger RNA. J. Biol. Chem. 2002;277:32697–32705. doi: 10.1074/jbc.M204553200. [DOI] [PubMed] [Google Scholar]
- 21.van der Velden AW, van Nierop K, Voorma HO, Thomas AAM. Ribosomal scanning on the highly structured insulin-like growth factor II-leader 1. Int. J. Biochem. Cell Biol. 2002;34:286–297. doi: 10.1016/s1357-2725(01)00116-9. [DOI] [PubMed] [Google Scholar]
- 22.Hoover DS, Wingett DG, Zhang J, Reeves R, Magnuson NS. Pim-1 protein expression is regulated by its 5′-untranslated region and translation initiation factor eIF-4E. Cell Growth Differ. 1997;8:1371–1380. [PubMed] [Google Scholar]
- 23.Zuker M. Mfold web server for nucleic acid folding and hybridization prediction. Nucleic Acids Res. 2003;31:3406–3415. doi: 10.1093/nar/gkg595. [DOI] [PMC free article] [PubMed] [Google Scholar]
- 24.Dirks RM, Bois JS, Schaeffer JM, Winfree E, Pierce NA. Thermodynamic analysis of interacting nucleic acid strands. SIAM Rev. 2007;49:65–88. [Google Scholar]
- 25.Hofacker IL. Vienna RNA secondary structure server. Nucleic Acids Res. 2003;31:3429–3431. doi: 10.1093/nar/gkg599. [DOI] [PMC free article] [PubMed] [Google Scholar]
- 26.Serra MJ, Turner DH. Energetics of Biological Macromolecules. Vol. 259. San Diego: Academic Press Inc; 1995. pp. 242–261. [Google Scholar]
- 27.Mathews DH, Disney MD, Childs JL, Schroeder SJ, Zuker M, Turner DH. Incorporating chemical modification constraints into a dynamic programming algorithm for prediction of RNA secondary structure. Proc. Natl Acad. Sci. USA. 2004;101:7287–7292. doi: 10.1073/pnas.0401799101. [DOI] [PMC free article] [PubMed] [Google Scholar]
- 28.Sikorski RS, Hieter P. A system of shuttle vectors and yeast host strains designed for efficient manipulation of DNA in Saccharomyces cerevisiae. Genetics. 1989;122:19–27. doi: 10.1093/genetics/122.1.19. [DOI] [PMC free article] [PubMed] [Google Scholar]
- 29.Mumberg D, Muller R, Funk M. Yeast vectors for the controlled expression of heterologous proteins in different genetic backgrounds. Gene. 1995;156:119–122. doi: 10.1016/0378-1119(95)00037-7. [DOI] [PubMed] [Google Scholar]
- 30.Sambrook J, Russell DW. Molecular cloning: a laboratory manual. Cold Spring Harbor, NY: Cold Spring Harbor Laboratory; 2001. [Google Scholar]
- 31.Andersen JB, Sternberg C, Poulsen LK, Bjorn SP, Givskov M, Molin S. New unstable variants of green fluorescent protein for studies of transient gene expression in bacteria. Appl. Environ. Microbiol. 1998;64:2240–2246. doi: 10.1128/aem.64.6.2240-2246.1998. [DOI] [PMC free article] [PubMed] [Google Scholar]
- 32.Li W-Z, Sherman F. Two types of TATA elements for the CYC1 gene of the yeast Saccharomyces cerevisiae. Mol. Cell. Biol. 1991;11:666–676. doi: 10.1128/mcb.11.2.666. [DOI] [PMC free article] [PubMed] [Google Scholar]
- 33.Hahn S, Hoar ET, Guarente L. Each of 3 TATA elements specifies a subset of the transcription initiation sites at the CYC-1 Promoter of Saccharomyces cerevisiae. Proc. Nat. Acad. Sci. USA. 1985;82:8562–8566. doi: 10.1073/pnas.82.24.8562. [DOI] [PMC free article] [PubMed] [Google Scholar]
- 34.Nagashima K, Kasai M, Nagata S, Kaziro Y. Structure of the 2 genes coding for polypeptide chain elongation factor 1-alpha (EF-1-alpha) from Saccharomyces cerevisiae. Gene. 1986;45:265–273. doi: 10.1016/0378-1119(86)90024-7. [DOI] [PubMed] [Google Scholar]
- 35.Zhang ZH, Dietrich FS. Mapping of transcription start sites in Saccharomyces cerevisiae using 5′ SAGE. Nucleic Acids Res. 2005;33:2838–2851. doi: 10.1093/nar/gki583. [DOI] [PMC free article] [PubMed] [Google Scholar]
- 36.Sheff MA, Thorn KS. Optimized cassettes for fluorescent protein tagging in Saccharomyces cerevisiae. Yeast. 2004;21:661–670. doi: 10.1002/yea.1130. [DOI] [PubMed] [Google Scholar]
- 37.Nevoigt E, Kohnke J, Fischer CR, Alper H, Stahl U, Stephanopoulos G. Engineering of promoter replacement cassettes for fine-tuning of gene expression in Saccharomyces cerevisiae. Appl. Environ. Microbiol. 2006;72:5266–5273. doi: 10.1128/AEM.00530-06. [DOI] [PMC free article] [PubMed] [Google Scholar]
- 38.Sharp PM, Li WH. The codon adaptation index—a measure of directinal synonymous codon usage bias, and its potential applications. Nucleic Acids Res. 1987;15:1281–1295. doi: 10.1093/nar/15.3.1281. [DOI] [PMC free article] [PubMed] [Google Scholar]
- 39.Ellis T, Wang X, Collins JJ. Diversity-based, model-guided construction of synthetic gene networks with predicted functions. Nat. Biotechnol. 2009;27:465–471. doi: 10.1038/nbt.1536. [DOI] [PMC free article] [PubMed] [Google Scholar]
- 40.Grote A, Hiller K, Scheer M, Munch R, Nortemann B, Hempel DC, Jahn D. JCat: a novel tool to adapt codon usage of a target gene to its potential expression host. Nucleic Acids Res. 2005;33:W526–W531. doi: 10.1093/nar/gki376. [DOI] [PMC free article] [PubMed] [Google Scholar]
Associated Data
This section collects any data citations, data availability statements, or supplementary materials included in this article.