Abstract
E. coli Alkaline Phosphatase (AP) can hydrolyze a variety of chemically diverse phosphate monoesters while making contacts solely to the transferred phosphoryl group and its incoming and outgoing atoms. Strong interactions between AP and the transferred phosphoryl group are not present in the ground state despite the apparent similarity of the phosphoryl group in the ground state and transition state. Such modest ground state affinity is required to curtail substrate saturation and product inhibition, and allow efficient catalysis. To investigate how AP achieves limited affinity for its ground state we first compared binding affinities of several related AP ligands. This comparison revealed a paradox: AP has a much stronger affinity for inorganic phosphate (Pi) than for related compounds that are similar to Pi geometrically and in overall charge but lack a transferable proton. We postulated that the Pi proton could play an important role via transfer to the nearby anion, the active site serine nucleophile (Ser102), resulting in the attenuation of electrostatic repulsion between bound Pi and the Ser102 oxyanion and the binding of Pi in its trianionic form adjacent to a now neutral Ser residue. To test this model, isotope-edited Fourier transform infrared (FTIR) spectroscopy was used to investigate the ionic structure of AP-bound Pi. The FTIR results indicate that the Pi trianion is bound and, in conjunction with previous studies of pH-dependent Pi binding and other results, suggest that Pi dianion transfers its proton to the Ser102 anion of AP. This internal proton transfer results in stronger Pi binding presumably because the additional negative charge on the trianionic Pi allows stronger electrostatic interactions within the AP active site and because the electrostatic repulsion between bound Pi and anionic Ser102 is eliminated when the transferred Pi proton neutralizes Ser102. Indeed, when Ser102 is neutralized the Pi trianion binds AP with a calculated Kd of ≤290 fM. These results suggest that electrostatic repulsion between Ser102 and negatively charged phosphate ester substrates contributes to catalysis by the preferential destabilization of the reaction’s E•S ground state.
Introduction
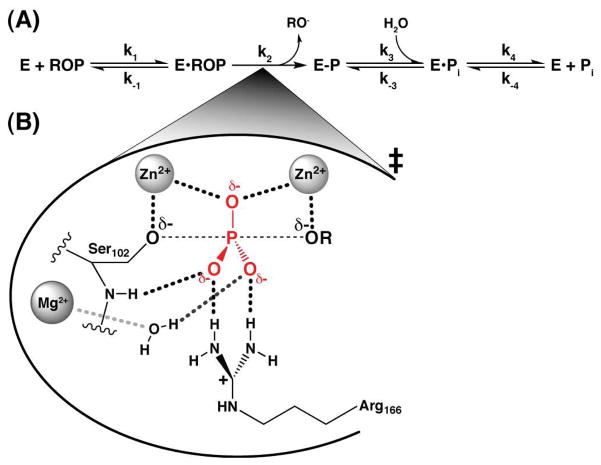
Phosphatases are the most proficient enzyme catalysts known. They accelerate the reaction of phosphate monoester hydrolysis, which has a half-life of nearly a trillion years,1 by up to 27 orders of magnitude.2 E. coli Alkaline Phosphatase (AP) has been studied extensively as a model enzyme in an effort to understand the origins of this remarkable rate enhancement.3,4 Thorough functional studies have elucidated a two-step reaction mechanism involving the formation of a covalent phosphoserine intermediate followed by hydrolysis and phosphate product release (Scheme 1A).4,5 Structural studies indicate that AP has a shallow binding pocket that interacts with the substrate phosphoryl group via two Zn2+ ions, an active site Arg residue, and several active site hydrogen bond donors (Scheme 1B). However, no residues are in position to make contacts to the peripheral leaving group substituent of the substrate.6 Consistent with this observation, AP demonstrates broad substrate specificity7–9 befitting its apparent biological role as an indiscriminate phosphatase that is used to scavenge phosphate.10
Scheme 1.
AP Phosphate Monoester Hydrolysis Reaction Scheme (A) with Proposed Transition State Model (B)
Because of its lack of peripheral binding interactions, AP apparently needs to lower the reaction barrier for phosphate ester hydrolysis via contacts solely to the substrate’s transferred phosphoryl group and the incoming and outgoing oxygen atoms in the transition state. Remarkably, these limited interactions impart a 1027-fold rate enhancement [kenzyme/kuncat = (1.2×10⁶ M−1s−1)/(3.6×10−22 M−1s−1) = 3.3×1027], which represents a lowering of the reaction barrier by 37 kcal/mol (ΔΔG‡ = RTln(kenzyme/kuncat); see also Figure S1). Given the strong apparent molecular recognition of the phosphoryl transition state, the question is raised of how AP can avoid very strong binding of the phosphate monoester substrate and the reaction product, inorganic phosphate (Pi), which would lead to saturation by low concentrations of substrate and inhibition by low concentrations of Pi.
Achieving strong preferential recognition for a reaction’s transition state relative to its ground state is a challenge faced by all enzymes. Formally, catalysis can be defined as preferential transition state over ground state recognition or binding.11–16 But this challenge is exceptional for AP because of the enormous rate enhancement it provides and because of its lack of reliance on remote binding interactions – interactions that are used by many enzymes to position reacting groups and thus ‘entropically’ destabilize ground states.15,17,18 Despite these challenges, AP exhibits less than 6.8 kcal/mol of binding energy for phosphate ester substrates19 (Kd ≥ 10 μM), while achieving 37 kcal/mol of apparent binding energy to the reaction’s transition state (Figure S1). How is this extraordinary level of energetic discrimination between the similar ground and transition states achieved?
Some of this discrimination presumably arises from positioning of the bound phosphate group with respect to the active site Ser102 nucleophile, which removes the independent translational and rotational entropy of the reacting groups while favoring the partial covalent bond that is formed in the transition state. However, this entropic destabilization alone is unlikely to account for all of the approximately 30 kcal/mol difference in apparent binding energies of the ground and transition states. In the course of studying AP we became aware of a paradoxical result pertinent to the ground state energetics of AP: stronger binding of the Pi ground state ligand than of related ligands. The results herein resolve this paradox and further suggest that AP limits substrate and product binding by previously unrecognized electrostatic interactions that may contribute substantially to ground state destabilization and thus to transition state versus ground state discrimination.
Results and Discussion
Comparison of Ligand Affinities for AP
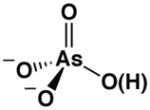
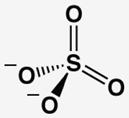
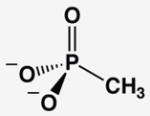
The AP affinities of a phosphate ester substrate and related ground state molecules have been reported previously.19,20 To facilitate comparisons we re-measured these affinities and the affinity for methyl phosphonate using a common competitive inhibition assay under identical buffer conditions and with the same AP preparation (Table 1). Molecules with the same overall charge and similar geometry bind to AP with very different affinities. In particular, Pi binds AP considerably more strongly than the several other related molecules, with discrimination of at least 106-fold relative to the sulfate dianion ( ) corresponding to at least 8.5 kcal/mol of differential binding energy. Given the similarity of these ligands, how does AP achieve such enormous discrimination?
Table 1.
Comparison of AP-Binding Ligands With Similar Geometries and Charge Distributions
| molecules without transferable protons | |||||
|---|---|---|---|---|---|
| phosphate | arsenate | sulfateb | methyl phosphonatec | methyl phosphated | |
|
|
|
|

|
|
|
| |||||
| Kd (mM) @ pH 8a | 5×10⁻⁴ | 5×10⁻⁴ | > 1×10³ | > 2 | > 0.01 |
| Kd relative | (1) | 1 | > 2×10⁶ | > 4×10³ | > 20 |
|
| |||||
| P(As, S)-O bond lengthe | 1.52(1) | 1.65(6) | 1.47(2) | 1.53(2) | 1.51(2) |
Values of Kd were determined by inhibition with [S] ≪ KM, such that Ki is expected to equal the dissociation constant for the inhibitor, Kd (25 °C, I = 0.1 M; see Methods for details).
The limit for inhibition by sulfate was obtained from the observation of no significant inhibition up to 1 M sulfate.
The inhibition constant for methyl phosphonate is reported as a lower limit because the observed inhibition was due to contaminating levels of Pi in the methyl phosphonate stock.
The Kd for methyl phosphate is a lower limit set by the observed KM of this substrate.
Bond lengths are reported as averages with standard deviations for the last decimal place in parenthesis from structures in the Cambridge Structural Database. No structures are reported for methyl phosphonate so bond distances were inferred from structures containing R(CH2)nPO3.
A potential explanation for the stronger binding of Pi is that AP has a highly precise arrangement of active site functional groups that is optimized for recognition of the Pi geometry and bond lengths. A priori, such precision for ground state binding would not be expected, and the similarity of phosphate and arsenate affinities, which have larger bond length differences than Pi and sulfate, provides experimental evidence against this model (Table 1).
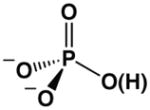
One feature that Pi and arsenate share with each other but not with the other ligands tested is that Pi and arsenate exist in a predominately protonated state at pH 8.0, where the binding measurements were made ( ).21 We considered three models for the role of this proton in strong binding by Pi and arsenate: loss of the proton to solution, participation of the proton in a hydrogen bond with a residue on the enzyme, and transfer of the proton to a residue on the enzyme.
Pi dianion ( ) could release its proton into solution resulting in the formation of the more negatively charged Pi trianion ( ) bound in the AP active site. Because of the higher negative charge of , stronger electrostatic interactions to the positively charged AP active site could result in stronger binding to AP. However, this model is ruled out by previous pH-dependent studies with AP that demonstrated, by systematic comparisons of the binding and reactivity of species with or without titratable protons, that there is no net loss of a proton upon binding of Pi to AP.19 (A detailed description of these prior results is presented in Supporting Information.)
The second model invokes a contribution of the proton on to the observed stronger binding affinity via participation in a hydrogen bond to a residue on AP. However, the energetic consequences of removing an individual hydrogen bond in protein sites is typically 0.5–1.8 kcal/mol (and at most 6 kcal/mol for exceptional cases with charged hydrogen bond acceptors/donors),22–25 notably smaller than the observed free energy difference between Pi and sulfate binding of ≥8.5 kcal/mol.
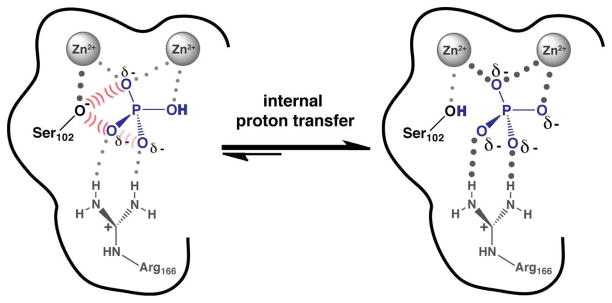
The final model for the role of the proton invokes its transfer to a residue on AP. This mechanism also requires a ‘special’ property of the proton relative to an alkyl phosphate substituent or lone oxygen – its ability to be transferred. As noted above, proton loss from to form the bound could allow stronger electrostatic interactions within the AP active site. As the pH-rate and binding studies noted above show that this proton is not lost to solution, it could instead be transferred to a group on the enzyme (Scheme 2). Indeed, Pi is bound adjacent to the active site nucleophile, Ser102, which is thought to be present in free AP as an anion at neutral pH due to its interactions with the active site Zn2+ ions.19 (Evidence from prior results suggesting that Ser102 is an alkoxide in the free enzyme are presented in Supporting Information.) The close proximity of this serine alkoxide residue to the bound, negatively charged, Pi, with reported crystallographic oxygen-oxygen distances of 1.6–3.2 Å,26,27 could yield significant electrostatic repulsion, and transfer of the proton from to this serine would eliminate this repulsion.
Scheme 2.
Internal Proton Transfer Model for AP Phosphate Binding
We initially favored the internal proton transfer model over the hydrogen bonding model, based on the considerations described above, but a direct test of the models was needed. The transfer model predicts that is bound to AP, while the hydrogen bond model predicts that is bound. The model of direct binding of at pH 8.0 is ruled out by the prior pH dependence studies, as noted above.19 To determine the ionic species of Pi bound to AP and thus distinguish these models, we turned to vibrational spectroscopy.
Isotope-Edited FTIR Spectra of Pi Bound to AP at pH 8.0
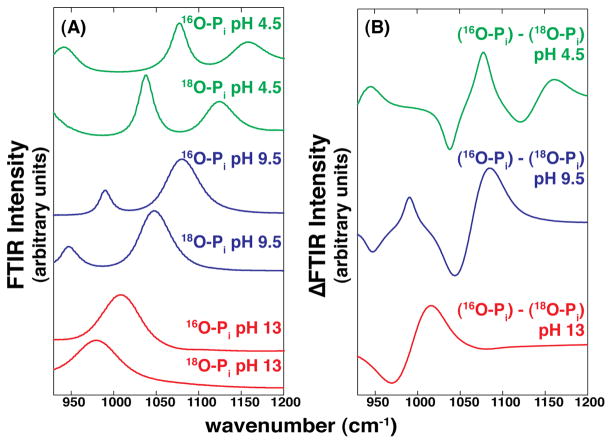
The bond vibrations associated with each ionic species of Pi are unique and thus IR spectroscopy gives distinct spectra for each state.28–30 As the IR spectra of a ligand bound to a protein is typically obscured by the many vibrations arising from the protein, an isotope-edited FTIR technique was used to allow the vibrational properties of the bound ligand to be isolated from the protein vibrations.31 In this approach two closely matched samples with, in our case, either 16O- or 18O-labeled are measured and subtracted from one another. This highly Pi controlled and precise comparison is required instead of a difference spectrum of liganded versus free protein because ligand binding can perturb the vibrational modes of the protein, rendering interpretation of the resulting difference spectra difficult or impossible.32–34 Since the different species of Pi have different vibrational spectra, they also give distinct difference spectra, as shown in Figure 1. Figure 1A shows the spectra obtained for the 16O and 18O phosphate species, and Figure 1B shows the difference spectra, which is the form necessary for comparison to spectra of Pi bound to AP.
Figure 1.
FTIR spectra for Pi samples in solution at various pH values. (A) FTIR spectra for 18O- or 16O-labeled Pi (50 mM in water, pH adjusted with HCl or NaOH) at pH 4.5 (top), 9.5 (middle), and 13 (bottom) corresponding to the Pi mono-, di-, and trianions. (B) Corresponding difference FTIR spectra for the Pi samples in (A). These difference spectra were used to compare to spectra for Pi bound to AP in Figures 2 and 4.
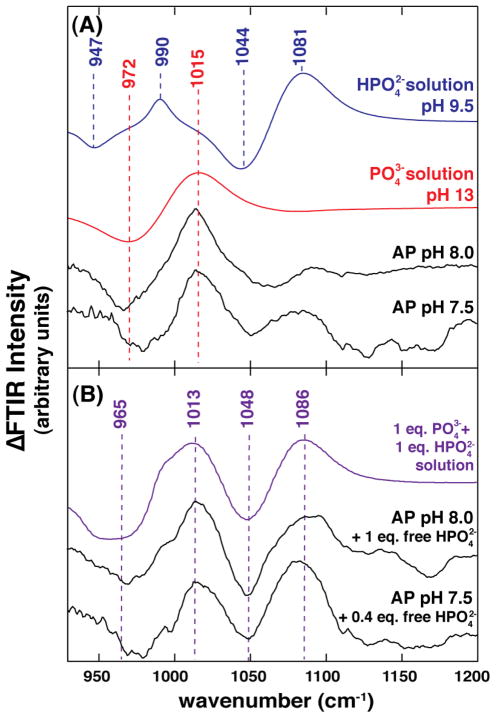
Figure 2 shows two difference spectra of Pi bound to AP at pH 7.5 and 8.0 along with the spectra for free and . The spectra of bound Pi contain one positive and negative peak pair separated by ~43 cm−1 as expected for the vibrational difference of a 16O-P versus 18O-P bond, and the position of these peaks corresponds closely to that observed for . Thus, these spectra suggest that AP binds Pi in its trianionic form. Nevertheless, due to large background signal from the protein in isotope-edited FTIR, the resulting difference spectra may not perfectly remove these contributions, as can be seen by the apparent noise in the spectral baselines without and with protein (c.f. Figures 2B and 1B). We therefore carried out additional control experiments.
Figure 2.
[18O]-Pi edited FTIR difference spectra of Pi in solution and AP-bound at pH 8.0 and 7.5. (A) FTIR difference spectrum between 16O-Pi and 18O-Pi at pH 9.5 (blue) or pH 13 (red) from Figure 1. FTIR difference spectrum between AP•16O-Pi and AP•18O-Pi (2.6 mM AP/2.3 mM Pi) in 140 mM NaMOPS, pH 8.0, 680 mM NaCl, 140 μM ZnCl2, and 1.4 mM MgCl2 (top, black). FTIR difference spectrum between AP•16O-Pi and AP•18O-Pi (2.4 mM AP, 2.3 mM Pi) in 10 mM Tris•HCl, pH 7.5, 100 mM NaCl, 100 μM ZnCl2, and 1 mM MgCl2 (bottom, black). (B) Predicted FTIR difference spectrum for a 1:1 combination of solution and (purple). FTIR difference spectrum between (AP•16O-Pi + excess 16O-Pi) and (AP•18O-Pi + excess 18O-Pi) (2.6 mM AP, 5 mM Pi) in the pH 8.0 buffer conditions above (top, black). FTIR difference spectrum between (AP•16O-Pi + excess 16O-Pi) and (AP•18O-Pi + excess 18O-Pi) (2.4 mM AP, 3.4 mM Pi) in the pH 7.5 buffer conditions above (bottom, black).
To initially test the ability of our difference spectra to isolate the spectral properties of the Pi species that are present, we obtained spectra of AP•Pi samples with added free Pi (Figure 2B). The additional features observed correspond to those for isolated , as expected at this pH, despite significant noise in the spectral baselines. This control and additional controls described in the following sections provide strong support for the assignment of the trianion as the AP-bound Pi species.
31 P-NMR Measurements of Pi Bound to AP
The above FTIR experiments suggest that the bound state of Pi in AP is the trianion. Since there is no increased AP affinity for Pi with increasing pH,1 which increases the concentration of trianionic Pi in solution, an internal proton transfer is implicated, as suggested above and denoted in eq 1 for transfer to the active site serine anion.
| (1) |
As this is an internal proton transfer, the bound trianion should be favored over the bound dianion regardless of the solution pH. In addition, the observed Pi affinity drops off at lower pH values as the phosphate monoanion ( ) becomes prevalent, and quantitative analysis indicates that a proton is lost upon binding of this species to AP (eq 2).19 A proton loss to solution from the upon binding gives so that the same binding species is expected at low pH and at pH values at which the dianion is predominant. Given the initial FTIR data suggesting an internal proton transfer that results in Pi trianion as the predominantly bound species, as shown in eq 1, we show only the bound trianion in eq 2. Thus, the FTIR results combined with prior pH-studies predict that the same Pi species is bound across the investigated pH range of 5.0–11.0.
| (2) |
We tested this prediction by 31P-NMR spectroscopy (this section) and isotope-edited FTIR (next section), but before presenting these results, one additional feature must be noted. At low pH, AP accumulates in a state with covalently bound Pi (E-P; Scheme 1). The pH-dependence of the equilibrium between the noncovalently and covalently AP-bound Pi has been extensively characterized by previous 31P-NMR measurements36–38 and 32Pi-labeling studies.9,35 This accumulation of the covalent species at low pH occurs because the predominant Pi form in solution at pH 5.0–6.0 is the monoanion, and forms the covalent E-P species in a pH-independent equilibrium (eq 3), whereas the stability of the noncovalent species (relative to the free species) decreases across this pH range (eq 2; note the release of H+ in this reaction). Thus, the proportion of bound Pi in the covalent form increases at lower pH and becomes significant below pH 6 (eq 4). Overall, this analysis of the prior Pi affinity measurements across pH predicts a pH-independent chemical shift for noncovalently bound Pi and a separate signal for the covalently bound E-P species that arises only at low pH.
| (3) |
| (4) |
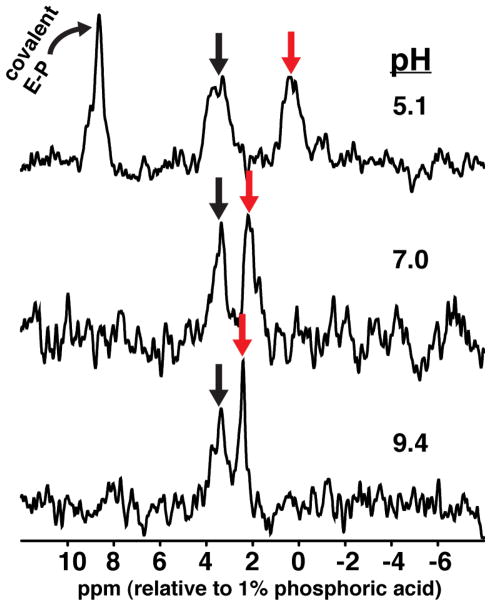
Previous 31P-NMR spectra from Coleman and coworkers36–38 are consistent with the above predictions. We repeated and expanded these measurements by determining the 31P-NMR spectra of Pi associated with AP in the presence of an excess of free Pi to serve as a control for the expected changes in chemical shift versus pH (Figure 3). One peak shifted with pH as predicted for free Pi, one peak gave a constant chemical shift of 3.6 ± 0.2 ppm, and an additional peak was observed in the low pH spectrum, as expected for the covalent species.
Figure 3.
31P-NMR of AP-bound Pi at various pH. The red arrow indicates the chemical shift of solution Pi, which is pH-dependent. The black arrow indicates the pH-independent chemical shift of Pi noncovalently bound to AP. The downfield signal in the pH 5.1 sample reflects the covalently bound E-P species. The pH 5.1 sample contained 100 mM NaAcetate, 100 mM NaCl, 100 μM ZnCl2, 1 mM MgCl2, 2.3 mM AP, and 3.9 mM Pi. The pH 7.0 sample contained 100 mM Tris•HCl, 100 mM NaCl, 100 μM ZnCl2, 1 mM MgCl2, 1.1 mM AP, and 1.4 mM Pi. The pH 9.4 sample contained 100 mM NaCHES, 100 mM NaCl, 100 μM ZnCl2, 1 mM MgCl2, 1.8 mM AP, and 1.3 mM Pi. Stoichiometric binding of Pi is not observed at pH 9.4 as would be expected based on the relative concentrations of AP and Pi in the sample and the observed Kd value for Pi at this pH. Less than stoichometric binding of Pi at millimolar AP concentrations has been observed previously (see Ref. 44–45 for example). An explanation consistent with the observed Pi binding at both low and high concentrations of AP is that there is only partial metal ion occupancy when AP concentrations approach or exceed the available metal ion concentrations in solution, resulting in a partial loss of Pi binding, and that this problem is exacerbated at high pH.
The absolute value of the 31P chemical shift of AP-bound Pi cannot be used to assign its ionic form - the observed chemical shift does not correspond to that of any of the ionic forms in solution, presumably due to perturbations from the idiosyncratic environment within the AP active site. Nevertheless, the observed chemical shift behavior for phosphate bound to AP as a function of pH is consistent with the prediction above from eqs 1 and 2 in which the trianion is the predominate noncovalently bound species across the pH range. We built on these NMR results to further test the ability of isotope-edited FTIR to accurately report on the states of Pi present in enzyme-containing solutions.
Isotope-Edited FTIR Spectra of Pi Bound to AP at pH 5.0
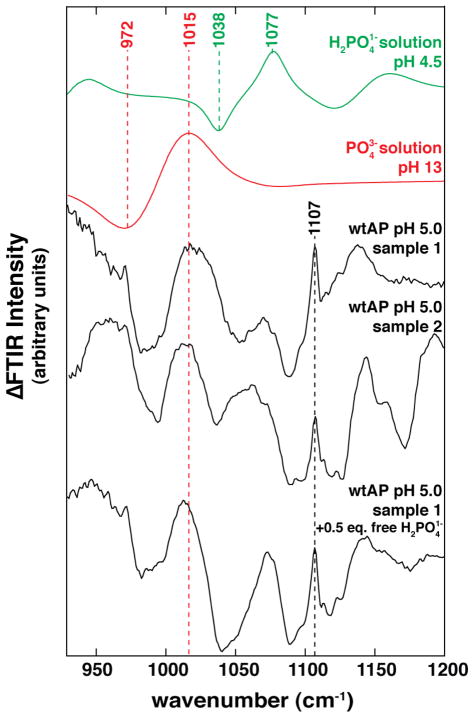
Figure 4 shows FTIR difference spectra for AP with and without an excess of Pi at pH 5.0. The peak at 1015 cm−1 that was present in the pH 8.0 sample spectra (Figure 2) is also present in the pH 5.0 spectra (Figure 4) as predicted above for a constant noncovalently bound state of Pi across the measured pH range (eq 1). New features arise, including a prominent peak at and around 1107 cm−1 (and possibly a negative peak ~1089 cm−1), that presumably come from the covalent phosphoserine E-P species that is predicted biochemically and observed by 31P-NMR (Figure 3).37 (See Supporting Information for a detailed interpretation of this spectrum.) Upon addition of excess Pi, the features observed under conditions with AP in excess and Pi fully bound remain, and additional, negative and positive peaks appear at 1038 and 1077 cm−1, as expected for free (Figure 4, bottom spectrum).
Figure 4.
[18O]-Pi edited FTIR difference spectra of Pi in solution and AP-bound at pH 5.0. FTIR difference spectrum between 16O-Pi and 18O-Pi at pH 4.5 (green) or pH 13 (red) from Figure 1. FTIR difference spectrum between AP•16O-Pi and AP•18O-Pi (4.6 mM AP, 2.8 mM Pi) in 10 mM NaAcetate, pH 5.0, 100 mM NaCl, 100 μM ZnCl2, and 1 mM MgCl2 (Sample 1). Sample 2 contained 50 mM NaCitrate, pH 5.0, 100 mM NaCl, 100 μM ZnCl2, and 1 mM MgCl2 (2.5 mM AP, 2.7 mM Pi). The bottom sample is the same as Sample 1 with Pi added to 6.8 mM.
Interpretation of FTIR Results
The simplest interpretation of all of the FTIR results is that the noncovalently AP-bound Pi species is the trianion. Nevertheless, some studies have shown that the vibrational properties of phosphate esters and Pi free in solution can change upon binding to an enzyme active site.39–41 We therefore considered the possibility that the apparent strong resemblance of the observed AP with Pi spectra and the solution spectrum could instead arise coincidentally from a bound Pi dianion with a perturbed FTIR spectrum.
Enzyme-induced changes in IR spectra typically result in peak frequency shifts of 10–35 cm−1 from the solution frequencies.39–41 However, shifts of this magnitude, to either higher or lower wavenumber, applied to the FTIR spectrum of cannot reproduce the observed spectra (see Supporting Information).
Decoupling of vibrational modes of an enzyme-bound phosphate containing ligand can also give rise to IR peak pattern changes differing from the molecule’s solution spectral pattern.40,41 Although we cannot disprove this alternative, it would require an even more unlikely coincidence – that decoupling of a vibrational mode for one Pi species would lead to a spectral pattern that is indistinguishable from that of another Pi species. Further, there are other FTIR studies of bound Pi and pyrophosphate in which there were no changes in the vibrational spectra upon enzyme binding so that the observed bound vibrational frequencies correspond directly to the solution frequencies of these ligands.42,43 This precedent for retention of solution-like vibrational properties upon binding together with the analysis above strongly support the interpretation that the observed AP bound Pi spectra reflects bound exhibiting solution-like vibrational frequencies.
Binding Energetics of
Identification of as the AP bound Pi form permits calculation of the intrinsic affinity of AP for . As shown in Scheme 3, Pi binding at pH 8.0 is complex, including both loss of a proton from the prevalent species and uptake of a proton by anionic Ser102. An equivalent thermodynamic description is binding of followed by an internal proton transfer to Ser102 (Scheme 3, diagonal that represents the observed binding affinity, ). As free energy changes along linked equilibria are path-independent, either description can be used to evaluate the binding energetics, and we use the thermodynamic cycle of Scheme 3 to relate the observed binding affinity to the specific equilibrium constant for binding of to AP with neutral Ser102, which we refer to as the intrinsic binding constant, .
Scheme 3.
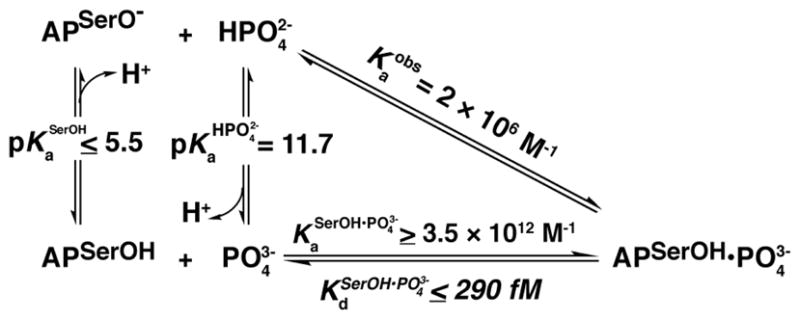
Thermodynamic Cycle for Binding in AP
The affinity of to protonated Ser102 AP cannot be directly observed experimentally because these species do not simultaneously predominate at any pH. Nevertheless, the populations of and protonated Ser102 at pH 8.0 can be calculated based on the known pKa of 11.7 and the estimated pKa for Ser102 of ≤5.5.19 Using these pKa values to calculate the fractions of free and protonated Ser102 at pH 8.0 and the observed Pi affinity at pH 8.0 allows the equilibrium between and protonated Ser102 to be calculated according to eq 5, which was derived from the thermodynamic cycle in Scheme 3. AP exhibits a remarkably strong affinity for , with . Indeed, this affinity is at least on the order of that for streptavidin and biotin44 (10–100 fM), despite the markedly smaller size of and its fewer interacting atoms.
| (5) |
The exceptionally strong affinity of (and, by analogy, of arsenate trianion) for AP relative to the other related molecules in Table 1 is presumably a consequence of at least two factors that are depicted in Scheme 2. The internal proton transfer upon binding neutralizes Ser102 and eliminates electrostatic repulsion between anionic Ser102 and the negatively charged Pi (Scheme 2, hashed red repulsion lines), whereas this repulsion cannot be removed when, for example, sulfate dianion binds. Furthermore, after the Pi proton is transferred, additional negative charge on the trianionic molecule can form stronger electrostatic interactions to the positively charged residues and hydrogen bond donors in the AP active site compared to the interactions formed with other dianionic molecules as illustrated by the larger dots on the right side of Scheme 2. It is also possible that the loss of negative charge on Ser102 could be transmitted through the Zn2+ ligands, although such second order effects are expected to make less significant contributions to the overall binding affinity.
Estimating the Electrostatic Repulsion From Ser102 Anion
The contribution of Ser102 neutralization to the Pi affinity can be estimated by comparing the affinity to AP with Ser102 protonated or deprotonated. The dissociation constant to protonated Ser102 AP ( ) was calculated using the observed Pi affinity at pH 8.0, which gives the upper limit of 290 fM as described above. In principle, the affinity to deprotonated Ser102 AP ( ) could be measured directly since both molecules are expected to populate solution simultaneously at pH values above the pKa of 11.7 for formation of .21 However, AP abruptly loses activity above pH 11.4, presumably due to irreversible denaturation and possibly aggregation. Thus, we can only obtain affinity measurements up to this pH. Nevertheless, if affinity to the Ser102 anionic form of AP were sufficiently high, a positive trend in binding affinity would be observed as pH is increased. However, no such trend is observed, allowing us to set a limit for the affinity of (see Supporting Information for pH-dependence of binding and analysis of the data).
The dissociation constants to protonated and deprotonated Ser102 AP are upper and lower limits, respectively, that allow us to obtain a lower limit for the affinity increase upon protonating Ser102 of 3.4×10⁵-fold [ ]. The simplest explanation for the observed difference of binding affinities is that protonation of Ser102 neutralizes a species that otherwise engages in an electrostatically unfavorable interaction with the negatively charged . The results suggest that this electrostatic repulsion destabilizes binding by at least 7.5 kcal/mol relative to when Ser102 is protonated.
Summary and Implications
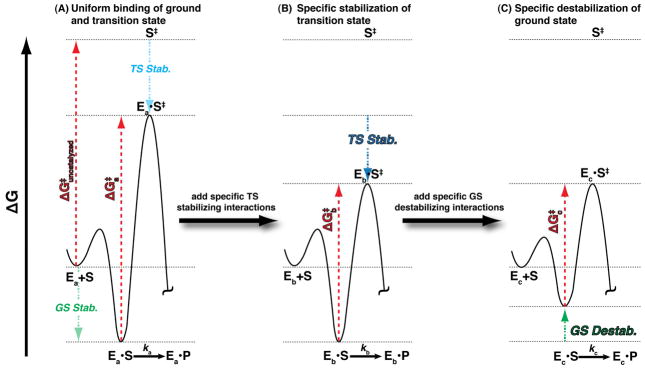
The rate enhancement provided by AP of 1027-fold is the largest of any known enzyme and corresponds to a lowering of the reaction barrier by 37 kcal/mol.2 As for any enzyme, if AP were to bind its substrates with the same amount of energy as it stabilizes the transition state, no catalysis would result – i.e., an enzyme that lowers the free energy of the ground state and transition state to the same extent does not provide catalysis, as shown for a hypothetical enzyme in Figure 5A.45,46 AP engages in a number of interactions that preferentially stabilize the transition state (Figure 5B). For example, the negative charge that accumulates on the leaving group oxygen in the transition state is stabilized by an electrostatic interaction with one of the active site Zn2+ ions.19,47,48 Also there is evidence that interactions specifically formed in the transition state between the nonbridging phosphoryl oxygen atoms and the AP Zn2+ and Arg166 moieties position the phosphorous for attack by the active site nucleophile Ser102.48,49
Figure 5.
Free energy reaction profiles illustrating how preferential E•S ground state destablization relative to the free E+S ground state and transition state can contribute to catalysis in the E•S → E•S‡ reaction step. (A) A hypothetical enzyme, Ea, that stabilizes the ground state (E•S) and transition state (E•S‡) equally, resulting in a reaction barrier, , equal to the uncatalyzed reaction barrier . Thus, this enzyme is not a catalyst. (B) Enzyme Eb is modified from Ea such that additional interactions are added that specifically stabilize the transition state relative to the E+S and E•S states. Thus, is less than and the rate constant kb is larger than ka (in Part A). This type of effect could arise from addition of a general acid or base catalyst for example. (C) Enzyme Ec destabilizes the ground state relative to the E+S and transition state such that is less than and the rate constant kc is larger than kb (in Part B).
Nevertheless, AP has the remarkably difficult task of providing this extraordinary transition state stabilization while acting nonspecifically on phosphate ester substrates and thus using only proximal and not remote binding interactions to facilitate catalysis. This focused recognition, coupled with the high catalytic efficiency, raises the question of how AP limits strong interactions with the ground state phosphoryl group of substrates, interactions that could lead to saturation at low substrate concentrations and inefficient catalysis.
Our investigation into the origins of the discrimination between the ground and transition state of AP reaction began with the identification of a paradox that seemingly similar ligands can have very different binding affinities for AP. A common feature of the ligands that bind AP most tightly, Pi and arsenate, is the presence of a transferable proton. The FTIR results described herein provide strong evidence that is bound to AP, and prior pH dependencies of binding and activity showed no net proton transfer to or from solution upon Pi binding, indicating that the proton lost from upon binding is transferred to a group on AP. Ser102, the active site nucleophile, is within 3 Å of the bound Pi,26 is presumed to be anionic in free AP,19 and is the likely proton acceptor (Scheme 2; see Ser102 discussion section in Supporting Information). The proton transfer model, in addition to explaining the observed binding, also explains how the Pi proton enables stronger binding compared to ligands lacking this transferable proton. A critical component of this model is that the internal proton transfer from Pi to Ser102 neutralizes electrostatic repulsion between the negatively charged Pi ligand and the anionic Ser102 proton acceptor. Thus, a prediction of this model is that removal of anionic Ser102 from the AP active site would lead to an increase in the affinity for Pi, and this prediction has been confirmed by the observation of increased Pi binding affinity upon mutation of Ser102 to Ala or Gly (unpublished results).
The binding model also has implications for how the covalently bound E-O species is formed from noncovalently bound Pi. To form the covalent species Ser102 must attack Pi and one of the non-bridging oxygen atoms of Pi must depart. Because –OH− is a much better leaving group than –O2− it is likely that the noncovalently bound accepts a proton from Ser102, leaving this nucleophile deprotonated and allowing for a –OH− leaving group. (This reaction pathway may also be facilitated by the greater nucleophilicity of Ser102 alkoxide relative to neutral Ser102, although there appears to be limited nucleophilic involvement in this reaction.2,19,50,51)
One important functional consequence of the electrostatic repulsion is to decrease the affinity of AP for inorganic phosphate, which could otherwise cripple the reaction via very strong product inhibition. The observed Kd for Pi binding19,20 at pH 8.0 of ~1 μM would be even lower without the need for Ser102 protonation upon binding. If the affinity for an alternative version of AP without the anionic Ser102 were the same as the affinity for protonated Ser102 AP, the observed Pi dissociation constant at pH 8.0 would be <2 nM – thereby giving inhibition with 103-fold less Pi than is needed to inhibit AP with Ser102.
The internal proton transfer to minimize electrostatic repulsion indicated from the above results also exposes a potential role for ground state destabilization in AP catalysis. In general, destabilization that is specific to the reaction’s ground state (and not carried over to the transition state – see below) can contribute to the required preference for recognition of the reaction transition state. To define how ground state destabilization contributes to catalysis and how it is distinct from transition state stabilization, a careful comparison of well-defined energetic states is required.
Interactions that contribute to the lowering of the transition state barrier relative to both the E+S and E•S states are defined as transition state stabilizing interactions (Figure 5B). In the case of AP, interactions between the Zn2+ ions and the leaving group oxygen and an oxygen atom that situates between the metal ions likely get stronger in the transition state compared to the corresponding interactions in the E•S ground state and compared to the analogous interactions between water and the free substrate or enzyme in the E+S state.
Interactions that increase the energy of the E•S state relative to the E+S and transition states are defined as ground state destabilizing (Figure 5C; see Ref. 18). The most common origin of ground state destabilization is likely a conformational entropic penalty arising from the binding and positioning of substrates next to each other and next to reactive groups in the active site. The binding energy of the enzyme is used to “pay” the entropic penalty upon formation of the E•S state. The barrier to forming the E•S‡ state from the E•S state involves limited rearrangement of bound substrates with respect to each other (for multi-substrate reactions) and with respect to catalytic groups on the enzyme (for all reactions). The enzyme catalyzed reaction barrier is thereby lowered relative to the solution barrier, which requires the full penalty of loss of conformational entropy in bringing reactants together in the transition state.18,52,53 A more formal discussion of this origin of ground state destabilization is presented in the Supporting Information.
Other mechanisms of destabilization may be utilized when binding energy, in addition to being used to pay for the entropic destabilization discussed above, is used to geometrically or electrostatically destabilize the bound substrates relative to the free unbound state and the transition state. An example of such a mechanism is the proposed geometric destabilization of bound lysozyme substrates.54–56 The substrate sugar molecule favors a chair-like conformation in solution with the carbon atom at which bond breaking occurs having tetrahedral sp3 hybridization. The oxycarbonium-like transition state has sp2 character at the reactive carbon and thus an overall half-chair or sofa conformation. An X-ray structure of lysozyme revealed a bound substrate analog distorted away from the chair and toward the sofa conformation.57 This geometrical destabilization of the preferred chair conformation in the E•S state would be relieved as the reaction progresses, in accordance with the general ground state destabilization definition, as the sofa conformation is the preferred geometry in the transition state. Several other enzymes have been proposed to use destabilization distinct from entropic destabilization18,53,58–60; nevertheless, in most cases, clear energetic descriptions and comparisons of the free, ground, and transition states with and without the proposed destabilizing interaction are difficult to make and are very challenging to quantify experimentally. Our results with AP, coupled with prior characterization of the phosphoryl transfer transition state, allow for a particularly clear assessment for the potential role of electrostatic ground state destabilization in AP as described below.
The binding results obtained here suggest that Ser102 electrostatically destabilizes the E•S ground state. As destabilization requires a comparison, the comparison state must be defined. For destabilization via conformational entropy described above, bound substrates were compared to substrates free in solution. Here we compare AP with Ser102 as an anion relative to a hypothetical enzyme with a neutral nucleophile.2
Comparing the affinity for protonated Ser102 versus deprotonated Ser102 shows that neutralization of Ser102 results in a binding affinity increase of ≥3.4×10⁵-fold, which corresponds to at least 7.5 kcal/mol of binding energy. The destabilization will be operative with phosphate ester substrates as they lack a proton to transfer to neutralize Ser102. The effect on binding of the actual phosphate monoester substrate can be estimated to be ≥5 kcal/mol by scaling the destabilization calculated for to account for the charge of −2 on the phosphate ester [≥5 kcal/mol = (−2/−3) × (≥7.5 kcal/mol)].3 This estimate suggests that without an anionic nucleophile to impart electrostatic repulsion to the AP ground state, the phosphate monoester substrate would bind AP more tightly by at least 5 kcal/mol, corresponding to ≥4.8×10³-fold stronger binding and possible saturation at much lower substrate concentrations.
We further propose that the electrostatic repulsion between the Ser102 nucleophile and negatively charged ground state molecules is absent (or nearly so) in the transition state so that there is preferential destabilization of the AP ground state relative to the transition state as befits the definition of ground state destabilization noted above. Previous studies of reactions in aqueous solution provide strong evidence against substantial electrostatic repulsion, suggesting that electrostatic repulsion does not affect the relative energy of free anionic reactants in solution relative to their solution transition state.61
The evidence for an absence of significant electrostatic repulsion between the nucleophile and the substrate in the transition state comes from linear free energy relationships and ionic strength dependencies for nonenzymatic reactions, as follows. Oxygen nucleophiles with higher pKa values react with phosphorylated substrates faster, following a typical Brønsted relationship. Remarkably, despite the net negative charge of the transferred phosphoryl group, oxygen nucleophiles that are neutral, anionic, and dianionic follow a single correlation line.61–63 Thus, there is no indication of unfavorable anion-anion repulsions that destabilize the transition state. In addition, significant electrostatic repulsion in the transition state, relative to the solution ground state of fully separated reactants that do not experience repulsion, would predict differential ionic strength dependences for reaction with a neutral versus anionic nucleophile. However, increasing ionic strength from 0.03 to 3 M gave only a 5-fold increase in reaction of an anionic nucleophile with a phosphorylated substrate relative to the reaction with neutral nucleophiles, suggesting that there is no substantial electrostatic repulsion in the transition state for phosphoryl transfer to an anion nucleophile in solution (relative to the separated reactants in solution).61 While there may be a somewhat larger effect for phosphate monoesters, which are dianionic, than for the phosphorylated pyridines used in the experiments above, which are overall monoanions, both sets of compounds have a formal charge of −2 on the phosphoryl group and large differences are not anticipated. While these results strongly suggest the absence of substantial electrostatic repulsion in the transition state for phosphoryl transfer, the interplay of electrostatic and solvation effects that lead to this limited dependence of reactivity on charge and ionic strength is not understood.
These prior observations combined with those presented herein suggest that AP utilizes ground state destabilization to enhance catalysis. Anionic phosphoryl substrates are destabilized upon binding to AP via interaction with the Ser102 alkoxide. The nonenzymatic studies described above suggest that there is no substantial destabilization in the transition state due to formal charge on the attacking group. Thus, destabilization present in the enzymatic ground state will be limited or absent in the transition state so that catalysis can be enhanced via this mechanism.
Using a neutral serine would compromise catalysis both by the use of a less reactive nucleophile and by the loss of ground state destabilization. Phosphoryl transfer enzymes can also utilize nitrogen nucleophiles.64 Nitrogen nucleophiles are intrinsically more reactive toward phosphoryl compounds than oxygen nucleophiles65 but are not expected to provide ground state destabilization. It will be fascinating to compare and contrast the catalytic strategies employed by phosphoryl transfer enzymes that use a neutral oxygen nucleophile, typically with a group to facilitate proton release from the attacking group, those that use nitrogen nucleophiles, and those that employ oxy- or thio-anions, and to uncover evolutionary precursors and the events that may have led to these choices.
Experimental Section
Materials
Buffering agents, metal salts, enzyme substrates and ligands, and enzyme purification and crystallization materials/reagents were obtained from commercial sources. Deuterium oxide (99%) and 18O-water (97%) were obtained from Cambridge Isotope Laboratories. 18O-labeled inorganic phosphate was prepared according to the published procedure.66
AP Expression and Purification
wtAP was purified using an N-terminal maltose binding protein (MBP) fusion construct (AP-MBP) in the pMAL-p2X vector (New England Biolabs) as previously described.67 E. coli SM547(DE3) cells68 were used for expression. Purity was estimated to be >95% as judged visually by band intensities on Coomassie blue-stained SDS-polyacrylamide gels. Protein concentrations were determined by absorbance at 280 nm (background subtracted by absorbance at 330 nm) in 8 M guanidine hydrochloride (Gdn•HCl) and 20 mM sodium phosphate, pH6.5, using a calculated extinction coefficient for the AP monomer of 31,390 M−1cm−1.69 AP functions as a dimer70 but concentrations are reported as the concentration of AP monomer. AP concentrations were confirmed by activity assays using 1 mM p-nitrophenyl phosphate (pNPP), which agreed to within 20% of previously reported kcat values.49
Pi can occupy AP immediately following purification. To reduce inorganic Pi contamination below 5%, the purified AP preparations were subjected to dialysis in 6 M Gdn•HCl at 25 °C for several days. Levels of inorganic phosphate in the protein samples were measured using a modified malachite green assay:67 100 μL of protein sample was diluted in 400 μL of 6 M Gdn•HCl and added to 450 μL malachite green solution. After 2 min 50 μL of a 34% (w/v) sodium citrate solution was added and 30 min later absorbance at 644 nm was measured in a Perkin-Elmer Lamba 25 spectrophotometer. After the dialysis to remove phosphate, protein samples were rapidly diluted into 100 mM Tris•HCl, pH 8.0, 1 mM MgCl2, 100 μM ZnCl2. Activity assays using pNPP demonstrated that ≥90% of the pre-dialyzed activity was retained (data not shown).
Inhibition Measurements of AP Ligands
Assay conditions for inhibition experiments were 100 mM NaMOPS, pH 8.0, 100 mM NaCl, 1 mM MgCl2, and 100 μM ZnCl2. For Pi, arsenate, and methyl phosphonate inhibition measurements, initial rates for p-nitrophenyl sulfate (pNPS) hydrolysis were monitored in the presence of varying inhibitor concentrations – typically 10-fold above and below the observed Ki value. The slower pNPS substrate was used to enable the assay to be carried out under sub-saturating conditions (KM ≫ [S]), and to avoid product inhibition from Pi that would be generated from a phosphate monoester substrate. Because of the low activity of AP toward pNPS, protein concentrations of 0.1–1 μM were needed in the kinetic inhibition assays to observe rates above background. As a result, the simplifying assumption that [I]free=[I]total does not hold (because [AP] is similar to or greater than Ki, except for the methyl phosphonate assays), and the commonly used form of the Michaelis-Menten equation with competitive inhibition could not be used. Instead, the quadratic form of the inhibition equation was used for the Pi and arsenate fits as reported previously.49 For sulfate inhibition buffer conditions were as described above and an alkyl phosphate substrate was used to allow initial rates to be monitored under sub-saturating conditions. No significant inhibition was observed up to 1 M sulfate (results not shown).19
Difference FTIR Spectroscopy
For the isotope-edited difference FTIR spectroscopy measurements of phosphate bound to AP, the protein was concentrated typically to 2–4 mM in 10 mM buffer, 100 mM NaCl, 1 mM MgCl2, and 100 μM ZnCl2 (although the difference spectra were insensitive to the precise concentrations of buffer, salt, and metals). The FTIR measurement required two protein samples (~55 μL each) that were identical except that one contained 16O-labeled phosphate and the other contained 18O-labeled phosphate. Because AP is known to catalyze the exchange of phosphate oxygen atoms with solvent water71–73, it was necessary to have the sample for 18O-phosphate in 18O-labeled water to avoid AP-catalyzed 18O-16O exchange of the 18O-phosphate ligand. To accomplish this the AP samples, once divided into two equal sample volumes, were subjected to lyophilization for ~6 hrs. Double distilled 16O-water was added to one sample while an equal volume of 18O-water was added to the other sample. After the lyophilization process the matching of the protein samples was assessed by measuring the protein concentration by absorbance at 280 nm and by confirming that the phosphate occupancy remained <5% by the malachite green assay. Assays of post-lyophilized AP samples demonstrated that >90% of the original pNPPase activity of the AP sample was retained (data not shown). Assays carried out after FTIR measurements showed that no significant activity was lost during the experiment.
FTIR spectroscopy was performed on a Magna 760 Fourier transform spectrometer (Nicolet Instrument Corp., WI) using a mercury-cadmium-telluride (MCT) detector. Sub-stoichiometric or excess levels of inorganic phosphate were added to AP protein samples that had been matched as described above (because the Kd for phosphate binding to AP is much less than the concentrations of AP used for the FTIR measurements nearly all of the phosphate added at sub-stoichiometric levels was expected to be bound). AP samples with 16O-labeled phosphate and 18O-labeled phosphate were both loaded into a two-position dual cell shuttle accessory. The FTIR spectra were taken alternatively between these two samples with BaF2 windows and 25 μm Teflon spacers. Spectra were collected in the range of 900–4000 cm−1 with 2 cm−1 resolution. A Blackman-Harris three-term apodization was applied followed by a Happ-Genzel apodization. Since the sample and reference cells were assembled separately, their path lengths were not exactly equal and a correction to the subtracted spectrum was necessary typically in the range of 0.95–1.05 as observed previously.74
31P-NMR
Samples for 31P-NMR measurements typically had 1–2 mM AP protein, 100 mM buffer, 100 mM NaCl, 1 mM MgCl2, and 100 μM ZnCl2. Sub-stoichiometric (data not shown) and excess levels of phosphate were added to the samples to identify peaks that were associated with bound phosphate and free phosphate in solution. 31P-NMR spectra were recorded at 161.97 MHz on a Varian Mercury spectrometer equipped with a broadband tunable probe. Sample volumes of ~350 μL were contained in 5 mm tubes fitted with a coaxial capillary insert (Wilmad Lab Glass) containing D2O for the external field-frequency lock. Spectra were recorded at 37 °C with a sweep width of 50,000 Hz, pulse delay of 2 s, and an acquisition time of 0.8 s. Proton decoupling was employed and S/N of >10 could usually be obtained after ~10,000 transients (~11 hours). A line broadening of 10–20 Hz was typically applied and all spectra were referenced to a 1% phosphoric acid external standard.
Supplementary Material
Acknowledgments
This work was supported by a grant from the NIH to D.H. (GM64798). L.D.A was supported in part by an NIH training grant (R1GM064798) and H.D. was supported by NIH grant EB001958 and GM068036. We thank members of the Herschlag lab for critical discussions and comments on the manuscript and Bob Callender for his support and encouragement.
Footnotes
Indeed, there is a decrease in affinity with increasing pH. However, this decrease arises from a titration to an inactive form of AP, with a pKa of 8, as determined by several activity and binding experiments with species that do not have a titratable proton with a pKa in or near this pH range. Proper accounting for this inactive form then reveals pH-independent binding of Pi to the active form. (See reference 19 and Supporting Information.)
The anionic Ser102 may also be a stronger nucleophile than neutral serine and may therefore give a faster reaction for that reason. Here we describe only the electrostatic effects in order to focus on possible ground state destabilization via electrostatic interactions.
The destabilization energy for a phosphate monoester estimated from the ≥7.5 kcal/mol of destabilization to the could be scaled in multiple ways. For example, scaling based on a simple charge per atom basis (charge per non-bridging oxygen atom for is −0.75 and for the phosphate monoester it is −0.67) would result in a calculated destabilization for the phosphate monoester of ≥6.7 kcal/mol [=(−0.67/−0.75) × (≥7.5)]. Computationally calculated charges for each atom could also be used.75 Regardless, any reasonable scaling choice gives substantial estimated destabilization for the phosphate monoester.
Supporting Information Available
Derivation of the AP rate enhancement and formal transition state affinity, an explanation of previous AP pH-dependent Pi affinity measurements suggesting no net proton transfer to solution upon binding, a summary of the evidence supporting the assignment of the Ser102 pKa of less than 5.5, a more detailed interpretation of the pH 5.0 FTIR spectrum, analysis of potential FTIR vibrational frequency shifts, data for estimating the affinity for deprotonated Ser102 AP, and a description of ground state destabilization via restriction in conformational freedom. This material is available free of charge via the Internet at http://pubs.acs.org.
References
- 1.Lad C, Williams NH, Wolfenden R. Proc Natl Acad Sci USA. 2003;100:5607–5610. doi: 10.1073/pnas.0631607100. [DOI] [PMC free article] [PubMed] [Google Scholar]
- 2.Lassila JK, Zalatan JG, Herschlag D. Annu Rev Biochem. 2011;80:669–702. doi: 10.1146/annurev-biochem-060409-092741. [DOI] [PMC free article] [PubMed] [Google Scholar]
- 3.Reid TW, Wilson IB. In: The Enzymes. Boyer PD, editor. Academic Press; New York: 1971. pp. 373–415. [Google Scholar]
- 4.Coleman JE. Annu Rev Biophys Biomol Struc. 1992;21:441–483. doi: 10.1146/annurev.bb.21.060192.002301. [DOI] [PubMed] [Google Scholar]
- 5.Holtz K, Kantrowitz E. FEBS Lett. 1999;462:7–11. doi: 10.1016/s0014-5793(99)01448-9. [DOI] [PubMed] [Google Scholar]
- 6.Kim EE, Wyckoff HW. J Mol Biol. 1991;218:449–464. doi: 10.1016/0022-2836(91)90724-k. [DOI] [PubMed] [Google Scholar]
- 7.Horiuchi S. Jpn J Med Sci Biol. 1959;12:429–440. doi: 10.7883/yoken1952.12.429. [DOI] [PubMed] [Google Scholar]
- 8.Heppel LA, Harkness DR, Hilmoe RJ. J Biol Chem. 1962;237:841–846. [PubMed] [Google Scholar]
- 9.Schwartz JH. Proc Natl Acad Sci USA. 1963;49:871–878. doi: 10.1073/pnas.49.6.871. [DOI] [PMC free article] [PubMed] [Google Scholar]
- 10.Horiuchi T, Horiuchi S, Mizuno D. Nature. 1959;183:1529–1530. doi: 10.1038/1831529b0. [DOI] [PubMed] [Google Scholar]
- 11.Polanyi MZ. Elektrochem Z. 1921;27:142. [Google Scholar]
- 12.Pauling L. Chem Eng News. 1946;24:1375–1377. [Google Scholar]
- 13.Wolfenden R. Acc Chem Res. 1972;5:10–18. [Google Scholar]
- 14.Lienhard GE. Science. 1973;180:149–154. doi: 10.1126/science.180.4082.149. [DOI] [PubMed] [Google Scholar]
- 15.Jencks WP. Catalysis in Chemistry and Enzymology. Dover Publications, Inc; New York: 1987. [Google Scholar]
- 16.Haldane J. Enzymes. Longmans, Green; London: 1930. [Google Scholar]
- 17.Page MI, Jencks WP. Proc Natl Acad Sci USA. 1971;68:1678–1683. doi: 10.1073/pnas.68.8.1678. [DOI] [PMC free article] [PubMed] [Google Scholar]
- 18.Jencks WP. Advances in Enzymology. 1975;43:219–410. doi: 10.1002/9780470122884.ch4. [DOI] [PubMed] [Google Scholar]
- 19.O’Brien PJ, Herschlag D. Biochemistry. 2002;41:3207–3225. doi: 10.1021/bi012166y. [DOI] [PubMed] [Google Scholar]
- 20.Snyder SL, Wilson IB. Biochemistry. 1972;11:1616–1623. doi: 10.1021/bi00759a012. [DOI] [PubMed] [Google Scholar]
- 21.Martell AE, Smith RM. Critical Stability Constants. 1–6. Plenum Press; New York: 1989. [Google Scholar]
- 22.Fersht AR. Trends Biochem Sci. 1987;12:301–304. [Google Scholar]
- 23.Fersht AR, Shi JP, Knill-Jones J, Lowe DM, Wilkinson AJ, Blow DM, Brick P, Carter P, Waye MM, Winter G. Nature. 1985;314:235–238. doi: 10.1038/314235a0. [DOI] [PubMed] [Google Scholar]
- 24.Fersht AR. Biochemistry. 1988;27:1577–1580. doi: 10.1021/bi00405a027. [DOI] [PubMed] [Google Scholar]
- 25.Lowe DM, Winter G, Fersht AR. Biochemistry. 1987;26:6038–6043. doi: 10.1021/bi00393a014. [DOI] [PubMed] [Google Scholar]
- 26.Kim EE, Wyckoff HW. J Mol Biol. 1991;218:449–464. doi: 10.1016/0022-2836(91)90724-k. [DOI] [PubMed] [Google Scholar]
- 27.Stec B, Holtz K, Kantrowitz E. J Mol Biol. 2000 doi: 10.1006/jmbi.2000.3799. [DOI] [PubMed] [Google Scholar]
- 28.Chapman AC, Thirlwell LE. Spectrochimica Acta. 1964;20:937–947. [Google Scholar]
- 29.Ray WJ, Burgner JW, Deng H, Callender R. Biochemistry. 1993;32:12977–12983. doi: 10.1021/bi00211a005. [DOI] [PubMed] [Google Scholar]
- 30.Zwick A, Lakhdar-Ghazal F, Tocanne J. J Chem Soc, Faraday Trans 2. 1989;85:783–788. [Google Scholar]
- 31.Yue KT, Deng H, Callender R. J Raman Spec. 1989;20:541–545. [Google Scholar]
- 32.Callender R, Deng H. Annu Rev Biophys Biomol Struc. 1994;23:215–245. doi: 10.1146/annurev.bb.23.060194.001243. [DOI] [PubMed] [Google Scholar]
- 33.Tonge PJ, Pusztai M, White AJ, Wharton CW, Carey PR. Biochemistry. 1991;30:4790–4795. doi: 10.1021/bi00233a021. [DOI] [PubMed] [Google Scholar]
- 34.Braiman MS, Rothschild KJ. Annu Rev Biophys Chem. 1988;17:541–570. doi: 10.1146/annurev.bb.17.060188.002545. [DOI] [PubMed] [Google Scholar]
- 35.Reid TW, Pavlic M, Sullivan DJ, Wilson IB. Biochemistry. 1969;8:3184–3188. doi: 10.1021/bi00836a008. [DOI] [PubMed] [Google Scholar]
- 36.Chlebowski J, Armitage I, Tusa P, Coleman J. J Biol Chem. 1976;251:1207–1261. [PubMed] [Google Scholar]
- 37.Gettins P, Coleman JE. J Biol Chem. 1983;258:408–416. [PubMed] [Google Scholar]
- 38.Chlebowski JF, Armitage IM, Coleman JE. J Biol Chem. 1977;252:7053–7061. [PubMed] [Google Scholar]
- 39.Wang JH, Xiao DG, Deng H, Webb MR, Callender R. Biochemistry. 1998;37:11106–11116. doi: 10.1021/bi980471m. [DOI] [PubMed] [Google Scholar]
- 40.Cheng H, Sukal S, Deng H, Leyh T, Callender R. Biochemistry. 2001;40:4035–4043. doi: 10.1021/bi0021131. [DOI] [PubMed] [Google Scholar]
- 41.Deng H, Lewandowicz A, Schramm VL, Callender R. J Am Chem Soc. 2004;126:9516–9517. doi: 10.1021/ja049296p. [DOI] [PubMed] [Google Scholar]
- 42.Deng H, Ray WJ, Burgner JW, Callender R. Biochemistry. 1993;32:12984–12992. doi: 10.1021/bi00211a006. [DOI] [PubMed] [Google Scholar]
- 43.Zhang Y, Deng H, Schramm VL. J Am Chem Soc. 2010;132:17023–17031. doi: 10.1021/ja107806j. [DOI] [PMC free article] [PubMed] [Google Scholar]
- 44.Green NM. Methods Enzymol. 1990;184:51–67. doi: 10.1016/0076-6879(90)84259-j. [DOI] [PubMed] [Google Scholar]
- 45.Albery WJ, Knowles JR. Biochemistry. 1976;15:5631–5640. doi: 10.1021/bi00670a032. [DOI] [PubMed] [Google Scholar]
- 46.Kraut DA, Carroll KS, Herschlag D. Annu Rev Biochem. 2003;72:517–571. doi: 10.1146/annurev.biochem.72.121801.161617. [DOI] [PubMed] [Google Scholar]
- 47.Nikolic-Hughes I, Rees DC, Herschlag D. J Am Chem Soc. 2004;126:11814–11819. doi: 10.1021/ja0480421. [DOI] [PubMed] [Google Scholar]
- 48.Catrina I, O’Brien PJ, Purcell J, Nikolic-Hughes I, Zalatan JG, Hengge AC, Herschlag D. J Am Chem Soc. 2007;129:5760–5765. doi: 10.1021/ja069111+. [DOI] [PMC free article] [PubMed] [Google Scholar]
- 49.O’Brien PJ, Lassila JK, Fenn TD, Zalatan JG, Herschlag D. Biochemistry. 2008;47:7663–7672. doi: 10.1021/bi800545n. [DOI] [PMC free article] [PubMed] [Google Scholar]
- 50.Hollfelder F, Herschlag D. Biochemistry. 1995;34:12255–12264. doi: 10.1021/bi00038a021. [DOI] [PubMed] [Google Scholar]
- 51.Zalatan JG, Catrina I, Mitchell R, Grzyska PK, O’Brien PJ, Herschlag D, Hengge AC. J Am Chem Soc. 2007;129:9789–9798. doi: 10.1021/ja072196+. [DOI] [PMC free article] [PubMed] [Google Scholar]
- 52.Jencks WP. Proc Natl Acad Sci USA. 1981;78:4046–4050. doi: 10.1073/pnas.78.7.4046. [DOI] [PMC free article] [PubMed] [Google Scholar]
- 53.Jencks WP. Cold Spring Harb Symp Quant Biol. 1987;52:65–73. doi: 10.1101/sqb.1987.052.01.010. [DOI] [PubMed] [Google Scholar]
- 54.Secemski, Lehrer SS, Lienhard GE. J Biol Chem. 1972;247:4740–4748. [PubMed] [Google Scholar]
- 55.Ford LO, Johnson LN, Machin PA, Phillips DC, Tjian R. J Mol Biol. 1974;88:349–371. doi: 10.1016/0022-2836(74)90487-2. [DOI] [PubMed] [Google Scholar]
- 56.Vocadlo DJ, Davies GJ, Laine R, Withers SG. Nature. 2001;412:835–838. doi: 10.1038/35090602. [DOI] [PubMed] [Google Scholar]
- 57.Strynadka NC, James MN. J Mol Biol. 1991;220:401–424. doi: 10.1016/0022-2836(91)90021-w. [DOI] [PubMed] [Google Scholar]
- 58.Anderson VE. Arch Biochem Biophys. 2005;433:27–33. doi: 10.1016/j.abb.2004.09.026. [DOI] [PubMed] [Google Scholar]
- 59.Belasco JG, Knowles JR. Biochemistry. 1980;19:472–477. doi: 10.1021/bi00544a012. [DOI] [PubMed] [Google Scholar]
- 60.Belasco JG, Knowles JR. Biochemistry. 1983;22:122–129. doi: 10.1021/bi00270a018. [DOI] [PubMed] [Google Scholar]
- 61.Herschlag D, Jencks W. J Am Chem Soc. 1989;111:7587–7596. [Google Scholar]
- 62.Herschlag D, Jencks W. J Am Chem Soc. 1989;111:7579–7586. [Google Scholar]
- 63.Herschlag D, Jencks W. J Am Chem Soc. 1990;112:1951–1956. [Google Scholar]
- 64.Rigden DJ. Biochem J. 2008;409:333–348. doi: 10.1042/BJ20071097. [DOI] [PubMed] [Google Scholar]
- 65.Admiraal S, Herschlag D. J Am Chem Soc. 1999;121:5837–5845. [Google Scholar]
- 66.Deng H, Wang J, Callender R, Ray WJ., Jr J Phys Chem B. 1998;102:3617–3623. [Google Scholar]
- 67.Zalatan J, Fenn T, Herschlag D. J Mol Biol. 2008;384:1174–1189. doi: 10.1016/j.jmb.2008.09.059. [DOI] [PMC free article] [PubMed] [Google Scholar]
- 68.Chaidaroglou A, Brezinski D, Middleton S. Biochemistry. 1988;27:8338–8343. doi: 10.1021/bi00422a008. [DOI] [PubMed] [Google Scholar]
- 69.Gill SC, von Hippel PH. Anal Biochem. 1989;182:319–326. doi: 10.1016/0003-2697(89)90602-7. [DOI] [PubMed] [Google Scholar]
- 70.Rothman F, Byrne R. J Mol Biol. 1963;6:330–340. doi: 10.1016/s0022-2836(63)80092-3. [DOI] [PubMed] [Google Scholar]
- 71.Applebury M, Johnson B, Coleman J. J Biol Chem. 1970;245:4968–4976. [PubMed] [Google Scholar]
- 72.Caswell M, Caplow M. Biochemistry. 1980;19:2907–2911. doi: 10.1021/bi00554a014. [DOI] [PubMed] [Google Scholar]
- 73.Bock J, Cohn M. J Biol Chem. 1978;253:4082–4085. [PubMed] [Google Scholar]
- 74.Deng H, Callender R, Schramm VL, Grubmeyer C. Biochemistry. 2010;49:2705–2714. doi: 10.1021/bi100012u. [DOI] [PMC free article] [PubMed] [Google Scholar]
- 75.Kish MM, Viola RE. Inorg Chem. 1999;38:818–820. doi: 10.1021/ic981082j. [DOI] [PubMed] [Google Scholar]
Associated Data
This section collects any data citations, data availability statements, or supplementary materials included in this article.


