

Abstract
Cholesteryl ester (CE) and diacylglycerol (DAG) molecular species are important lipid storage and signaling molecules. Mass spectrometric analyses of these lipids are complicated by the presence of isobaric molecular ions shared by these lipid classes, and by relatively poor electrospray ionization, which is a consequence of an inherent weak dipole moment in these lipid classes. The present study demonstrates that lithiated adducts of CE and DAG molecular ions have enhanced ionization and lipid class specific fragmentation in MS/MS scan modes, thus allowing the implementation of strategies capable of lipid class specific detection. Using neutral loss mode for the loss of cholestane from cholesterol esters (NL 368.5) and specific selected reaction monitoring for DAG molecular species, the response of specific molecular species to that of internal standards was determined. CE and DAG molecular species were quantified in human coronary artery endothelial cells (HCAEC) incubated with both palmitic and oleic acid. Furthermore, NL 368.5 spectra revealed the oxidation of the aliphatic fatty acid residues of cholesterol ester molecular species. Taken together, these studies demonstrate a new analytical approach to assess CE and DAG molecular species that exploits the utility of lithiated adducts in conjunction with MS/MS approaches.
Keywords: Direct-infusion electrospray, Mass spectrometry, Tandem mass spectrometry, Cholesteryl esters, Diacylglycerols, Lithiated adducts, Lipid oxidation, Human coronary artery endothelial cells
Introduction
Lipids are important cellular molecular constituents with critical roles in cell membrane structure and function, energy storage and production, cell signaling, and both tissue and systemic physiological functions[1]. Accordingly, the detection of specific lipid alterations using mass spectrometric methods is an important strategy to interrogate the role of lipids in cellular, tissue and systemic physiological and pathophysiological processes[2, 3]. Two lipid classes of great importance in cell signaling and lipid storage that have been implicated in human disease are cholesteryl esters (CEs) and diacylglycerols (DAGs)[4, 5]. However, mass spectrometry (MS) of these two lipid classes (CE and DAG) is complicated by these two classes having common isobaric molecular ions which render their identity by single stage mass spectrometry incomplete.
DAGs represent an important group of intermediate molecules that are key to the biosynthesis of lipids. DAGs are principally derived from either the hydrolysis of phosphatidylinositols (PI) or phosphatidylcholines (PC) by specific phospholipase C (or the coupled actions of phospholipase D and phosphatidate phosphohydrolase) or by de novo synthesis [6, 7]. The biological function of DAGs is predominantly considered to be two-fold, as an intermediate in the formation of triacylglycerols (TAGs) and phospholipids; and to regulate DAG-sensitive protein kinase C (PKC) isozymes, which modulate numerous cellular processes, including cell growth and differentiation [8, 9]. It should also be appreciated that DAG accumulation has been shown to be associated with diabetes, carcinoma and coronary heart disease[10, 11].
CEs represent an important group of lipids central in the regulation of cholesterol transport and storage in addition toits integral role in membrane function[4, 12]. Cholesterol and CE biosynthesis is tightly regulated by intracellular cholesterol levels[13]. Intracellular CEs are synthesized by the action of acyl CoA acyl transferase (ACAT) and cholesterol is converted to CEs in high-density lipoprotein (HDL) by the action of lecithin cholesterol acyl transferase (LCAT) [14, 15]. Elevated plasma CE levels are associated with atherosclerosis [16, 17]. In addition, under conditions that cholesterol metabolism is altered, such as tumor promotion, elevated tissue CE levels are observed[18]. Furthermore, the appearance of CE-enriched lipid droplets in tissues is a consequence of impaired metabolism or over-nutrition[19, 20]. Alterations in plasma levels of specific molecular species of CE have also been speculated to have utility as predictors of diabetes mellitus, coronary heart disease and cancer [20].
Gas chromatography/mass spectrometry (GC/MS) is frequently used for the analysis of esterified glycerolipid species[21]. However, GC/MS analysis of CEs and DAGs requires a derivatization step (e.g., silyl reagents for electron impact ionization (EI) [22–24], and pentafluorobenzoyl reagents for negative ion chemical ionization (NICI) [22, 25, 26]) to impart the necessary volatility and detection enhancement required for sensitive GC/MS analysis. Thus, attention has focused on the utility of softer ionization techniques for CE and DAG analyses, specifically the use of matrix-assisted laser desorption/ionization (MALDI) [27] and electrospray ionization (ESI) [28–30]. In particular, ESI is compatible with the rapid and sensitive quantification of lipid species in complex matrices without the need for derivatization. Although, both ammoniated and so diated adducts of CE and DAG have been used for detection of molecular species using ESI-MS, these adducts produce only moderate (for CEs) to inconsequential (for DAGs) levels of MS/MS fragmentation[21, 31]. In contrast, lithiated adducts have been described for the analysis of lipids with ESI due to the ability of these adducts to provide enhanced fragmentation in comparison to other adducts [32–34]. However, the utility of lithiated adduct formation for CEs and DAGs has not been examined and contrasted to the use of other adducts.
In this study, ESI-MS/MS strategies were developed and optimized for the species-selective analysis of multiple CE and DAG molecular species. In comparison to ammoniated adducts of CEs and DAGs, lithiated adducts exhibit enhanced ion intensity and fragmentation. Based on collisionally-activated dissociation (CAD) analyses of CEs and DAGs, specific tandem mass spectrometry scanning modes were developed to quantify CE and DAG molecular species. These strategies were applied to examine CE and DAG molecular species in human coronary artery endothelial cells (HCAEC), which were grown in the presence and absence of specific fatty acid supplementation.
Materials and methods
Standards, salts, and solvents
The standards consisted of eight CEs, including myristate (14:0), palmitate (16:0), palmitoleate (16:1), stearate (18:0), oleate (18:1), linoleate (18:2), arachidonate (20:4), and docosahexaenoate (22:6), and seven DAGs, including dipalmitin (16:0-16:0 or 32:0), 1-palmitoyl-2-oleoyl-sn-glycerol (16:0–18:1 or 34:1), distearin (18:0-18:0 or 36:0), diolein (18:1-18:1 or 36:2), ditranseicosanoin (20:1-20:1 or 40:2) and 1-stearoyl-2-linolenoyl-sn-glycerol (18:0–18:2 or 36:2), and 1-stearoyl-2-arachidonyl-sn-glycerol (18:0–20:4 or 38:4). The lipid standards were purchased from NuChek Prep (Elysian, MN) or Avanti Polar Lipids (Alabaster, AL), except for 1-palmitoyl-2-oleoyl-sn-glycerol, which was synthesized as previously described [35]. Individual stock solutions of all the standards were prepared (20 µM in methanol/chloroform, 4/1). The internal standards were cholesteryl heptadecanoate (17:0) and diarachidin(20:0-20:0, or 40:0) (NuChek Prep). The salts used for adduct formation and the Bligh-Dyer (BD) extraction were NaOH, LiOH, LiCl, and ammonium acetate; and were all purchased from either Fisher Scientific (Fair Lawn, NJ) or Sigma (St. Louis, MO). The methanol and chloroform solvents were of HPLC grade and were purchased from Burdick and Jackson (Muskegon, MI).
Electrospray ionization-mass spectrometric analysis
Direct-infusion electrospray ionization mass spectrometric analysis of standards and biological samples was performed in positive ion mode using a Thermo Fisher TSQ Quantum Ultra with Xcalibur data acquisition software. Samples were analyzed at a flow rate of 3 µL/min. Tune parameters were optimized using standards and were set at spray voltage = 3800 V, sheath gas = 8 (arbitrary units), ion sweep gas pressure = 0.5 (arbitrary units), auxiliary gas pressure = 5 (arbitrary units), and capillary temperature = 270 °C. Spectra for survey scans were acquired for five min with a scan rate of 0.5 scans/sec. For MS/MS analyses, several scan modes were investigated, including product ion (i.e., CAD), parent ion, neutral loss (NL), and selected reaction monitoring (SRM). In each MS/MS mode, the collisional energy for the CE and DAG molecular species were optimized and set to 25 and 35 eV, respectively. Initially, the fragmentation of parent ions into its fragments was investigated to determine the most abundant fragments associated with each CE and DAG molecular species. Spectra for each of these MS/MS scan modes were acquired over 3 min with a scan rate of 0.5 scans/sec. For the SRM scan mode, all of the CEs and DAGs were examined with an isolation width of 2 amu. The neutral loss and selected reaction monitoring scans for the different CE and DAG molecular species as lithiated adducts, respectively, are shown in Table 1.
Table 1.
Calibration line parameters for lithiated adducts of CE and DAG molecular species
| CEs | NL 368.5 [M + Li]+ | Line Parameters |
|---|---|---|
| 14:0 | 603.80 | y = 0.7189x + 0.0362 |
| 16:0 | 631.84 | y = 1.2001x + 0.0127 |
| 16:1 | 629.84 | y = 1.8776x + 0.0417 |
| 18:0 | 659.88 | y = 1.1370x + 0.0061 |
| 18:1 | 657.88 | y = 1.9831x + 0.0031 |
| 18:2 | 655.84 | y = 2.6063x + 0.0192 |
| 20:4 | 679.96 | y = 3.6454x + 0.4447 |
| 22:6 | 703.88 | y = 4.0834x + 0.1929 |
| DAGs | SRM | Line Parameters |
| di16:0 | 575.47 → 313.28 | y = 0.7757x + 0.094 |
| 16:0–18:1 | 601.50 → 313.28* | y = 0.9112x 0.0130 |
| 16:0–18:1 | 601.50 → 339.31 | y = 0.8205x + 0.0556 |
| di18:0 | 631.53 → 341.27 | y = 1.0034x − 0.0641 |
| di18:1 | 627.53 → 339.27 | y = 1.5439x − 0.040 |
| 18:0–18:2 | 627.53 → 341.32* | y = 0.9139x + 0.0432 |
| 18:0–18:2 | 627.53 → 337.34 | y = 0.519x + 0.012 |
| 18:0–20:4 | 651.53 → 341.10* | y = 1.7066x + 0.1907 |
| 18:0–20:4 | 651.53 → 361.23 | y = 0.0651x + 0.0061 |
| di20:1 | 683.58 → 367.27 | y = 1.973x − 0.0431 |
Linear regression of ion intensity responses for each CE and DAG molecular species over a concentration range of 0.1, 0.5, 2, 5, and 10 µM was determined. In all cases, the coefficient of determination (R2) was greater than 0.99. The internal standards, 17:0 CE and 20:0-20:0 DAG (SRM 687.58 → 369.31), were constant at 2 µM.
indicates preferred SRM to detect DAG molecular species, which were used in HCAEC studies.
Fatty acid supplementation of HCAECs
Human coronary artery endothelial cells (HCAEC, Cell Applications, San Diego, CA) were grown to > 90% confluency (passages 4 – 9) in 60-mm tissue culture dishes. The HCAECs were grown in EGM-2MV-Bullet Kit media containing 5% serum (Lonza, Walkersville, MD). Prior to fatty acid supplementation, the normal growth media was removed from the dishes and replaced with growth media containing only 2% fetal bovine serum. For the fatty acid supplementation, bovine serum albumin (BSA) – bound palmitic (16:0) and BSA – bound oleic acid (18:1) [36], were added to the media to a final concentration of 200 and 100 µM, palmitic and oleic acid, respectively. Negative control conditions for the fatty acid-supplementation condition included incubating HCAEC with 2% growth media containing BSA with no added fatty acid. The cells were incubated with and without the fatty acid supplementation for 24 h. To enhance lithium adducts of CE and DAG molecular species extracted from the HCAEC treated with or without fatty acid, the media was first removed, and the cells were washed with 5 ml of phosphate buffered saline(PBS). Following cell scraping (with 1 mg/ml LiCl, Figure 1, part I), 1.5 ml of each cell collection was added to 16 × 100 mm glass test-tubes to perform a modified Bligh-Dyer extraction [37]. Briefly, 2.5 ml of methanol (HPLC grade), 2.5 ml of chloroform (HPLC grade), and 0.5 ml of 1 mg/ml LiCl (Figure 1, part II) was added to the scraped cells in 1.5 ml of 1 mg/ml LiCl. During the Bligh-Dyer extraction, the internal standards 17:0 CE (52 pmol) and 20:0-20:0 DAG (49 pmol) were added. The Bligh-Dyer extraction mixture was vortexed, centrifuged at 500g for 2 min, followed by the removal of the organic layer. The remaining upper phase solution was re-extracted by adding 2.5 ml of chloroform. The organic layer was subsequently removed and combined with the first organic extract. The pooled organic extracts were subsequently back-extracted with 4 ml of 1 mg/ml LiCl in the aqueous phase (Figure 1, step III). The chloroform layer was then collected and evaporated to dryness under nitrogen in a screw-cap test-tube, and was immediately resuspended in 250 µl of chloroform, and stored under N2 at − 20 °C until analysis. For direct-infusion ESI analysis, 60 µl of the resuspended lipid solution was added to 240 µl of methanol with 11 µl of LiOH (10 mM) (Figure 1, part IV). For each sample, the ion intensity of each CE and DAG molecular species was divided by the ion intensity of the internal standard (CE 17:0 and 20:0-20:0 DAG), and the mass of each molecular species was determined from each calibration line, which was generated for each molecular species. Values for CE and DAG molecular species are expressed as picomol per µg cell protein (Bio-Rad Laboratories, Inc., Hercules, CA).
Figure 1.
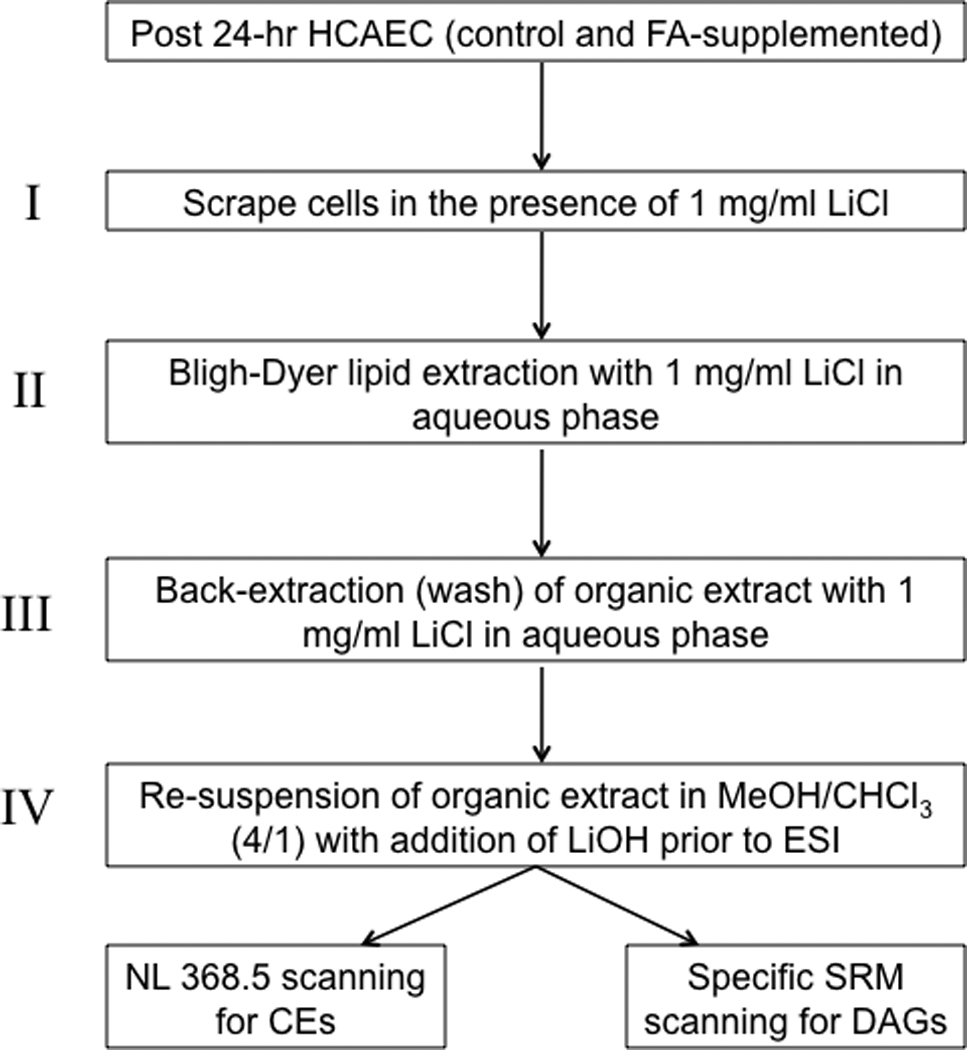
Scheme for the preparation of enriched lithiated adducts of CE and DAG molecular species present in HCAEC for ESI-MS/MS analyses.
Oxidation of unsaturated CEs
Selected CE molecular species (1 nmol) were dried under nitrogen in a 12 × 100 mm borosilicate test-tube and were either immediately resuspended in 250 µL methanol/chloroform (4/1) or were exposed to ambient air for 6 or 15h prior to being resuspended in 250 µL methanol/chloroform (4/1). For each sample, 1 nmol of 17:0 CE was added as an internal calibrant. Precursor CE molecular species and their oxidized products were subsequently examined by neutral loss scan of 368.5 employing the parameters described above. The CEs and CE oxidation species were monitored as lithiated adducts following the addition of LiOH.
Results
Cholesteryl ester analysis using lithiated adducts
Others have shown that CAD of molecular ions of ammonium adducts of cholesteryl esters yields a robust cholestane positive ion (m/z = 369.3) [29, 38, 39]. Our initial studies compared the fragmentation of the lithiated and ammoniated adducts of 16:0 CE (Figure 2). Similar to the results of others[29], our analyses showed the cholestane positive ion was the predominant ion fragment of the ammoniated adduct of 16:0 CE (Figure 2, Panel B). In contrast, CAD analyses of the lithiated adduct of 16:0 CE yielded both a positively-charged lithiated adduct of palmitate (Figure 2, Panel A, m/z = 263.03) and the cholestane fragment. In comparison, it should be noted that the ammoniated adduct of palmitate was not observed with CAD analyses of the ammoniated adduct of 16:0 CE. With all CAD parameters equal (25 eV and 1 atm of argon gas), the relative abundance of the lithiated molecular ion of 16:0 CE (the parent ion) was reduced in comparison to the ammoniated adduct.
Figure 2.
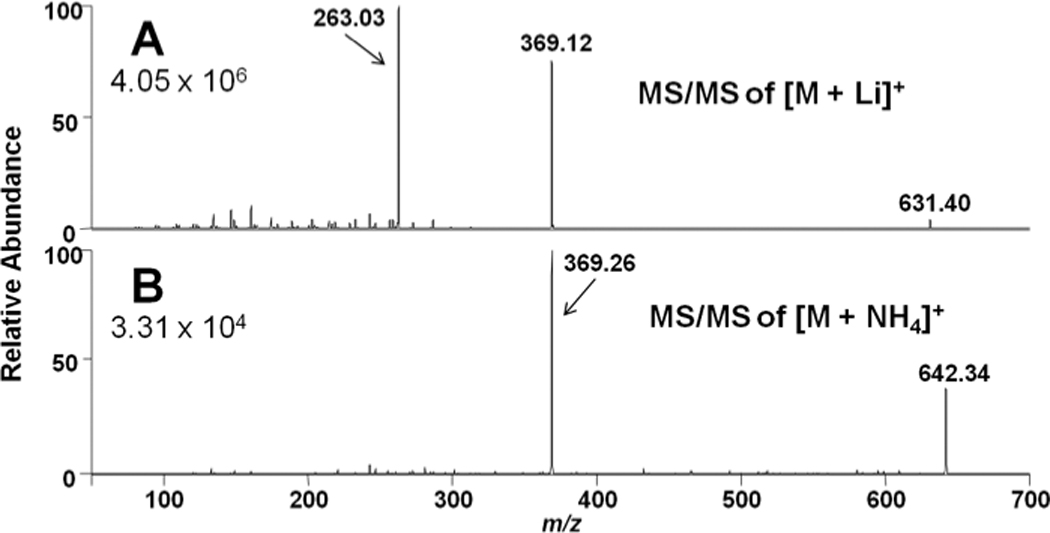
Collisionally-activated dissociation (CAD) of salt adducts of cholesteryl palmitate (16:0 CE). Panels A& B are product ion scans from lithiated and ammoniated adducts, respectively, with a collisional energy of 25 eV and 3 min acquisition time as described in detail in “Materials and Methods”.
Data shown in Figure 3, Panels A and B show the survey scan and CAD analyses of the lithiated adduct of 18:2 CE. Similar to 16:0 CE, the lithiated adduct of 18:2 CE fragments into both the cholestane ion and lithiated fatty acid ion (m/z = 287.12) (Panels B, Figure 3). Also, Panel C of Figure 3 shows the parent ion scan using the product ion of the lithiated fatty acid (e.g., PI 287.12 for the 18:2 CE of the lithiated adducts). Based on this analyses, specific CE molecular species could be identified using lithiated adducts with product ion scanning of the lithiated fatty acid fragment. It should be appreciated that the fragmentation of the lithiated CE molecular species to their lithiated fatty acyl fragments represents the loss of the neutral fragment cholestane, which can be exploited to uniformly detect cholesteryl esters. Figure 3D illustrates the utility of neutral loss scanning for the loss of cholestane (NL 368.5). Accordingly, this neutral loss scan (NL 368.5) was subsequently used to examine an equimolar mixture of CE molecular species, which revealed that CEs with varying degrees of unsaturation had different ionization efficiencies (Figure 4). Data shown in Figure 4 demonstrates that molecular ions of CE molecular species detected as lithiated adducts with NL 368.5 scanning had a greater intensity as the degree of unsaturation increased for lithiated adducts of CEs. Each of these CE molecular species were subsequently examined and compared to 17:0 CE to determine the relative response of each molecular species to that of 17:0 CE, which was used as internal standard. The individual calibration constants for the lithiated CE molecular species are shown in Table 1, which have increased slopes reflecting the enhanced ionization of polyunsaturated fatty acyl CE molecular species.
Figure 3.
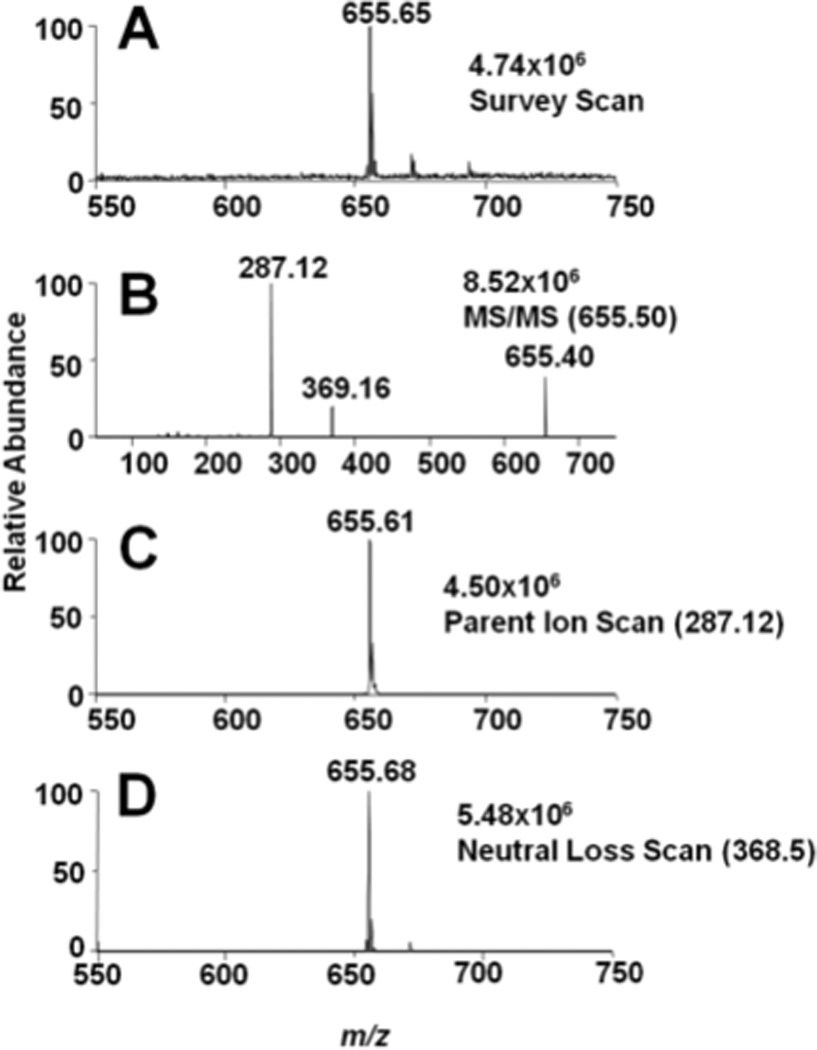
Survey, CAD, parent ion, and neutral loss scans of lithiated cholesteryl linoleate (18:2 CE) using direct-infusion ESI-MS analysis. Survey scans (A) were acquired for five min over the m/z range of 550 – 750. The CAD analysis(B) was performed at a collisional energy of 25 eV. Parent ionscans (C) were acquired from the lithiated fatty acyl fragment (25 eV). The neutral loss of cholestane (NL 368.5) was also performed at 25 eV (D). The concentration of the 18:2 CE was10 µM. The LiOH added prior to ESI analysis was 100 µM.
Figure 4.
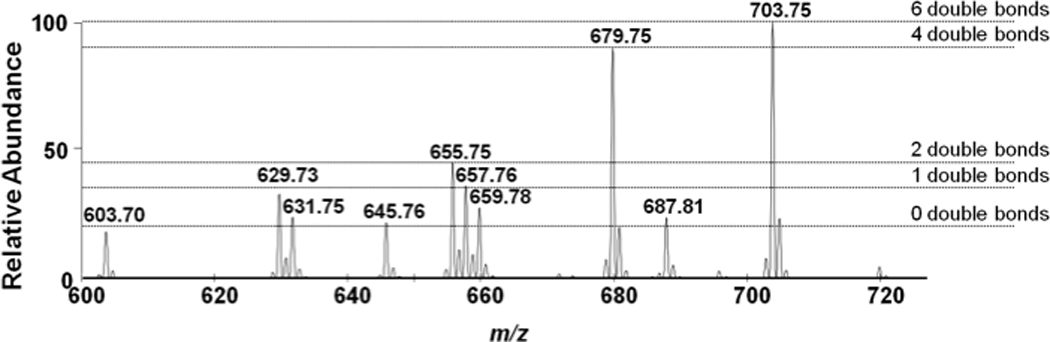
Neutral loss of 368.5 MS/MS analyses of an equimolar mixture of the cholesteryl esters (each at 2µM) as lithiated adducts. Spectra were obtained using the neutral loss 368.5 at a collisional energy of 25 eV as described in “Materials and Methods”. Horizontal dashed lines highlight the disparate ionization efficiencies associated with CE molecular species containing different levels of unsaturation.
Diacylglycerolanalysis using lithiated adducts
Some CE molecular species are isobaric with DAG molecular species, including distearin (18:0-18:0 DAG) and 16:0 CE, which represents some degree of difficulty in using mass spectrometry for their analyses when both analytes are present. Accordingly, DAG molecular species were examined to determine MS/MS strategies that could be employed for their specific detection in the presence of interfering isobaric CE molecular species. Figure 5 shows initial CAD analyses of the lithiated adduct of distearin. Similar to adducts that were formed with CE, lithiated adducts of DAG resulted in multiple fragment ions (Figure 5) with the most predominant fragment ions resulting from the loss of the fatty acid and lithium (m/z 341.07) and fatty acid (m/z 347.06). Also shown in this CAD spectra is the lithiated fatty acid ion (m/z=291.04). Data shown in Figures 6 were acquired based on the fragmentation data shown in Figure 5, and compared the survey, neutral loss, and selected reaction monitoring scans of 18:0-18:0 DAG and 20:0-20:0 DAG with lithiated adducts. Unlike the lipid class-specific neutral loss scan for CEs (NL 368.5), DAG molecular species do not have a DAG-class specific fragmentation (e.g., see Fig. 5). For example, the neutral loss scan shown in Figures 6, Panel B, is specific for 18:0-18:0 DAG, but not 20:0-20:0 DAG (compare survey scan in Panel A to NL scan in Panel B). However, 18:0-18:0 DAG and 20:0-20:0 DAG can both be detected using selected reaction monitoring (SRM) of their transitions with the loss of their fatty acid groups and lithium (Figures 6, Panels C and D). Based on these analyses, monitoring the SRM transition of the lithiated molecular ion with the specific lithiated fatty acyl loss was subsequently used to monitor multiple DAG molecular species (SRM transitions for each DAG molecular species are shown in Table 1). In contrast to CE molecular species, there was only marginal difference in ionization efficiency between DAGs containing varying degrees of unsaturation. Constants for individual DAG calibration lines for the lithiated DAGs using SRM are shown in Table 1. It should be noted that for DAGs with polyunsaturated fatty acids, the SRM transitions of parent ions to the product ion corresponding to the loss of polyunsaturated fatty acyl group and lithium has an increased response compared to the loss of the saturated fatty acyl group and lithium (e.g., see the disparate slopes for the these two transitions of 18:0–20:4 DAG, Table 1). This disparate response likely reflects the instability of the product ion that contains the polyunsaturated acyl residue.
Figure 5.
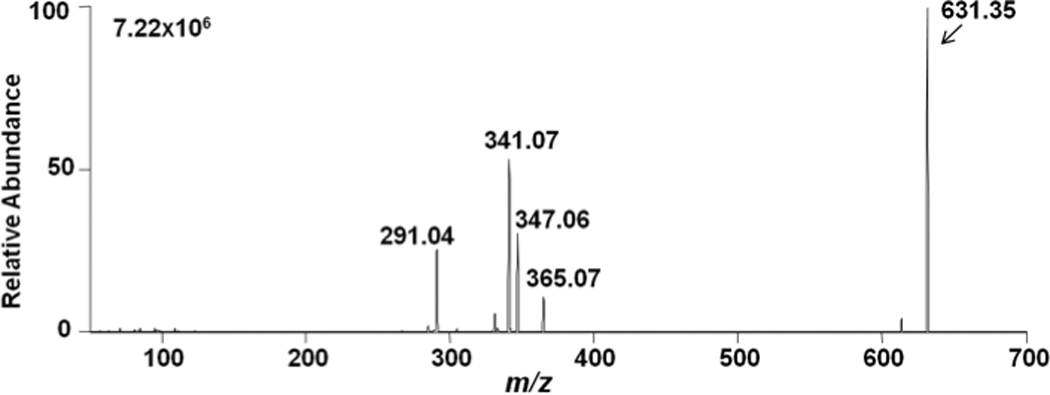
Collisionally-activated dissociation of the lithiated adduct of distearin (18:0-18:0 DAG). Collisional energy was set at 35 eV and data were acquired for 3 min as described in detail in “Materials and Methods”.
Figure 6.
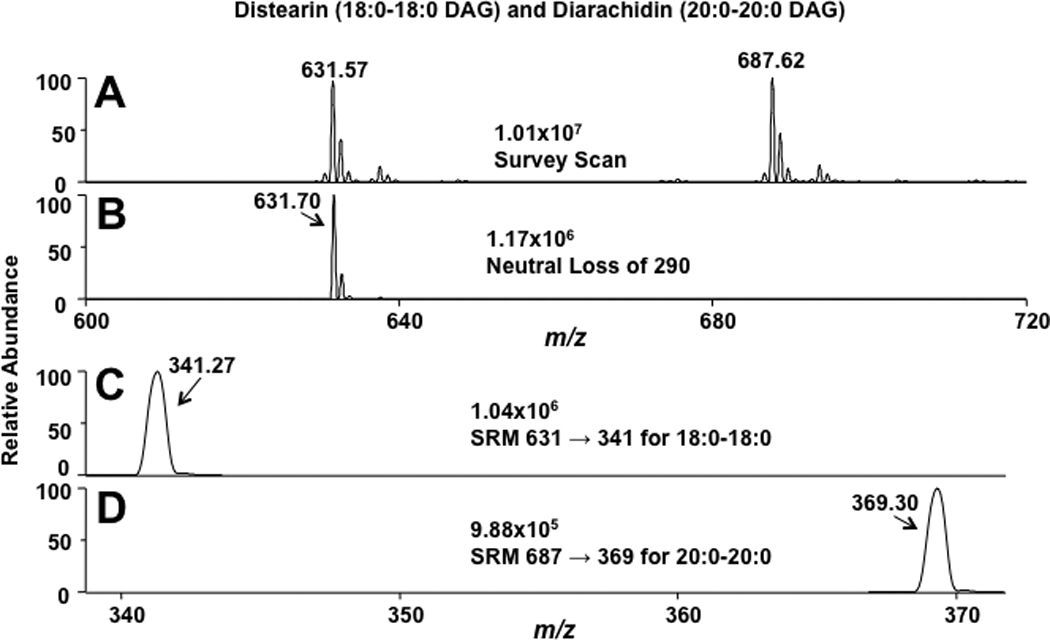
Survey, neutral loss, and selected reaction monitoring (SRM) scans for lithiated distearin (18:0-18:0 DAG) and diarachidin (20:0-20:0 DAG) using direct-infusion ESI-MS analysis. Survey scans (A) were collected for five min over the m/z range of 550 – 750. The neutral loss scans (loss of the lithiated fatty acyl fragment, B) were performed with collisional energy set at 35 eV. SRM scans (C & D) were performed at a collisional energy of 35 eV and an isolation width of 2 amu over a period of 3 min. The concentration of the DAGs was 10 µM. The LiOH added prior to ESI analysis was 100 µM.
Direct-infusion ESI-MS and MS/MS of an isobaric CE/DAG mixture
MS/MS analytical approaches were used to examine CE and DAG molecular species to assess their utility to resolve isobaric molecular species in these two lipid classes. A mixture of cholesteryl palmitate (16:0 CE) and distearin (18:0-18:0 DAG), was examined as lithiated adducts at m/z 631. Additionally cholesteryl heptadecanoate (17:0 CE) and diarachidin (20:0-20:0 DAG), were added as internal calibrants for each lipid class. As shown in the survey scans (Panels A – C) in Figure 7, each molecular species could be detected and compared to the class-specific internal calibrant except when the two isobaric species were both present in the same solution (Panel C). In the isobaric mixture, a large m/z631 ion was produced (due to the inability to isolate the individual isobaric species present at this mass. Panels D – F (Figure 7) show spectra of these same mixtures of CE and DAG using the CE-specific neutral loss of 368.5. As expected, the CEs were detected with this strategy (Panel D and F), while the isobaric DAG counterpart, 18:0-18:0 DAG, was not detected using this scan mode (Panel E). As a comparison, SRM scans for both the CE and DAG isobaric species at m/z 631 are shown in Panels G – I (Figure 7). As shown, in the CE panel (Panel G), only the CE-related SRM scan was detected (631 → 263 for the lithiated species in Figure 7). Conversely in the DAG panel (Panel H), only the DAG specific SRM was detected (631 → 341 for the lithiated species in Figure 7). This CE and DAG species-selective detection was confirmed in the isobaric mixture (Panel I) by showing the two isobaric species isolated by different fatty acyl losses (i.e., different SRM scans). Thus, both the neutral loss of 368.5 and the SRM scan of the fatty acyl loss can be used to distinguish isobaric CE and DAG molecular species, respectively.
Figure 7.
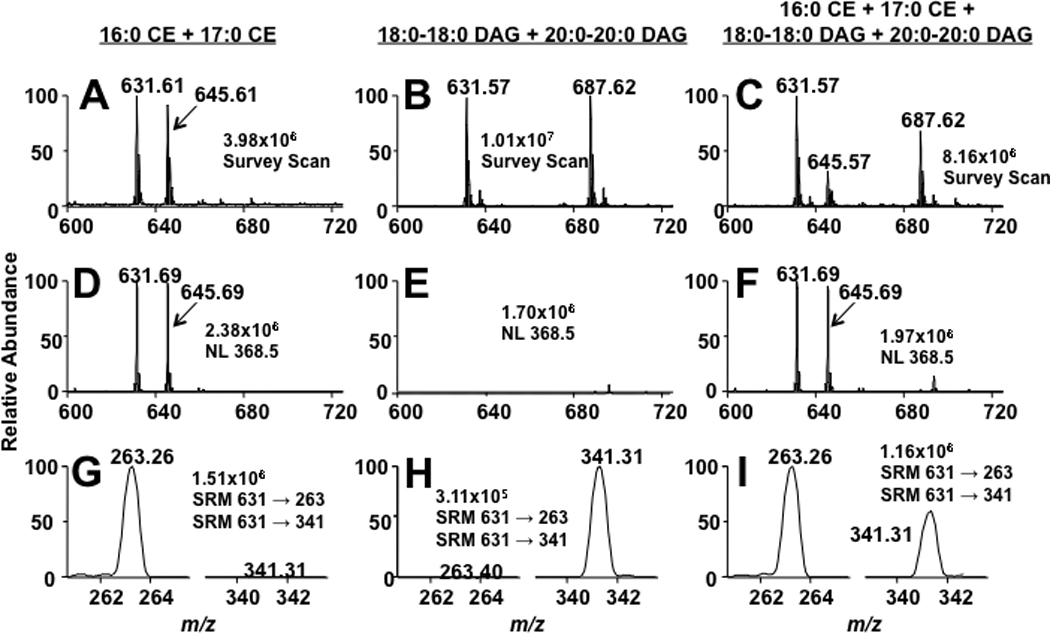
MS and MS/MS analyses of CE and DAG lithiated adducts.16:0 CE and 18:2 CE, (A, D, and G), 18:0-18:0 DAG and 20:0-20:0 DAG (B, E, and H), and a mixture of both CEs and DAGs (C, F, and I) (all lipids present at a concentration of 5 µM)were subjected to direct-infusion ESI-MS analysis. Panels A–C are survey scans of each lipid mixture over an m/z range of 600 – 725 for five min. Panels D–F are scans for the neutral loss of 368.5 (cholesterol backbone), which were acquired for three min. Panels G–I are SRM scans for the lithiated molecular ion and either the specific lithiated fatty acyl loss (DAG) or cholestane (CE), which were acquired over three min (DAG SRM is 631 → 341 and CE SRM is 631 → 263). The collisional energy for the MS/MS analysis of both the CE and DAG molecular species was 25 and 35 eV, respectively. The LiOH added prior to ESI analysis was 100 µM.
Quantification of CE and DAG molecular species in human coronary endothelial cells supplemented with palmitic and oleic acid
As a proof of principle of the utility of specific MS/MS techniques to quantify CE and DAG molecular species using lithium, we quantified the CE and DAG molecular species in human coronary artery endothelial cells (HCAEC) that were supplemented with palmitic acid and oleic acid in the cell culture media. Lipid extracts from HCAEC were prepared in the presence of lithium chloride to enhance lithium adducts in lipid extracts subjected to direct infusion electrospray ionization mass spectrometry (e.g., see Figure 1). Incubating HCAEC with 200 µM palmitic acid and 100 µM oleic acid resulted in a robust increase in both 16:0 and 18:1 CE, in comparison to HCAEC that were not incubated with elevated palmitic acid and oleic acid (Figure 8). The other CE molecular species examined, with the exception of 18:0 CE, did not exhibit any significant differences between HCAEC that were grown in the presence and absence of palmitic acid and oleic acid. Similarly, DAG molecular species containing oleic acid and palmitic acid residues were increased in HCAEC that were grown in the presence of oleic acid and palmitic acid (Figure 9). For these studies, each synthetically available DAG molecular species was quantified using the molecular species-selective SRM scan transitions as noted in Table 1 with corrections from the response line parameters shown in Table 1 (Figure 9, Panel A). For those DAG molecular species that are not commercially-available (e.g., no response parameters are available for these molecular species), their response has been normalized to the response for the SRM of the internal standard (Figure 9, Panel B). Collectively, data shown in panels A and B of Figure 9 indicate that both palmitic and oleic acid are incorporated into DAG molecular species in HCAEC supplemented with these two fatty acids.
Figure 8.
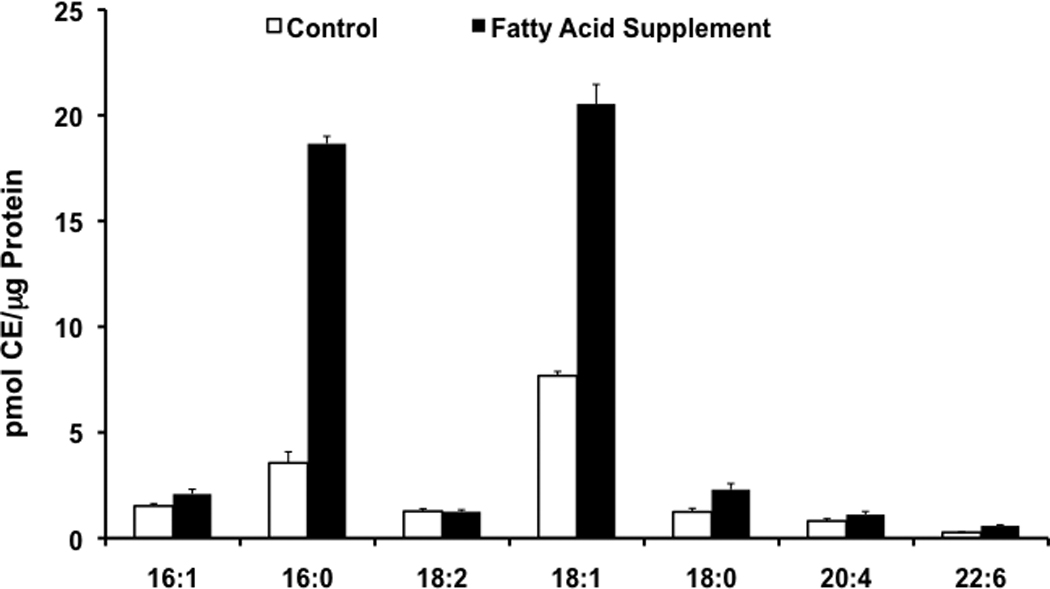
CEs in HCAEC. HCAEC were incubated for 24h with media in the presence (solid bars) and absence (open bars) of 200/100 µM palmitic/oleic acid. Lipid extracts from these cells were subsequently subjected to ESI-MS and lithiated adducts of individual molecular species of CE were quantified using neutral loss scans of 368.5 with 17:0 CE added as an internal standard as described in detail in “Materials and Methods”. Values are expressed as the mean + S.D.
Figure 9.
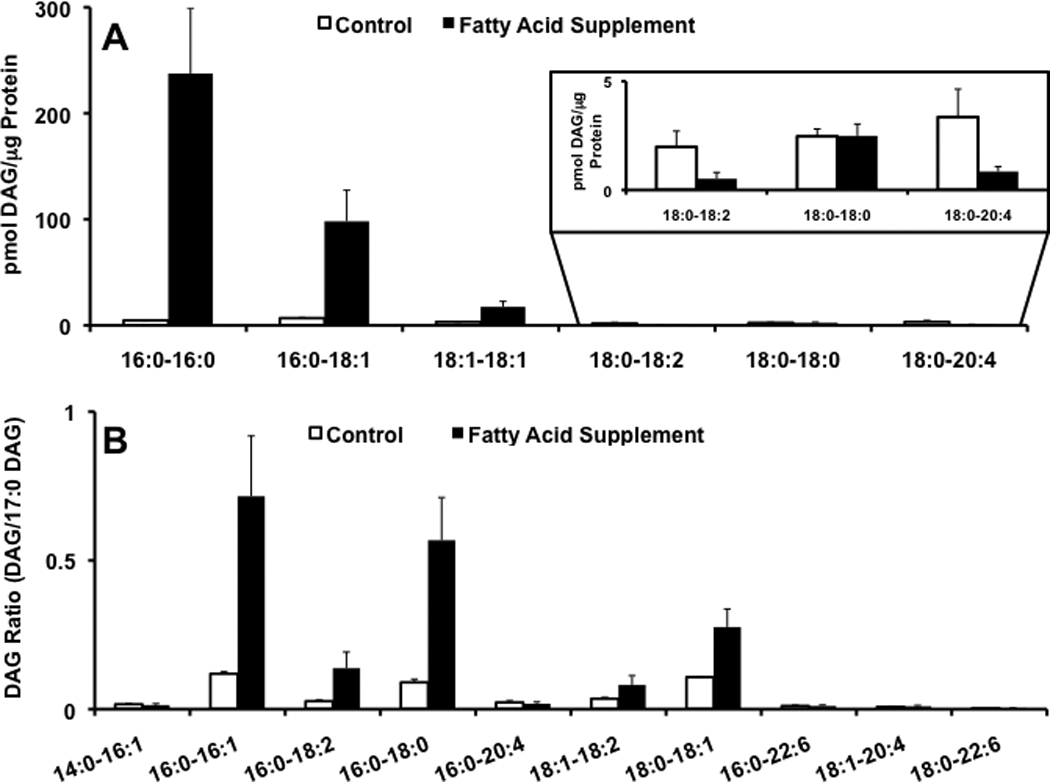
DAGs in HCAEC. HCAEC were incubated for 24h with media in the presence (solid bars) and absence (open bars) of 200/100 µM palmitic/oleic acid. Lipid extracts from these cells were subsequently subjected to ESI-MS and lithiated adducts of individual molecular species of DAG were quantified using specific SRMs and di-20:0 DAG as an internal standard as described in detail in “Materials and Methods”. The specific SRM transitions for each DAG molecular species are shown in Table 1. The calculated concentration of the lithiated 16:0–18:1 DAG molecular species was determined using the SRMs shown in Table 1 (indicated by *). Data shown in panel A is corrected with calibration constants (Table 1). Data shown in panel B is the SRM ion intensity of specified DAG molecular species normalized to the SRM ion intensity of the internal standard 20:0-20:0 DAG. Values are expressed as the mean + S.D.
Oxidation of unsaturated CE molecular species
One advantage of the neutral loss scan (NL 368.5) for CEs is that this mode can be used to rapidly identify alterations in the aliphatic chains esterified to CE. An examination of the oxidative species of 18:2 CE revealed oxidized species that included the incorporation of oxygen into the parent molecule with 14 and 16 amu increases in mass that likely reflect the formation of oxoODE and epoxide species, respectively[17, 40]. NL 368.5 scans of 18:2 CE exposed to ambient air for 6 and 15 h revealed increasing oxidation of the parent lithiated adduct of 18:2 CE (m/z 655.81) and the appearance of species enriched with one oxygen (m/z 669.84 and 671.84) and two oxygens (m/z 685.84 and 687.84) (Figure 10). Note that in these same analyses, 17:0 CE was added prior to ESI-MS analyses to allow relative comparisons of the parent 18:2 CE loss due to oxidation. In contrast, 18:0 CE does not undergo oxidation following exposure to ambient air over 6 and 15 h (Figure 10). This rapid analytical method has utility in assessing the oxidation of unsaturated molecular species of CEs that are added exogenously in experimental models. Furthermore, the fragmentation of specific species produced in vivo under oxidizing conditions could potentially be detected with this NL technique. However, coupling MS/MS detection, such as SRM, of specific oxidized CE species with HPLC should be superior in identifying oxidized species in vivo.
Figure 10.
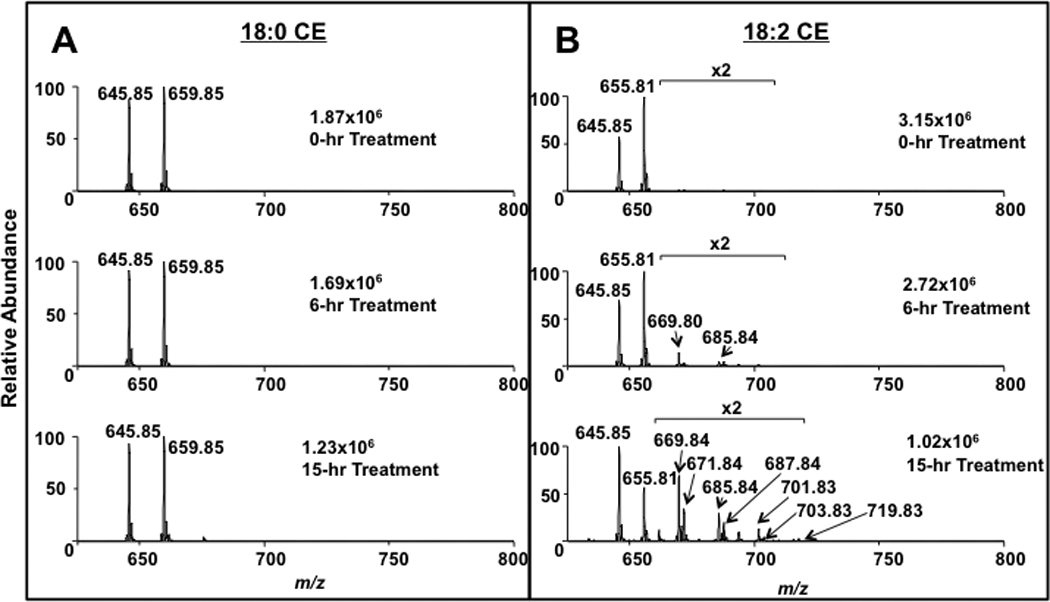
MS analyses of CE exposed to ambient air. CEs (18:0, A and 18:2, B) were exposed to ambient air for indicated intervals, and treatments were terminated by resuspending CEs in methanol/chloroform (4/1), which was subsequently subjected to direct-infusion ESI-MS analyses using neutral loss 368.5 scanning of lithiated adducts as described in “Materials and Methods”.
Discussion
CE and DAG molecular species have specific roles in biological systems. CE is an important intracellular and extracellular lipid storage pool with specific CE molecular species found within the core of circulating lipoproteins and within the core of intracellular lipid droplets[16, 17, 19]. DAG is an important branch point intermediate of glycerolipid synthesis, which can lead to either monoacylglycerol, triacylglycerol or phospholipid biosynthesis [6, 41, 42]. Furthermore, the coupling of receptor occupation with the activation of either specific phospholipase C or phospholipase D/phosphatidate phosphohydrolase enzyme systems leads to DAG production, which is critical in the activation of DAG-sensitive protein kinase C isozymes [43]. Accordingly, the development of specific analytical techniques to rapidly quantify CE and DAG molecular species by direct infusion-electrospray ionization mass spectrometry is needed. CE and DAG molecular species form relatively poor ions compared to polar lipids and fatty acids, which inherently form ions based on their lipid class-specific functional groups (e.g., carboxylic acids of fatty acids, and phosphate-containing polar head groups of the phospholipids) [2, 11]. Limited ionization of CEs and DAGs for mass spectrometric analyses has been circumvented by either derivatizing these lipids or forming adducts with these lipids to increase ion formation [2, 11, 44]. Two common cationic adducts employed for lipid analyses are ammoniated and so diated adducts. In particular, ammonium acetate has been used to create [M+NH4]+ ions of lipids using ESI-MS [28–30]. In the present study, comparisons of fragmentation of ammoniated and lithiated adducts of CE were made. Similar to findings of Liebisch and coworkers [29], as well as others [38, 39], the primary fragment of ammoniated adducts of CE were the cholestane cation. In comparison to the fragmentation of ammoniated adducts of CE, the lithiated adduct had an intense lithiated fatty acid fragment from the neutral loss of the cholestane residue. The finding that lithiated adducts yield enhanced fragmentation is similar to the enhanced fragmentation described by others using lithiated adducts for the analyses of several lipid classes[32–34]. The fragments of lithiated distearin included the lithiated fatty acid, and fragments from the loss of the fatty acid, the loss of the fatty acid and lithium and the loss of the fatty acid and water. In particular, the fragment from the loss of the fatty acid and lithium was especially useful for the specific detection of DAG molecular species. Taken together, lithiated adducts of CE molecular species can be uniformly detected by NL 368.5 scanning (loss of cholestane) and DAG molecular species can be detected by monitoring the loss of lithiated fatty acid residue from the parent ion (i.e. the use of specific SRMs).
One of the goals of this study was to develop an electrospray ionization MS/MS method that could resolve isobaric species such as those that occur in the m/z range that CE and DAG molecular species are present in a positive ion survey scan. These studies show that lithiated CE molecular species can be specifically quantitated using NL 368.5 scanning, while DAG molecular species are specifically quantitated using SRM transitions of the lithiated adducts of each DAG molecular species. As shown in Figure 4, CE molecular species with varying degrees of unsaturation have different ionization efficiencies. Like triacylglycerols, CEs have a weak dipole that is enhanced in the presence of lithium, but as previously observed in triacylglycerols, the dipole in CEs is dependent on the length and particularly the degree of unsaturation of the aliphatic group [2, 28, 29, 32]. Similarly, differences in ion intensities in the lithiated adducts of DAG were observed with minor increases in intensities of molecular species that have unsaturated aliphatic residues. Thus, individual calibration lines were generated for each CE and DAG molecular species to correct for disparate responses between the individual CE and DAG molecular species to that of the internal standards (17:0 CE and 20:0-20:0 DAG).
These analytical techniques were subsequently used to determine alterations in CE and DAG molecular species in human coronary artery endothelial cells (HCAEC) that were treated with physiological levels of saturated and unsaturated fatty acid (palmitic acid and oleic acid). The alterations in lipid metabolism in cells treated with fatty acids is of great interest since excess fatty acid has been associated with numerous disease states, including diabetes and heart disease [36, 45]. Furthermore, ex vivo cell culture studies indicate that specific fatty acids can be promoters of cell apoptosis. In particular, the treatment of cells with saturated fatty acids in elevated concentrations (high µM), such as 16:0 or 18:0, lead to cell apoptosis in certain cell types, which is likely due to the inability of cells to catabolize the saturated species [36, 45]. For example, it has previously been shown that HCAEC treated with saturated fatty acids results in a 5-fold increase in apoptosis [45]. However, treatments with unsaturated fatty acids, such as oleic acid, do not elicit cell apoptosis, but provide a protective effect that may involve shifting the incorporation of palmitic acid into triacylglycerol pools that also contain oleic acid residues [46, 47]. In the study herein, it was shown that two destinations of exogenously-applied fatty acids in the HCAECs are the CE and DAG pools. In the CE pool, supplementing HCAEC with palmitic acid and oleic acid led to an ~4- and 2-fold increase in the respective CE molecular species. Also, other CE molecular species did not significantly increase or decrease under the conditions that 16:0 CE and 18:1 CE increased. In comparison to storage of palmitic acid and oleic acid in CE species, there was approximately 3-fold more storage of these species in the DAG molecular species (predominantly 16:0-16:0 DAG and 16:0–18:1 DAG), and these species were increased over 10-fold compared to basal levels of these DAG molecular species in HCAEC that were not supplemented with palmitic acid and oleic acid. It is likely that the difference in storage of fatty acids in CE and DAG pools reflects the availability of cholesterol in these cells as well as potential remodeling of glycerolipids that would provide the glycerol backbone acceptor for the acyl CoA species.
The neutral loss 368.5 scan for cholesterol-containing esters is useful to rapidly detect multiple CE molecular species, and we subsequently used this technique to monitor the oxidation of polyunsaturated CE molecular species. Oxidation of polyunsaturated species is important in the food industry as these oxidized species contribute to the rancid nature of oxidized edible oils [48]. Furthermore, oxidized CE molecular species associated with lipoproteins are one contributing factor to the unregulated uptake of lipoproteins by macrophages leading to foam cell formation in early atherosclerotic fatty streaks [17, 40]. Data in this study further demonstrate the susceptibility of CE molecular species containing polyunsaturated fatty acids to oxidation. Further, the neutral loss technique can quantitatively be used to demonstrate loss of the CE molecular species to oxidation as well as the concomitant qualitative visualization of the oxidized products. These studies could be further expanded in the future to determine response curves for each of the oxidized species, to perform detailed analysis of the molecular structures of the oxidized species and to use LC/MS/MS techniques with SRMs of each of the oxidized species that is essential to quantify these oxidized species in biological tissues.
Electrospray ionization tandem mass spectrometry can be used to accurately quantify CE and DAG molecular species that without tandem mass spectrometry techniques are generally difficult to assess due to isobaric species. While it was somewhat surprising that lithiated adducts of CE molecular species had a predominant neutral loss of the cholestane fragment with a reduced cholestane cation present, this unique property was exploited with neutral loss scanning to detect all cholesterol esters including oxidized species. The SRM technique used for the limited DAG molecular species described in this study can be expanded to other DAG molecular species, but will require the synthesis of specific molecular species as many DAG molecular species containing unsaturated aliphatic residues that are not commercially available. The analytical methods employed hereinto measure CE and DAG molecular species can be readily adapted to the analyses of biological samples to assess these important lipid classes.
Acknowledgements
This research was supported by NIH grants HL074214, HL088073, HL098907 and RR019232 (DAF). The authors would also like to thank Dr. Robert J. Brown and Aaron Miller for their contributions to this manuscript.
Footnotes
Publisher's Disclaimer: This is a PDF file of an unedited manuscript that has been accepted for publication. As a service to our customers we are providing this early version of the manuscript. The manuscript will undergo copyediting, typesetting, and review of the resulting proof before it is published in its final citable form. Please note that during the production process errors may be discovered which could affect the content, and all legal disclaimers that apply to the journal pertain.
References
- 1.van Meer G, Voelker DR, Feingenson GW. Membrane lipids: Where they are and how they behave. Nat Rev Mol Cell Biol. 2008;9:112–124. doi: 10.1038/nrm2330. [DOI] [PMC free article] [PubMed] [Google Scholar]
- 2.Han X, Gross RW. Shotgun lipidomics: Electrospray ionization mass spectrometric analysis and quantitation of cellular lipidomes directly from crude extracts of biological samples. Mass Spectrom Rev. 2005;24:367–412. doi: 10.1002/mas.20023. [DOI] [PubMed] [Google Scholar]
- 3.Wenk MR. The emerging field of lipidomics. Nat Rev Drug Discov. 2005;4:594–610. doi: 10.1038/nrd1776. [DOI] [PubMed] [Google Scholar]
- 4.Brown MS, Ho YK, Goldstein JL. The cholesteryl ester cycle in macrophage foam cells. Continual hydrolysis and re-esterification of cytoplasmic cholesteryl esters. J Biol Chem. 1980;255:9344–9352. [PubMed] [Google Scholar]
- 5.Meng X, Zou D, Shi Z, Duan Z, Mao Z. Dietary diacylglycerol prevents high-fat diet-induced lipid accumulation in rat liver and abdominal adipose tissue. Lipids. 2004;39:37–41. doi: 10.1007/s11745-004-1199-1. [DOI] [PubMed] [Google Scholar]
- 6.Cases S, Smith SJ, Zheng Y-W, Myers HM, Lear SR, Sande E, Novak S, Collins C, Welch CB, Lusis AJ, Erickson SK, Farese RV. Identification of a gene encoding an acyl CoA:Diacylglycerol acyltransferase, a key enzyme in triacylglycerol synthesis. Proc Natl Acad Sci USA. 1998;95:13018–13023. doi: 10.1073/pnas.95.22.13018. [DOI] [PMC free article] [PubMed] [Google Scholar]
- 7.Pettitt TR, Martin A, Horton T, Liossis C, Lord JM, Wakelam MJO. Diacylglycerol and phosphatidate generated by phospholipases C and D, respectively, have distinct fatty acid compositions and functions. J Biol Chem. 1997;272:17354–17359. doi: 10.1074/jbc.272.28.17354. [DOI] [PubMed] [Google Scholar]
- 8.Ghosh S, Strum JC, Bell RM. Lipid biochemistry: Functions of glycerolipids and sphingolipids in cellular signaling. FASEB J. 1997;11:45–50. doi: 10.1096/fasebj.11.1.9034165. [DOI] [PubMed] [Google Scholar]
- 9.Madani S, Hichami A, Legrand A, Belleville J, Khan NA. Implication of acyl chain of diacylglycerols in activation of different isoforms of protein kinase C. FASEB J. 2001;15:2595–2601. doi: 10.1096/fj.01-0753int. [DOI] [PubMed] [Google Scholar]
- 10.Meier M, King GL. Protein kinase C activation and its pharmacological inhibition in vascular disease. Vasc Med. 2000;5:173–185. doi: 10.1177/1358836X0000500307. [DOI] [PubMed] [Google Scholar]
- 11.Li YL, Su X, Stahl PD, Gross ML. Quantification of diacylglycerol molecular species in biological samples by electrospray ionization mass spectrometry after one-step derivatization. Anal Chem. 2007;79:1569–1574. doi: 10.1021/ac0615910. [DOI] [PMC free article] [PubMed] [Google Scholar]
- 12.Schwartz CC, VandenBroek JM, Cooper PS. Lipoprotein cholesteryl ester production, transfer, and output in vivo in humans. J Lipid Res. 2004;45:1594–1607. doi: 10.1194/jlr.M300511-JLR200. [DOI] [PubMed] [Google Scholar]
- 13.Brown MS, Goldstein JL. The SREBP pathway: Regulation of cholesterol metabolism by proteolysis of a membrane-bound transcription factor. Cell. 1997;89:331–340. doi: 10.1016/s0092-8674(00)80213-5. [DOI] [PubMed] [Google Scholar]
- 14.Francone OL, Gurakar A, Fielding C. Distribution and functions of lecithin:Cholesterol acyltransferase and cholesteryl ester transfer protein in plasma lipoproteins. Evidence for a functional unit containing these activities together with apolipoproteins A–I and D that catalyzes the esterification and transfer of cell-derived cholesterol. J Biol Chem. 1989;264:7066–7072. [PubMed] [Google Scholar]
- 15.Suckling KE, Stange EF. Role of acyl-CoA: Cholesterol acyltransferase in cellular cholesterol metabolism. J Lipid Res. 1985;26:647–671. [PubMed] [Google Scholar]
- 16.Brecher PI, Chobanian AV. Cholesteryl ester synthesis in normal and atherosclerotic aortas of rabbits and rhesus monkeys. Circ Res. 1974;35:692–701. doi: 10.1161/01.res.35.5.692. [DOI] [PubMed] [Google Scholar]
- 17.Harkewicz R, Hartvigsen K, Almazan F, Dennis EA, Witztum JL, Miller YI. Cholesteryl ester hydroperoxides are biologically active components of minimally oxidized low density lipoprotein. J Biol Chem. 2008;283:10241–10251. doi: 10.1074/jbc.M709006200. [DOI] [PMC free article] [PubMed] [Google Scholar]
- 18.Tosi MR, Bottura G, Lucchi P, Reggiani A, Trinchero A, Tugnoli V. Cholesteryl esters in human malignant neoplasms. Int J Mol Med. 2003;11:95–98. doi: 10.3892/ijmm.11.1.95. [DOI] [PubMed] [Google Scholar]
- 19.Mahlberg FH, Glick JM, Jerome WG, Rothblat GH. Metabolism of cholesteryl ester lipid droplets in a J774 macrophage foam cell model. Biochim Biophys Acta. 1990;1045:291–298. doi: 10.1016/0005-2760(90)90133-i. [DOI] [PubMed] [Google Scholar]
- 20.Zock PL, Mensink RP, Harryvan J, de Vries JHM, Katan MB. Fatty acids in serum cholesteryl esters as quantitative biomarkers of dietary intake in humans. Am J Epidemiol. 1997;145:1114–1122. doi: 10.1093/oxfordjournals.aje.a009074. [DOI] [PubMed] [Google Scholar]
- 21.Murphy RC, Fiedler J, Hevko J. Analysis of nonvolatile lipids by mass spectrometry. Chem Rev. 2001;101:479–526. doi: 10.1021/cr9900883. [DOI] [PubMed] [Google Scholar]
- 22.Hubbard WC, Hundley TR, Oriente A, MacGlashan JDW. Quantitation of 1-stearoyl-2-arachidonoyl-sn-3-glycerol in human basophils via gas chromatography-negative ion chemical ionization mass spectrometry. Anal Biochem. 1996;236:309–321. doi: 10.1006/abio.1996.0172. [DOI] [PubMed] [Google Scholar]
- 23.Murphy RC. Handbook of lipid research: Mass spectrometry of lipids. New York: Plenum Press; 1993. [Google Scholar]
- 24.Tserng K-Y, Griffin R. Quantitation and molecular species determination of diacylglycerols, phosphatidylcholines, ceramides, and sphingomyelins with gas chromatography. Anal Biochem. 2003;323:84–93. doi: 10.1016/j.ab.2003.08.026. [DOI] [PubMed] [Google Scholar]
- 25.Evershed RP, Goad LJ. Capillary gas chromatography/mass spectrometry of cholesteryl esters with negative ammonia chemical ionization. Biol Mass Spectrom. 1987;14:131–140. doi: 10.1002/bms.1200140307. [DOI] [PubMed] [Google Scholar]
- 26.Falardeau P, Robillard M, Hui R. Quantification of diacylglycerols by capillary gas chromatography-negative ion chemical ionization-mass spectrometry. Analytical Biochemistry. 1993;208:311–316. doi: 10.1006/abio.1993.1052. [DOI] [PubMed] [Google Scholar]
- 27.Schiller J, Süß R, Arnhold J, Fuchs B, Leßig J, Müller M, Petkovic M, Spalteholz H, Zschörnig O, Arnold K. Matrix-assisted laser desorption and ionization time-of-flight (MALDI-TOF) mass spectrmetry in lipid and phospholipid research. Prog Lipid Res. 2004;43:449–488. doi: 10.1016/j.plipres.2004.08.001. [DOI] [PubMed] [Google Scholar]
- 28.Hutchins PM, Barkley RM, Murphy RC. Separation of cellular nonpolar neutral lipids by normal-phase chromatography and analysis by electrospray ionization mass spectrometry. J. Lipid Res. 2008;49:804–813. doi: 10.1194/jlr.M700521-JLR200. [DOI] [PMC free article] [PubMed] [Google Scholar]
- 29.Liebisch G, Binder M, Schifferer R, Langmann T, Schulz B, Schmitz G. High throughput quantification of cholesterol and cholesteryl ester by electrospray ionization tandem mass spectrometry (ESI-MS/MS) Biochim Biophys Acta. 2006;1761:121–128. doi: 10.1016/j.bbalip.2005.12.007. [DOI] [PubMed] [Google Scholar]
- 30.Murphy RC, James PF, McAnoy AM, Krank J, Duchoslav E, Barkley RM. Detection of the abundance of diacylglycerol and triacylglycerol molecular species in cells using neutral loss mass spectrometry. Anal Biochem. 2007;366:59–70. doi: 10.1016/j.ab.2007.03.012. [DOI] [PMC free article] [PubMed] [Google Scholar]
- 31.Duffin KL, Henion JD, Shieh JJ. Electrospray and tandem mass spectrometric characterization of acylglycerol mixtures that are dissolved in nonpolar solvents. Anal Chem. 1991;63:1781–1788. doi: 10.1021/ac00017a023. [DOI] [PubMed] [Google Scholar]
- 32.Han X, Gross RW. Quantitative analysis and molecular species fingerprinting of triacylglyceride molecular species directly from lipid extracts of biological samples by electrospray ionization tandem mass spectrometry. Anal Biochem. 2001;295:88–100. doi: 10.1006/abio.2001.5178. [DOI] [PubMed] [Google Scholar]
- 33.Hsu F-F, Turk J. Structural characterization of triacylglycerols as lithiated adducts by electrospray ionization mass spectrometry using low-energy collisionally activated dissociation on a triple stage quadrupole instrument. J Am Soc Mass Spectrom. 1999;10:587–599. doi: 10.1016/S1044-0305(99)00035-5. [DOI] [PubMed] [Google Scholar]
- 34.Hsu FF, Bohrer A, Turk J. Formation of lithiated adducts of glycerophosphocholine lipids facilitates their identification by electrospray ionization tandem mass spectrometry. J Am Soc Mass Spectrom. 1998;9:516–526. doi: 10.1016/S1044-0305(98)00012-9. [DOI] [PubMed] [Google Scholar]
- 35.Ford DA, Gross RW. Differential metabolism of diradyl glycerol molecular subclasses and molecular species by rabbit brain diglyceride kinase. J Biol Chem. 1990;265:12280–12286. [PubMed] [Google Scholar]
- 36.Listenberger LL, Ory DS, Schaffer JE. Palmitate-induced apoptosis can occur through a ceramide-independent pathway. J Biol Chem. 2001;276:14890–14895. doi: 10.1074/jbc.M010286200. [DOI] [PubMed] [Google Scholar]
- 37.Bligh EG, Dyer WJ. A rapid method of total lipid extraction and purification. Can J Biochem Physiol. 1959;37:911–917. doi: 10.1139/o59-099. [DOI] [PubMed] [Google Scholar]
- 38.Duffin K, Obukowicz M, Raz A, Shieh JJ. Electrospray/tandem mass spectrometry for quantitative analysis of lipid remodeling in essential fatty acid deficient mice. Anal Biochem. 2000;279:179–188. doi: 10.1006/abio.1999.4452. [DOI] [PubMed] [Google Scholar]
- 39.Kalo P, Kuuranne T. Analysis of free and esterified sterols in fats and oils by flash chromatography, gas chromatography and electrospray tandem mass spectrometry. J Chromatogr A. 2001;935:237–248. doi: 10.1016/s0021-9673(01)01315-2. [DOI] [PubMed] [Google Scholar]
- 40.Fang L, Harkewicz R, Hartvigsen K, Wiesner P, Choi S-H, Almazan F, Pattison J, Deer E, Sayaphupha T, Dennis EA, Witztum JL, Tsimikas S, Miller YI. Oxidized cholesteryl esters and phospholipids in zebrafish larvae fed a high cholesterol diet. J Biol Chem. 2010;285:32343–32351. doi: 10.1074/jbc.M110.137257. [DOI] [PMC free article] [PubMed] [Google Scholar]
- 41.Kanoh H, Ohno K. Substrate-selectivity of rat liver microsomal 1,2-diacylglycerol: CDP-choline(ethanolamine) choline(ethanolamine)phosphotransferase in utilizing endogenous substrates. Biochim Biophys Acta. 1975;380:199–207. [PubMed] [Google Scholar]
- 42.Kennerly DA. Diacylglycerol metabolism in mast cells. Analysis of lipid metabolic pathways using molecular species analysis of intermediates. J Biol Chem. 1987;262:16305–16313. [PubMed] [Google Scholar]
- 43.Nishizuka Y. Protein kinase C and lipid signaling for sustained cellular responses. FASEB J. 1995;9:484–496. [PubMed] [Google Scholar]
- 44.Hashidate T, Itabashi Y. Electrospray ionization mass spectrometry of regioisomeric 1,2-diacylglycerols. Bunseki Kagaku. 2005;54:807–816. [Google Scholar]
- 45.Staiger K, Staiger H, Weigert C, Haas C, Häring H-U, Kellerer M. Saturated, but not unsaturated, fatty acids induce apoptosis of human coronary artery endothelial cells via nuclear factor-κB activation. Diabetes. 2006;55:3121–3126. doi: 10.2337/db06-0188. [DOI] [PubMed] [Google Scholar]
- 46.de Vries JE, Vork MM, Roemen TH, de Jong YF, Cleutjens JP, van der Vusse GJ, van Bilsen M. Saturated but not mono-unsaturated fatty acids induce apoptotic cell death in neonatal rat ventricular myocytes. J Lipid Res. 1997;38:1384–1394. [PubMed] [Google Scholar]
- 47.Listenberger LL, Han X, Lewis SE, Cases S, Farese RV, Jr, Ory DS, Schaffer JE. Triglyceride accumulation protects against fatty acid-induced lipotoxicity. Proc Natl Acad Sci USA. 2003;100:3077–3082. doi: 10.1073/pnas.0630588100. [DOI] [PMC free article] [PubMed] [Google Scholar]
- 48.German JB. Food processing and lipid oxidation. Adv Exp Med Biol. 1999;459:23–50. doi: 10.1007/978-1-4615-4853-9_3. [DOI] [PubMed] [Google Scholar]