Abstract
Bursting electrical activity is ubiquitous in excitable cells such as neurons and many endocrine cells. The technique of fast/slow analysis, which takes advantage of time scale differences, is typically used to analyze the dynamics of bursting in mathematical models. Two classes of bursting oscillations that have been identified with this technique, plateau and pseudo- plateau bursting, are often observed in neurons and endocrine cells, respectively. These two types of bursting have very different properties and likely serve different functions. This latter point is supported by the divergent expression of the bursting patterns into different cell types, and raises the question of whether it is even possible for a model for one type of cell to produce bursting of the type seen in the other type without large changes to the model. Using fast/slow analysis, we show here that this is possible, and we provide a procedure for achieving this transition. This suggests that the design principles for bursting in endocrine cells are just quantitative variations of those for bursting in neurons.
Keywords: Bursting, Pituitary cells, Islets, Calcium, Mathematical model
1 Introduction
Neurons and endocrine cells display various patterns of electrical activity, spontaneously or in response to stimulation. One of these patterns, periodic bursting, is characterized by periods of fast spiking activity separated by periods of rest. The alternation between these two phases of activity is often controlled by the slow variation of the intracellular calcium concentration. Bursts may allow more efficient neurotransmitter or hormone release than single spikes, without causing as much fatigue or desensitization as continuous spiking. In endocrine cells, the characteristics of the bursting pattern, such as the burst duration or the burst frequency, determine how much Ca2+ enters the cell and in turn determines the level of hormone secretion (Van Goor et al., 2001b).
The spontaneous electrical activity of several anterior pituitary cell types (somatotrophs, lactotrophs, corticotrophs) and pancreatic β-cells isolated from islets have been shown to consist of bursts produced by the opening of voltage-dependent Ca2+ channels (Van Goor et al., 2001b; Stojilkovic et al., 2005; Zhang et al., 2003). Unlike bursts in neurons and β-cells within intact pancreatic islets of Langerhans, the active phase of the bursts exhibits small oscillations around a depolarized voltage, not full blown spikes. Recent models have explained this characteristic feature mathematically: the fast-subsystem bifurcation structure has a bistable region which has, in addition to the standard hyperpolarized stable steady state, a depolarized stable steady state (LeBeau et al., 1998; Tabak et al., 2007; Tsaneva-Atanasova et al., 2007). This is in contrast to models of conventional or plateau bursting, which have a stable oscillatory solution or limit cycle in place of the depolarized steady state (Rinzel, 1987). For this reason these bursts are called pseudo-plateau bursts.
The properties of pseudo-plateau bursting are quite different from those of plateau bursting, likely leading to differences in function. For example, the large amplitude, short duration spikes characteristic of plateau bursting would be effective at evoking neurotransmitter release, since low affinity release sites are clustered near Ca2+ channels in synapses and the large depolarization opens the channels. The resulting high-concentration Ca2+ nanodomain then evokes the transmitter release. In contrast, there is no such colocalization of release sites and Ca2+ channels in endocrine cells, and release is evoked by a more spatially averaged Ca2+ signal. Pseudo-plateau bursting is more effective at producing an elevated average Ca2+ concentration than is continuous spiking (Tabak et al., 2007; Van Goor et al., 2001a); the large spikes of plateau bursts are not required.
Given the different characteristics of the two types of bursting, and their divergent distribution into two cell types, it seems likely that the dynamic mechanism for one type of bursting is insufficiently plastic to produce the other type of bursting. Mathematical models of the two bursting types are an ideal platform to investigate the validity of this assertion. Our goal is to determine whether a model for one type of bursting can produce the other type without major structural changes, and if so, to determine the key elements of such a transition. Izhikevich (2000) showed that the same model can produce both types of bursting, but the changes required to make such a transition were not discussed and, importantly, the key elements for the production of one type of bursting versus the other were not investigated.
To understand the conditions that create pseudo-plateau bursting, we start with a well known model of bursting in pancreatic islets, the Chay-Keizer model (Chay and Keizer, 1983), which produces plateau bursting. We show that by changing the values of an appropriate time constant or the half-activation point of the fast, voltage-dependent K+ or Ca2+ channels a transition can be made between a plateau and a pseudo-plateau bifurcation structure. We observe similar transitions by varying the maximum conductances of these currents, which is important since conductance variation is more likely to occur from one cell to another or one cell type to another. We demonstrate that the effects of these parameter changes are additive, so there are many pathways through parameter space between plateau and pseudo-plateau bursting. These results suggest that the relationship between the fast K+ and Ca2+ currents determines the burst type. More generally, the analysis suggests that the design principles for bursting are similar between neurons and endocrine cells.
2 The Chay-Keizer model
The Chay-Keizer model (Chay and Keizer, 1983) is the first model developed for pancreatic islet electrical activity and has similar structure to most subsequent models. The numerical simulation of this model produces a plateau bursting pattern. Here, we use a modification of the Chay-Keizer model that has fewer variables (Bertram and Sherman, 2004, 2005). There are differential equations for three variables: V (membrane potential), n (fraction of activated delayed rectifier K+ channels), and c (cytosolic free Ca2+ concentration). The equations are:
| (1) |
| (2) |
| (3) |
where Cm is the membrane capacitance of the cell, ICa is an inward Ca2+ current, IK is an outward delayed rectifying K+ current, IK(Ca) is a Ca2+-activated K+ current, IK(ATP) is an ATP-sensitive K+ current, τn is the activation time constant for the delayed rectifier K+ channel, f is the fraction of cytosolic Ca2+ that is not bound to buffers (ratio of free to total Ca2+ in the cell), α converts current into concentration flux and involves the ratio of the cell’s surface area to volume of the cytosol, and kPMCA is the rate of Ca2+ extrusion from the cell (the pump rate). The currents in the equations above are:
| (4) |
| (5) |
| (6) |
| (7) |
The steady state activation functions are given by;
| (8) |
| (9) |
| (10) |
where m∞ is the steady state activation function for ICa, n∞ is the steady state activation function for n, and s∞ is the fraction of K(Ca) channels activated by cytosolic Ca2+. These range from 0 to 1. The parameters gK, gK(ATP), gCa, and gK(Ca) are maximum conductance for the different channel types. Parameters VK and VCa are Nernst potentials for K+ and Ca2+, respectively. Parameters υm and υn are the voltage values where m∞ and n∞ are at their half- maximum values. Parameters sm and sn set the slopes of the sigmoidal m∞ and n∞ curves, respectively. Finally, Kd is the dissociation constant for Ca2+ binding to the K(Ca) channel. Default parameter values are given in Table 1.
Table 1.
Parameter values for the Chay-Keizer model.
| Parameter | Value |
|---|---|
| gCa | 1000 pS |
| gK(Ca) | 400 pS |
| VCa | 25 mV |
| Cm | 5300 fF |
| τn | 18.7 ms |
| kPMCA | 0.5 ms−1 |
| vn | −16 mV |
| vm | −20 mV |
| gK | 2700 pS |
| gK(ATP) | 180 pS |
| VK | −75 mV |
| α | 4.5 × 10⁻⁶ fA−1 µM ms−1 |
| f | 0.00025 |
| Kd | 0.3 µ M |
| sn | 5 mV |
| sm | 12 mV |
The variables V and n change much more rapidly than the c variable. The V time scale is given by τV = Cm/gTotal, where gTotal = gKn+gK(ATP) +gCam∞(V)+gK(Ca)s∞(c). During a plateau bursting oscillation, the minimum of gTotal is 217 pS and the maximum is 900 pS. Thus, 6 ms ≤ τV ≤ 24 ms. The time constant for n is τn = 20 ms. For the slow variable c, the time constant is . For f = 0.01 (we will use this value of f later), , and c is still slower than V and n. Thus, the V and n variables make up the fast subsystem and the c variable forms the slow subsystem. In the analysis that follows we make use of this separation of time scales to analyze the plateau bursting and pseudo-plateau bursting oscillations. This geometric singular perturbation, or fast/slow, analysis was developed by Rinzel (Rinzel, 1987) and is typically used to analyze bursting oscillations (Bertram and Sherman, 2005; Izhikevich, 2000)).
All simulations and bifurcation diagrams are constructed using the XPPAUT software package (Ermentrout, 2002) and computer codes can be downloaded from the following website: http://www.math.fsu.edu/bertram/software/islet. Both one- and two-parameter bifurcation digrams were constructed using the parameter continuation tool AUTO in XPPAUT.
3 Results
3.1 Transition from plateau to pseudo-plateau bursting with a plateau bursting model
3.1.1 Fast/slow analysis
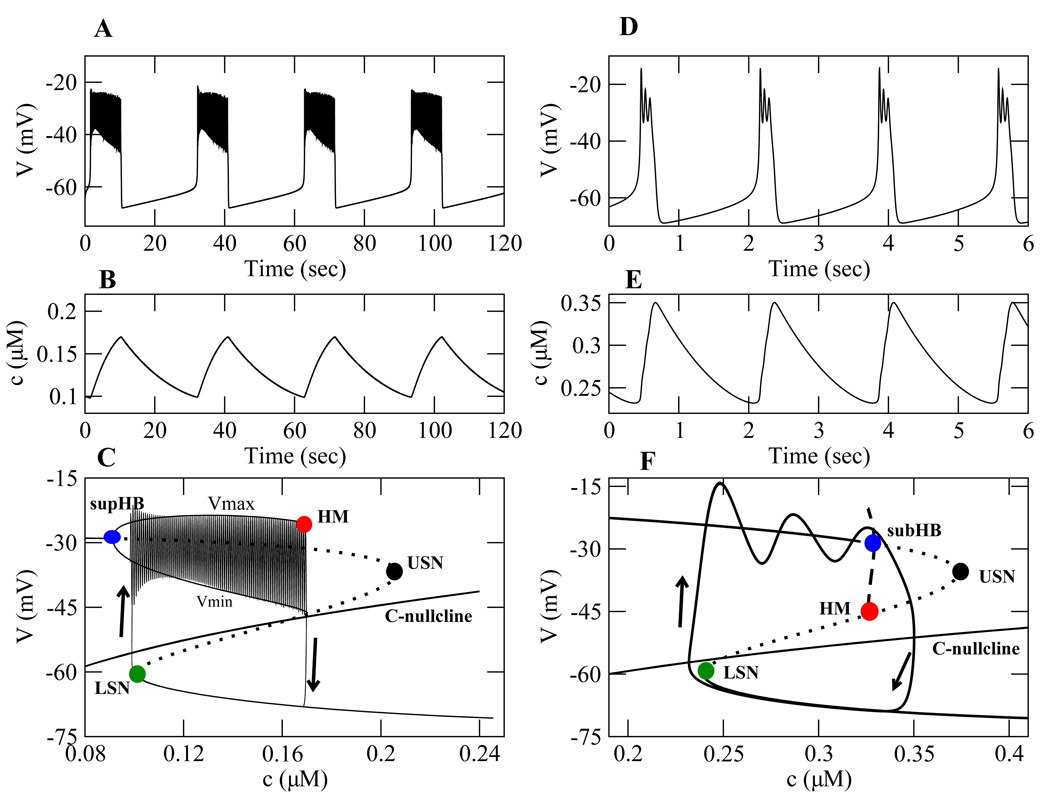
With the default parameter values, Table 1, the Chay-Keizer model produces a plateau bursting pattern (Fig. 1A). This periodic pattern has two phases: an active phase and a silent phase. During the active phase, action potentials or spikes emerge from a depolarized voltage plateau. During the silent phase, the model cell is at a low voltage or hyperpolarized state. During the active phase, Ca2+ channels open and c increases (Fig. 1B). The elevated c activates the Ca2+-dependent K+ channels (K(Ca) channels), which terminate the spiking and hyperpolarize the cell. During the silent phase, the Ca2+ channels close and c declines (Fig. 1B). This deactivates the K(Ca) channels and allows the cell to reach the spike threshold, initiating a new active phase. The fast subsystem is bistable over a range of c values, where for the same value of c the model cell could be either spiking or silent.
Figure 1.
Bursting oscillations and bifurcation structures for plateau bursting (left) simulated using the Chay-Keizer model, and pseudo-plateau bursting (right) simulated using a model for pituitary lactotrophs (Tabak et al., 2007) with υn = −9.5 mV. (A) plateau bursting oscillations. (B) Slow dynamics of Ca2+ concentration. (C) The fast/slow analysis. (D) Pseudo-plateau bursting oscillations. (E) Ca2+ dynamics are faster than in plateau bursting, producing a much shorter burst period. (F) The fast/slow analysis. In panels C and F, LSN, USN, and HM are lower saddle-node, upper saddle-node and homoclinic bifurcations, respectively. The Hopf bifurcations are supHB (supercritical) in panel C and subHB (subcritical) in panel F. Vmax and Vmin correspond to the maximum and minimum voltage of the fast subsystem periodic solution for a range of c values. Default parameter values are used for both models, with f = 0.00025 for plateau and f = 0.01 for pseudo-plateau bursting.
A model for pituitary lactotrophs (Tabak et al., 2007) produces pseudo-plateau bursting (see Section 3.3.1). In this model, bursting is generated due to a fast-activating BK-type (large conductance) K+ current. Pseudo-plateau bursting (Fig. 1D) typically has a shorter period than plateau bursting and fewer spikes during the active phase. These spikes may be considerably smaller than in plateau bursting, although this is not required. The Ca2+ concentration profiles (Fig. 1E), with c increasing during the active phase and decreasing during the silent phase, are similar in the two types of bursting.
From the point of view of the underlying dynamics, there are two main differences between the bursting types. One is that the slow variable, c in our example, is considerably faster in pseudo-plateau than in plateau bursting. In the cells, this difference could reflect differences in cell volumes, buffering capacity of the cell, Ca2+ current conductance, or Ca2+ pump rate. The simplest way to vary the speed of c is through the parameter f, the fraction of Ca2+ that is unbound by buffers. A larger f value yields faster variation in c. The second main difference is in the bifurcation structure of the fast subsystem.
As stated earlier, c varies more slowly than V and n. In the fast/slow analysis, c is treated as a parameter of the fast subsystem ((1)–(2)). A bifurcation diagram is then constructed for the fast subsystem dynamics using c as the bifurcation parameter (Rinzel, 1987). Figure 1C illustrates the bifurcation structure for plateau bursting. In the figure, the z-shaped curve (”z-curve”) represents the steady states of the fast subsystem. The lower branch of the z-curve consists of stable nodes corresponding to the hyperpolarized (low-voltage) steady states. The middle branch consists of (unstable) saddle points. The upper branch corresponds to the depolarized (high-voltage) steady states, and has unstable and stable portions. The turning points connecting the three stationary branches are a lower saddle-node bifurcation (LSN) and an upper saddle-node bifurcation (USN). The upper branch changes from stable to unstable at a supercritical Hopf bifurcation (supHB), which occurs to the left of the LSN. Thus, for a range of c values there are three steady states of the fast subsystem, but only one is stable.
A branch of stable periodic solutions emerges from supHB and terminates at a homoclinic bifurcation (HM). At HM, there is an infinite-period homoclinic orbit where the periodic solution connects with a saddle point. For a range of c values, between LSN and HM, the system is bistable between a low-voltage stable steady state and a stable limit cycle (Fig. 1C). This bistability is crucial for the production of bursting with a single slow variable (Bertram and Sherman, 2005). On the limit cycle, Vmax and Vmin represent the maximum and minimum voltage of the periodic solution, respectively.
We now treat the c-V plane (Fig. 1C) as a phase plane with the z-curve as a generalized V-nullcline projected into the V-c plane. We also project the c-nullcline where dc/dt = 0. Below the c-nullcline dc/dt < 0, so the flow is to the left. A phase point starting on the lower branch of the z-curve moves leftward towards the LSN. Once the LSN is reached, the phase point moves to the only remaining stable structure, the branch of periodic (spiking) solutions. At this time, the phase point is above the c-nullcline and the flow is to the right since dc/dt > 0. The phase point oscillates as it travels rightward towards the HM, and once the HM is reached the phase point returns to the lower stationary branch of the z-curve. This sequence of events describes one period of the bursting oscillation. In Fig. 1C, the superimposed burst trajectory shows this one cycle of bursting.
The fast subsystem bifurcation structure for pseudo-plateau bursting is shown in Fig. 1E. The primary difference between this diagram and that for plateau bursting is that the stable periodic branch is gone, due to stabilization of the upper branch of the z-curve. The stabilized stationary branch ultimately loses stability at a subcritical Hopf bifurcation (subHB), but over a wide range of c values the system is bistable between two steady states. The only branch of periodic solutions is unstable, emerging from the subHB and terminating at a HM.
Now using the c-V plane as a phase plane, we add the c-nullcline and the burst trajectory. Since the c dynamics are only marginally slow, the phase point only loosely follows the lower branch of the z-curve, and it overshoots the LSN. Once it passes the LSN, the phase point is attracted to the upper branch of the z-curve, but the attraction is weak. This results in transient oscillations around the upper branch of the z-curve. Once the phase point moves past the subHB, it returns to the lower branch of the z-curve. Thus, as with plateau bursting, the silent phase is characterized by flow along the bottom branch of the z-curve. However, unlike plateau bursting, the active phase is a weakly damped oscillation around a depolarized steady state (Fig. 1F).
3.1.2 Plateau to pseudo-plateau conversion by actions on the delayed rectifier K+ current
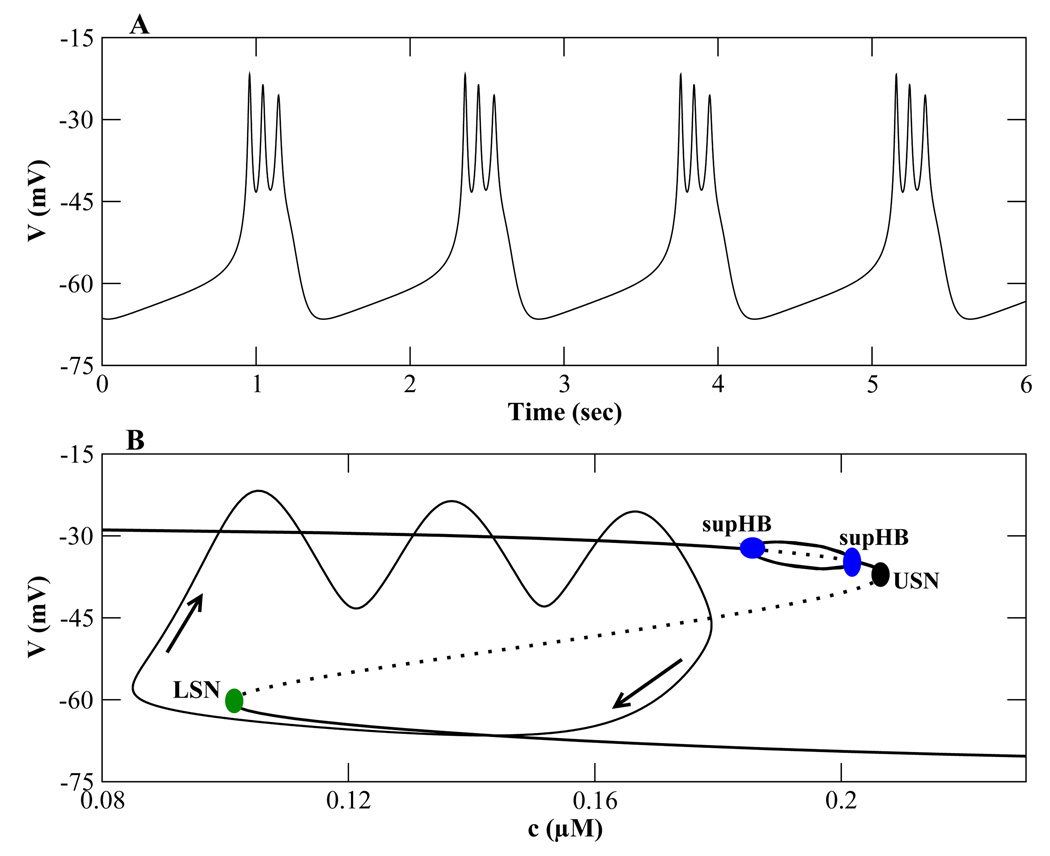
Can the plateau bursting of Fig. 1A produced by the Chay-Keizer model be converted to pseudo-plateau bursting? If so, what parameter can convert the fast-subsystem bifurcation structure for plateau bursting (Fig. 1C) to that for pseudo-plateau bursting (Fig. 1F)? One potential approach is to decrease the time constant for the K+ channel activation variable n (τn in Eq. (2)). In so doing, this negative feedback is accelerated, which eliminates spiking and stabilizes the top branch of the z-curve (Bertram et al., 1995). This modification to the Chay-Keizer model leads to the desired pseudo-plateau bursting pattern (Fig. 2A).
Figure 2.
Pseudo-plateau bursting generated with the Chay-Keizer model by increasing the speed of K+ current activation. (A) When τn is decreased to 17.1 ms and f is increased to 0.01, pseudo-plateau bursting is produced. (B) The fast-subsystem bifurcation structure, in which the upper branch is stabilized. There are two supercritical Hopf bifurcations connected by a branch of stable periodic solutions, which differs from Fig. 1F.
While decreasing τn successfully produced pseudo-plateau bursting, the bifurcation structure of the fast subsystem (Fig. 2B) is somewhat different from that of Fig. 1F. In particular there are a pair of supercritical Hopf bifurcations, rather than a single subcritical Hopf bifurcation on the top branch. While this difference has little, if any, effect on the burst trajectory, it suggests that a different approach to pseudo-plateau bursting would be more appropriate.
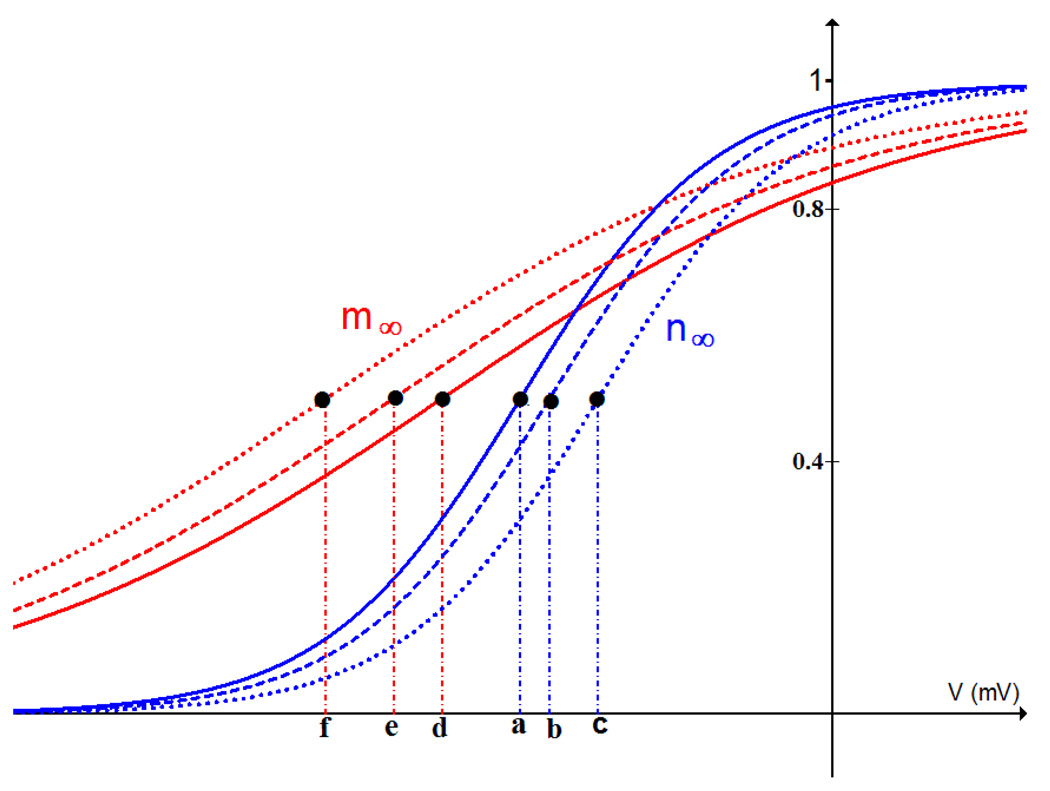
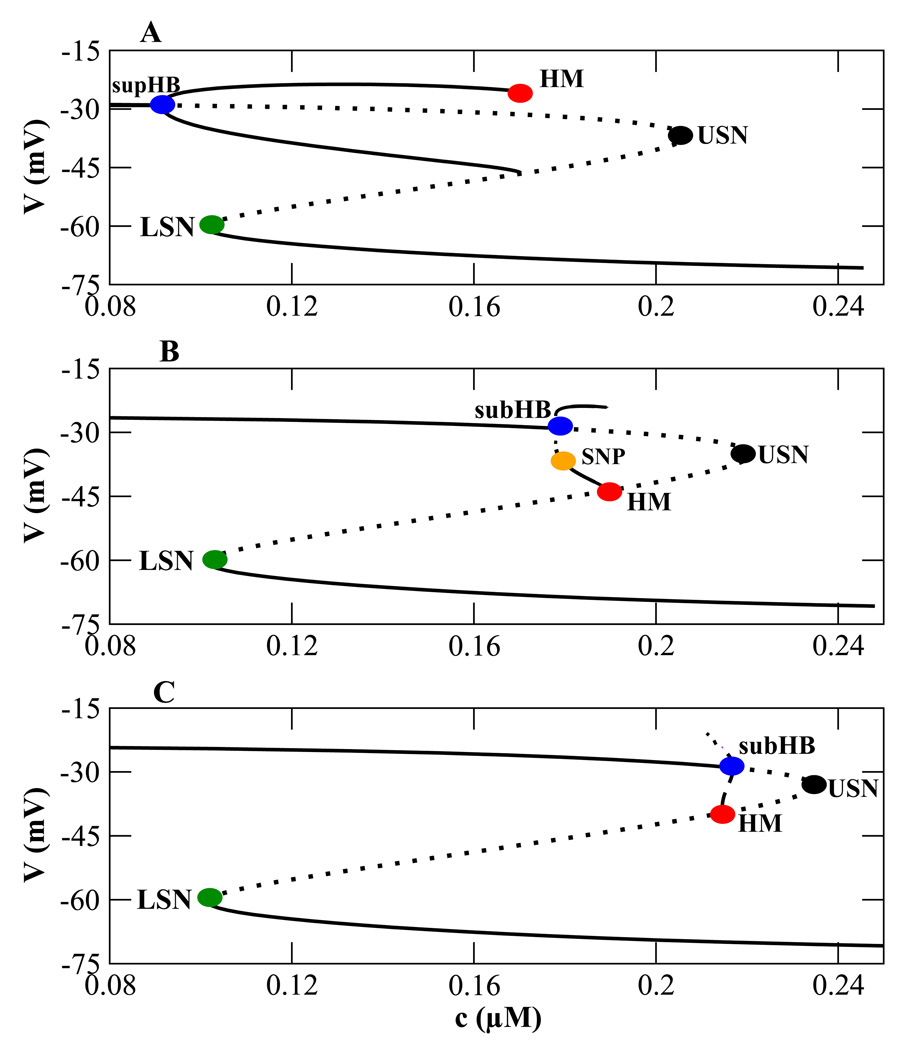
How else might pseudo-plateau bursting be achieved? One potential mechanism is to shift the activation curve for n, so that the delayed rectifier current activates at higher voltages. This is done by increasing the parameter υn (voltage value at the midpoint of n∞), which shifts the n∞(V) curve (Fig. 3, the blue solid curve) rightward. When υn is increased from −16 mV to −14 mV there is a stabilization of the upper branch of the z-curve (Fig. 4B). The supercritical Hopf bifurcation characteristic of plateau bursting (Fig. 4A) has moved to the right of the LSN and has become subcritical (Fig. 4B). The unstable periodic branch that emerges gains stability at a saddle-node of periodics (SNP) bifurcation, and the stabilized periodic branch terminates at a HM bifurcation.
Figure 3.
Steady state functions for the K+ current activation variable n (the n∞ (V) curve, blue) and the Ca2+ current activation variable m (the m∞ curve, red). When υn is increased from −16 mV (point a) to −14.5 mV (point b) or −12 mV (point c), the n∞ curve shifts to the right. This makes the delayed rectifier channels activate at higher voltages. When υm is decreased from −20 mV (point d) to −22.5 mV (point e) or −26 mV (point f), the m∞ curve shifts to the left. This makes the Ca2+ channels activate at lower voltages. When the m∞ and n∞ curves are sufficiently far apart, pseudo-plateau bursting is produced.
Figure 4.
Effects of shifting the n∞(V) curve rightward. (A) The bifurcation structure for plateau bursting using default values (Table 1). (B) A transitional bifurcation structure obtained by increasing υn to −14 mV. (C) The bifurcation structure for pseudo-plateau bursting obtained with υn = −12 mV.
The bifurcation structure in Fig. 4B is transitional between that of plateau bursting (Fig. 4A) and that of pseudo-plateau bursting (Fig. 4C) which is achieved by shifting n∞(V) further to the right (Fig. 3, blue doted curve) by increasing υn to −12 mV (point c in Fig. 3). This produces a fast subsystem bifurcation diagram that is identical to that of pseudo-plateau bursting from the lactotroph model (Tabak et al., 2007).
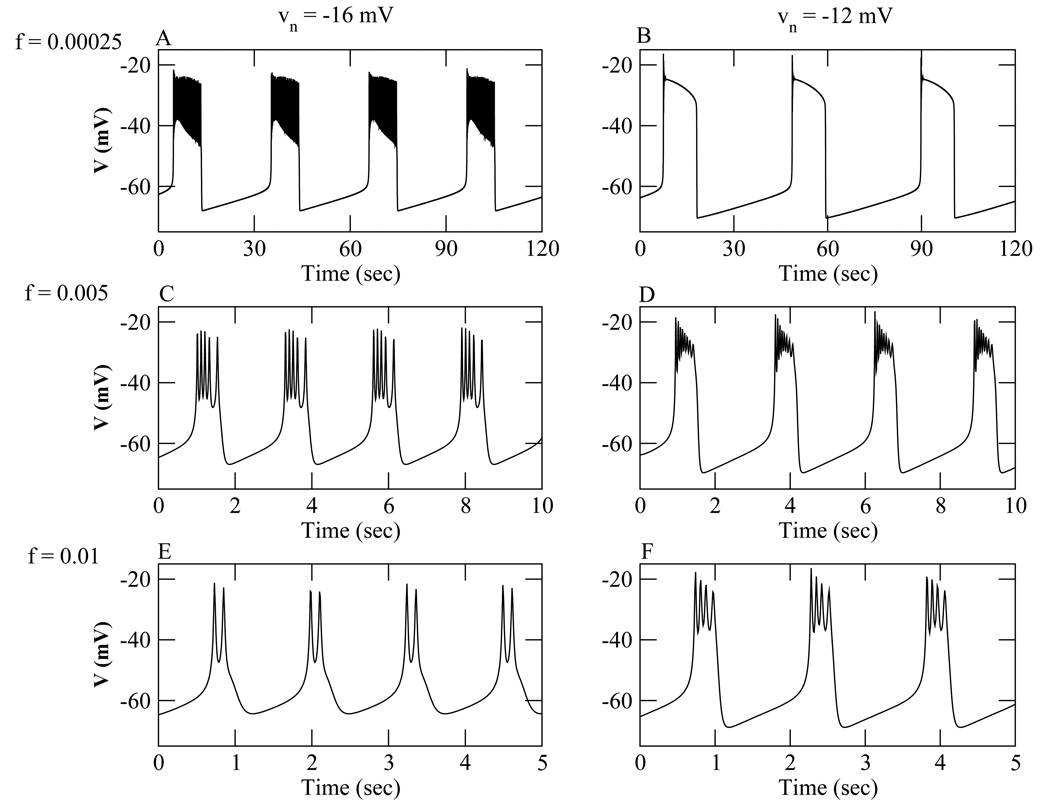
Increasing υn converts the bifurcation structure for plateau bursting to that for pseudo-plateau bursting. In addition to the change in the fast-subsystem bifurcation structures brought about through υn, modification of the speed of the slow variable is required. Using the default value f = 0.00025, plateau bursting (Fig. 5A) is converted to a relaxation-oscillation (Fig. 5B) when υn is increased from −16 mV to −12 mV. If this oscillation (Fig. 5B) is superimposed on the fast-subsystem bifurcation structure (Fig. 4C), the phase point travels along the lower and upper stationary branches, with only a few rapid oscillations at the down-up transition. When f is increased to 0.005, fast plateau bursting is produced with υn = −16 mV (Fig. 5C), and a form of pseudo plateau bursting is produced with υn = −12 mV, with many rapid and decaying spikes (Fig. 5D). The phase point still closely follows the lower stationary branch but now spirals around the upper stationary branch. When f is further increased to 0.01 the fast plateau bursting is converted to a spike doublet pattern (Fig. 5E), while a pseudo-plateau bursting pattern is produced with υn = −12 mV (Fig. 5F). This illustrates the importance of modifying both the fast subsystem bifurcation structure and the speed of the slow variable when making the transition between plateau (Fig. 5A) and pseudo-plateau (Fig. 5F) bursting.
Figure 5.
Bursting oscillations generated with the Chay-Keizer model and different values of f and υn. For the left panels υn= −16 mV, and for the right υn= −12 mV. (A), (B) f = 0.00025. (C), (D) f = 0.005. (E), (F) f = 0.01.
Another way to modify the fast subsystem bifurcation structure for conversion from plateau to pseudo-plateau bursting is to decrease the maximum conductance of the delayed rectifier K+ current gK. This is probably the most biophysically plausible approach, since the conductance gK is determined partly by the number of K+ channels present in the plasma membrane. It is likely that this number varies from cell to cell. As gK is decreased, the Hopf bifurcation and periodic branch move rightward on the z-curve, reflecting the stabilization of the upper stationary branch. When gK = 1800 pS, the Hopf bifurcation and periodic branch lie to the right of the LSN, the Hopf bifurcation is subcritical, and there are stable and unstable periodic branches (as in Fig. 4B). When gK is decreased further to 1000 pS, the subHB and periodic branch move further to the right (very close to the USN), and the stable periodic branch disappears, producing the bifurcation structure for pseudo-plateau bursting (as in Fig. 4C). To produce the pseudo-plateau bursting time course, f is set to 0.01 (as in Fig. 5F).
3.1.3 Plateau to pseudo-plateau conversion by actions on the Ca2+ current
Other methods for converting plateau to pseudo-plateau bursting are variation of the parameters υm and gCa, which have significant effects on the depolarizing Ca2+ current. When υm (voltage value at the midpoint of m∞) is decreased, the m∞(V) curve (Fig. 3, red solid curve) shifts leftward. This causes the Ca2+ channels to activate at lower voltages. Decreasing υm has the same effect as increasing υn on the bifurcation structures. The Hopf bifurcation and periodic branch move to the right, and the top branch of the z-curve is stabilized. A transitional bifurcation structure is produced when υm is decreased to −23 mV (as in Fig. 4B). A pseudo-plateau bifurcation structure is produced when υm = −26 mV (as in Fig. 4C). As before, f must be increased to achieve pseudo-plateau bursting.
A transition from plateau to pseudo-plateau bursting was also achieved by increasing the maximum conductance of the Ca2+ current gCa. However, this also required changing two additional parameters: gK was decreased from 2700 pS to 1500 pS and υm was increased from −20 mV to −17 mV. Then with gCa = 2100 pS a transitional bifurcation structure was obtained, and with gCa = 3000 pS a pseudo-plateau structure was produced.
3.1.4 Two-parameter bifurcation analysis
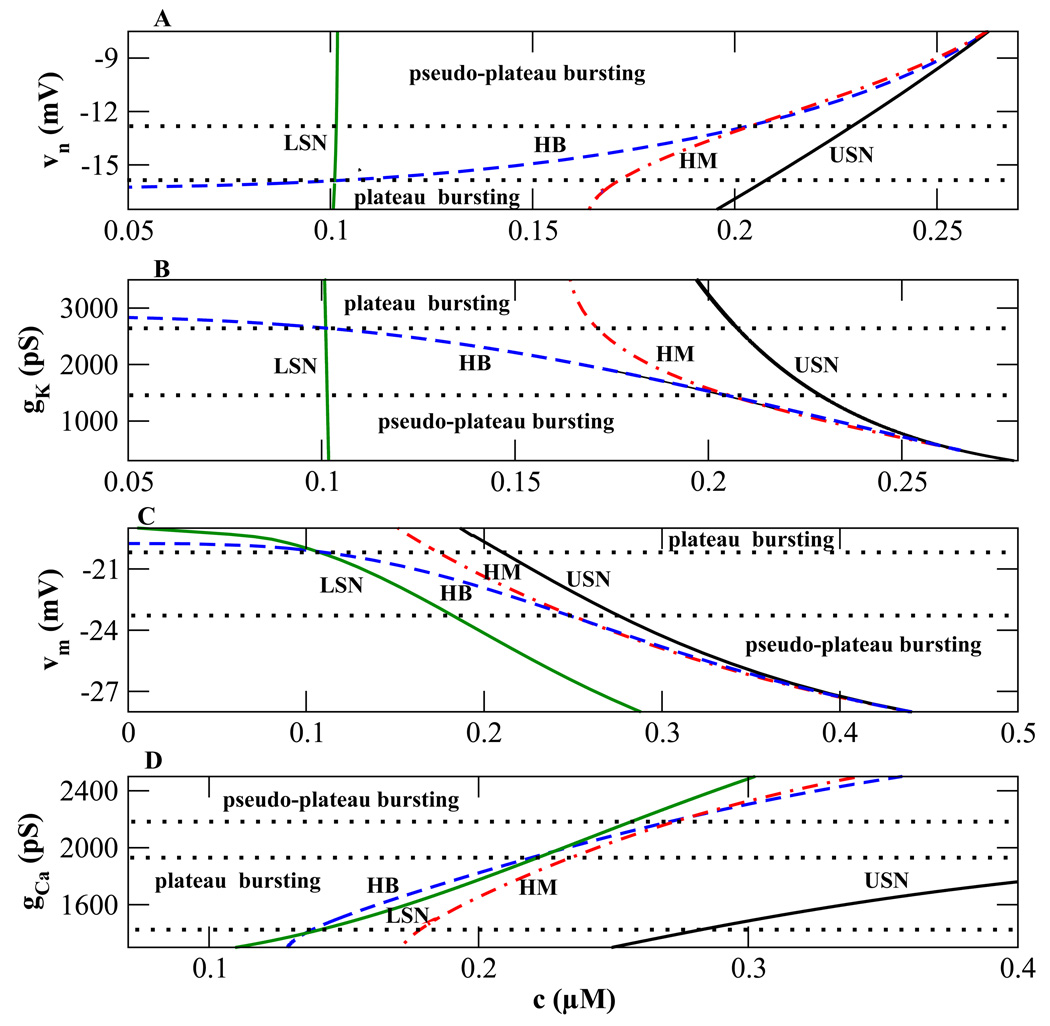
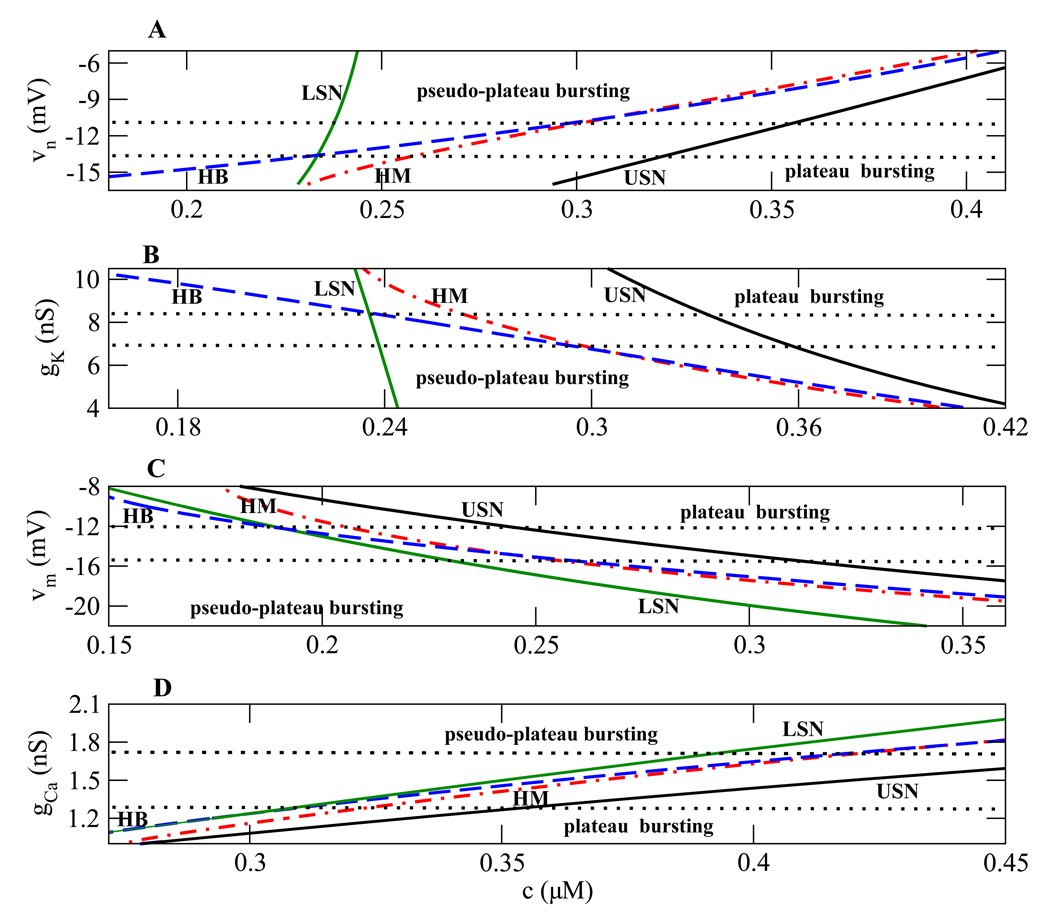
The series of one-parameter bifurcation diagrams shown earlier can be summarized using two-parameter bifurcation diagrams, where one of the parameters is the slow variable c and the other is one of the transition parameters υn, υm, gk or gCa (Fig. 6). The curves represent the bifurcation points shown in the previous bifurcation diagrams (Fig. 4A – C). The curves LSN (green), HB (blue), HM (red), and USN (black) correspond to lower saddle-node, Hopf, homoclinic, and upper saddle-node bifurcation points, respectively. For example the HB curve in Fig. 6A gives the c value of the Hopf bifurcation of the fast subsystem (Fig. 4) over a range of values of the parameter υn.
Figure 6.
Two-parameter bifurcation diagrams illustrating regions of plateau and pseudo-plateau bursting. The green (LSN), blue (HB), red (HM), and black (USN) curves represent the lower saddle node, Hopf, homoclinic, and upper saddle node bifurcation points, respectively. (A), (C) The midpoints of activation curves are varied. (B), (D) Current conductances are varied. In panel D, the region below the bottom dotted curve is neither plateau nor pseudo-plateau bursting since the order is cLSN < cHB < cHM < cUSN.
Most of the curves in Fig. 6 have small positive or small negative slope, so that varying one of the transition parameters greatly affects the locations of these HB, HM, and USN bifurcations. The top two panels show that the LSN curve is almost vertical, so the LSN bifurcation is relatively insensitive to υn and gk.
Important qualitative differences occur in the fast subsystem structure when bifurcation curves in Fig. 6 cross. For example, in Fig. 6A near the bottom the HB bifurcation is to the left of the LSN, which is to the left of the HM, which is to the left of the USN. Thus, the order is cHB < cLSN < cHM < cUSN, where cHB, cLSN, cHM, and cUSN are the c values at HB, LSN, HM, and USN, respectively. This is the order of bifurcation values in Fig. 4A, for the case of plateau bursting.
At the lower dotted line in Fig. 6A the HB and LSN curves cross, so that above that line cLSN < cHB. In terms of the one-parameter bifurcation structure, this means that the HB is to the right of the lower knee, and that there is an interval of bistability of the upper and lower steady states. This is a transitional form between that of plateau and that of pseudo-plateau bursting. The latter occurs when the HB curve crosses the HM curve (upper dotted curve) so that now cLSN < cHM < cHB < cUSN. This is the order of bifurcations for pseudo-plateau bursting (Fig. 4C). Thus, the region below the bottom dotted curve in Fig. 6A is characterized by plateau bursting, while the region above the top dotted curve is characterized by pseudo-plateau bursting. The middle region is transitional between the two.
In the bifurcation structures in Fig. 4 the top branch of the z-curve has stabilized when the negative feedback K+ current is decreased or the positive feedback Ca2+ current is increased. The negative feedback is decreased by increasing υn or decreasing gK. The positive feedback is increased by increasing gCa or decreasing υm. Increasing υn or gCa shifts the bifurcations to the right. As a result, the HB, HM and USN curves in Fig. 6A and D have positive slopes. In both panels (Fig. 6A and D), the bottom and top regions are characterized by plateau and pseudo-plateau bursting, respectively. Decreasing (rather than increasing) gK or υm shifts the bifurcations rightward, so the HB, HM and USN curves have negative slopes (Fig. 6B and C). The top regions are now characterized by plateau bursting and the bottom regions are characterized by pseudo-plateau bursting.
3.2 Cumulative properties of parameter variations
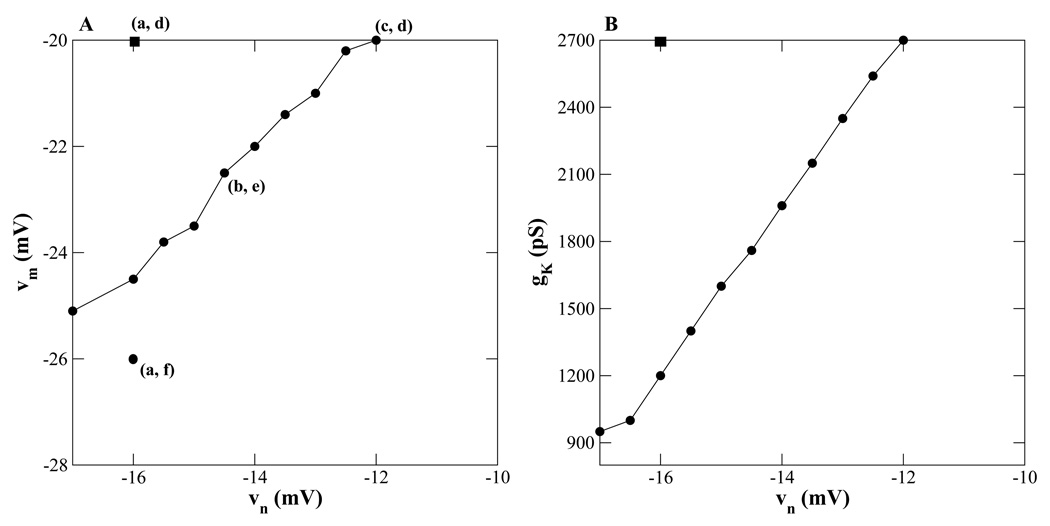
We have seen that a transition between plateau and pseudo-plateau bursts can be made by changing just one of the parameters υn, υm, gk, or gCa. If more than one parameter is varied, can the transition be achieved by smaller changes in each parameter? Fig. 7 illustrates the effects of varying two parameters. Using the default values υn = −16 mV and υm = −20 mV (Fig. 7A, (a, d)), plateau bursting is produced. To convert to pseudo-plateau bursting one could increase υn to −12 mV (point (c, d)), or decrease υm to −26 mV (point (a, f)). Both changes increase the separation between n∞(V) and m∞(V) (Fig. 3), which is critical for making the conversion to pseudo-plateau bursting. This can also be achieved by varying both υn and υm so as to bring about a similar separation in the n∞(V) and m∞(V) curves. As a result, a transition from plateau to pseudo-plateau bursting can be made with smaller changes to each parameter. The filled circles on the curve in Fig. 7A display values of υn and υm at which pseudo-plateau bursting is produced. Points just above the curve are in the transitional region. Most points on the curve correspond to shifts in both n∞(V) and m∞(V). For example, at point (b, e), υn = −14.5 mV and υm = −22.5 mV. Increasing υn to −14.5 mV shifts the n∞(V) curve rightward (blue dashed curve in Fig. 3) and decreasing υm to −22.5 mV shifts the m∞(V) curve leftward (red dashed curve in Fig. 3) so that the two curves are sufficiently far apart to produce pseudo-plateau bursting. In this case, the mid points of the two curves are 8 mV apart, and indeed for all points on the curve υn − υm ≈ 8 mV.
Figure 7.
Cumulative properties of parameter variations. (A) Changes in υn and υm that convert plateau (top left square, (a, d)) to pseudo-plateau bursting (points on or below the curve). a, b and c are midpoints of the n∞(V) curves, and d, e and f are midpoints of the m∞(V) curves (see Fig. 3). (B) Changes in υn and gK that convert plateau to pseudo-plateau bursting (on or below the curve).
Similarly, Fig. 7B shows the cumulative properties of υn and gk parameter variations. The square denotes the initial parameter set for plateau bursting and the points on the curve correspond to pseudo-plateau bursting. As in Fig. 7A, a transition to pseudo-plateau bursting can be achieved with changes in two parameters that are smaller than the change required in either parameter alone. Indeed, even smaller changes are required when three parameters υm, υn and gk are varied (not shown).
3.3 Transition from pseudo-plateau to plateau bursting with a pseudo-plateau bursting model
3.3.1 Pseudo-plateau to plateau conversion by actions on the K+ or Ca2+ current
We now use a pseudo-plateau bursting model, for pituitary lactotrophs (Appendix), to show a transition to plateau bursting. Thus, the transition between bursting types is not limited to the Chay-Keizer model but is a more general phenomenon. Fig. 1D shows pseudo-plateau bursting with the lactotroph model. The fast subsystem bifurcation structure is shown in Fig. 1F.
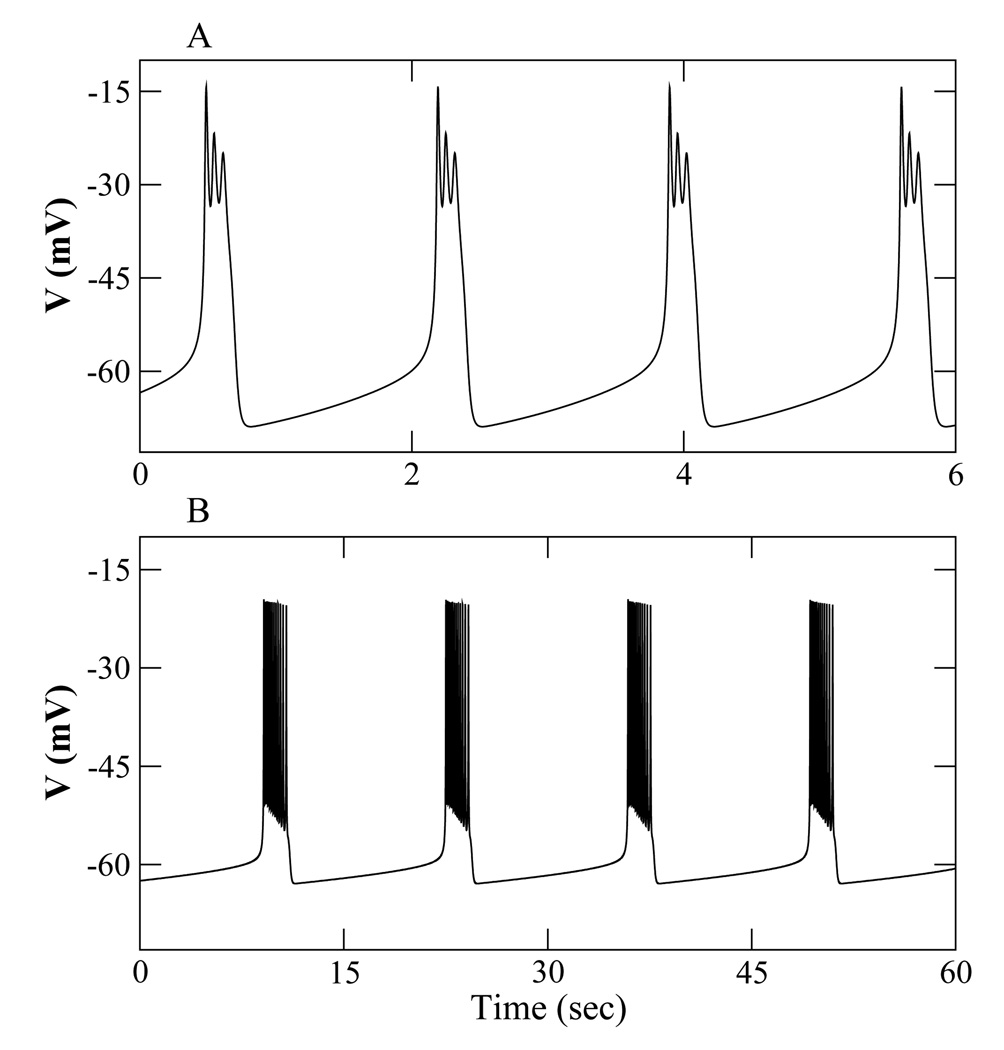
We have seen that in the Chay-Keizer model plateau bursting is converted to pseudo-plateau bursting by increasing υn or gCa, or by decreasing υm or gK. One potential approach for converting pseudo-plateau to plateau bursting is to work the other way around. This is demonstrated in Fig. 8. With υn = −9.5 mV (panel A) pseudo-plateau bursting is produced. When υn is decreased to −15 mV (and f changed from 0.01 to 0.00025) plateau bursting is produced (panel B). Similarly, increasing gK from 4 nS to 9 nS converts the pseudo-plateau bursting to plateau bursting (not shown).
Figure 8.
Bursting oscillations using the lactotroph model with parameter values in Table 2. (A) Pseudo-plateau bursting with υn = −9.5 mV. (B) Plateau bursting with υn = −15 mV and f = 0.00025.
Figure 9 shows the transition with two-parameter bifurcation diagrams, which are qualitatively similar to those produced with the Chay-Keizer model (Fig. 6). In some cases, it was not possible to make a transition using the default parameter values (Table 2). Therefore, the values of other parameters were modified before changes to the control parameter (υn, υm, gK or gCa) were made, as listed in the figure caption. The figure illustrates that, as with the Chay-Keizer model, there are several ways to convert between plateau and pseudo-plateau bursting with the lactotroph model.
Figure 9.
Two-parameter bifurcation diagrams for a model of the pituitary lactotroph illustrating regions of plateau and pseudo-plateau bursting. (A), (B) Using the parameter values given in Table 2. (C) Using gA = 4 nS, τh = 20 ms and λ = 1.2. (D) Using υm = −27 mV, gK = 7.2 nS, gA = 2.5 nS, τh = 20 ms and λ = 1.2.
Table 2.
Parameter values for the lactotroph model.
| Parameter | Value | Description |
|---|---|---|
| Cm | 10 pF | Membrane capacitance of the cell |
| gCa | 2 nS | Maximum conductance of Ca2+ channels |
| VCa | 50 mV | Reversal potential for Ca2+ |
| vm | −20 mV | Voltage value at midpoint of m∞ |
| sm | 12 mV | Slope parameter of m∞ |
| gK | 4 nS | Maximum conductance of K+ channels |
| VK | −75 mV | Reversal potential for K+ |
| vn | −5 mV | Voltage value at midpoint of n∞ |
| sn | 10 mV | Slope parameter of n∞ |
| τn | 30 ms | Time constant of n |
| λ | 1.9 | Parameter used to control spiking pattern |
| gK(Ca) | 1.7 nS | Maximum conductance of K(Ca) channels |
| Kd | 0.5 µ M | c at midpoint of s∞ |
| gBK | 0.43 nS | Maximum conductance of BK-type K+ channels |
| vf | −20 mV | Voltage value at midpoint of f∞ |
| sf | 5.6 mV | Slope parameter of f∞ |
| gA | 18 nS | Maximum conductance of A-type K+ channels |
| va | −20 mV | Voltage value at midpoint of a∞ |
| sa | 10 mV | Slope parameter of a∞ |
| vh | −60 mV | Voltage value at midpoint of h∞ |
| sh | 5 mV | Slope parameter of h∞ |
| τh | 5 ms | Time constant of h |
| f | 0.01 | Fraction of free Ca2+ ions in cytoplasm |
| α | 0.0015 µM fC−1 | Conversion from charge to concentration |
| kc | 0.06 ms−1 | Rate of Ca2+ extrusion |
4 Discussion
We have shown that a transition can be made between plateau and pseudo-plateau bursting by modifying the fast K+ and Ca2+ currents. Using the Chay-Keizer model, plateau bursting is converted to pseudo-plateau bursting, and using the lactotroph model, pseudo-plateau bursting is converted to plateau bursting. This illustrates that the plateau bursting exhibited by many neurons and by pancreatic islets are reconcilable with the pseudo-plateau bursting exhibited by many pituitary cells and single β-cells. Pseudo-plateau bursting is produced from plateau bursting by increasing the separation between the activation functions of the fast depolarizing and hyperpolarizing currents. Alternatively, the conductance of the depolarizing current can be increased or that of the hyperpolarizing current can be decreased. Another change that must be made is the speed of the slow variable, the Ca2+ concentration. This was accomplished here by varying f, the fraction of Ca2+ not bound by buffer. A typical value of f is measured to be 0.01 (Berlin et al., 1994), but there can be as much as an order of magnitude variation of f among cells of the same type (Al-Baldawi and Abercrombie, 1995). It has been demonstrated that variation in a cell’s buffering capacity can have a large impact in its electrical behavior, such as conversion from spiking to bursting (Roussel et al., 2006).
The plateau bursting that is common in neurons is characterized by large amplitude spikes, unlike pseudo-plateau bursting which has small amplitude spikes. This could be important for various neuronal functions such as conduction through the axon or neurotransmitter release and can help synchronize activity of several neurons. In contrast, pituitary cells are small and spherical; no axonal conduction is required and global hormone release does not require synchronization among cells. In the neuronal synapse, transmitter-filled vesicles and Ca2+ channels are molecularly linked, assuring their close proximity (Sheng et al., 1996). As a result, exocytosis is effectively triggered by action potentials (Mennerick and Matthews, 1996). In contrast, short impulse-like depolarizations are ineffective at evoking hormone release from melanotrophs (Mansvelder and Kits, 1998) and gonadotrophs (Tse et al., 1997), two types of pituitary cells. This suggests that longer depolarization, such as a pseudo-plateau burst, is needed. Indeed, basal secretion does not occur in pituitary gonadotrophs, which spike under basal conditions, but does occur in pituitary somatotrophs and lactotrophs, which often exhibit pseudo-plateau bursting under basal conditions (Van Goor et al., 2001b; Stojilkovic et al., 2005). Finally spike timing is often important in neurons, but not so in pituitary cells. This is facilitated by the large, well-defined (sharp) spikes produced during plateau, but not pseudo-plateau, bursting.
The resetting properties of the two types of bursting are also quite different. As described in (Stern et al., 2008), pseudo-plateau bursts are harder to reset between silent and active phases. In addition, while the resetting properties of plateau bursts are fairly obvious (a reset out of the silent phase results in a short next active phase and vice versa), the resetting properties of pseudo-plateau bursts are more complex and in some ways counter-intuitive (see Stern et al., 2008 for details). The different resetting properties of the two types of bursting mean that the two will respond differently to noise in the system, which is common in excitable cells. Despite this and other functional differences, we have shown here that models for the different classes of bursting contain the necessary elements to produce bursting of either class.
This work suggests that differences in the dynamical equilibrium between the fast inward and outward currents underly the differences between the two types of bursting. These differences can be accomplished by changing a single parameter of the inward or outward currents. Such changes in single parameter values could be done experimentally using the dynamic clamp technique (Sharp et al., 1993; Prinz et al., 2004). For example, IK (K+ current) could be blocked pharmacologically, then reintroduced with the dynamic clamp but with a different υn. This would alter the bifurcation structure underlying bursting. In addition, to switch from one type of burst to the other, we would have to change f, the fraction of unbound calcium (Roussel et al., 2006). Thus, it will be possible, in principle, to verify our assertion that changes in two parameters can switch the bursting pattern between plateau and pseudo plateau.
Acknowledgements
Wondimu Teka, Joël Tabak and Richard Bertram were supported by NSF grant DMS-0917664 (Wondimu Teka and Richard Bertram) and NIH grant DA-19356 (Joël Tabak and Richard Bertram).
A Appendix
The lactotroph model
The lactotroph model (Tabak et al., 2007) includes differential equations for the variables V (membrane potential), n (fraction of activated delayed rectifier K+ channels), h (fraction of A-type K+ channels that are not inactivated), and c (cytosolic free Ca2+ concentration). The equations are:
| (A.1) |
| (A.2) |
| (A.3) |
| (A.4) |
where ICa is an inward Ca2+ current, IK is an outward delayed rectifying K+ current, IK(Ca) is an SK-type Ca2+-activated K+ current, IBK is a fast-activating BK-type K+ current, and IA is an A-type K+ current. The currents in the equations above are:
| (A.5) |
| (A.6) |
| (A.7) |
| (A.8) |
| (A.9) |
The steady state activation and inactivation functions are given by;
| (A.10) |
| (A.11) |
| (A.12) |
| (A.13) |
| (A.14) |
| (A.15) |
where m∞ is the steady state activation function for ICa, n∞ is the steady state activation function for IK, s∞ is the fraction of K(Ca) channels activated by cytosolic Ca2+, h∞ is the steady state inactivation function for IA, a∞ is the steady state activation function for IA, and f∞ is the steady state activation function for IBK. These range from 0 to 1.
References
- Al-Baldawi NF, Abercrombie RF. Cytoplasmic calcium buffer capacity determined with Nitr-5 and DM-nitrophen. Cell Calcium. 1995;17:409–421. doi: 10.1016/0143-4160(95)90087-x. [DOI] [PubMed] [Google Scholar]
- Berlin JR, Bassani JWM, Bers DM. Intrinsic cytosolic calcium buffering properties of single rat cardiac myocytes. Biophys. J. 1994;67:1775–1787. doi: 10.1016/S0006-3495(94)80652-6. [DOI] [PMC free article] [PubMed] [Google Scholar]
- Bertram R, Butte MJ, Kiemel T, Sherman A. Topological and phenomenological classification of bursting oscillations. Bull. Math. Biol. 1995;57:413–439. doi: 10.1007/BF02460633. [DOI] [PubMed] [Google Scholar]
- Bertram R, Sherman A. A calcium-based phantom bursting model for pancreatic islets. Bull. Math. Biol. 2004;66:1313–1344. doi: 10.1016/j.bulm.2003.12.005. [DOI] [PubMed] [Google Scholar]
- Bertram R, Sherman A. Negative calcium feedback: The road from Chay-Keizer. In: Coombes S, Bressloff P, editors. The Genesis of Rhythm in the Nervous System. New Jersey: World Scientific Press; 2005. pp. 19–48. [Google Scholar]
- Chay T, Keizer J. Minimal model for membrane oscillations in the pancreatic β-cell. Biophys. J. 1983;42:181–190. doi: 10.1016/S0006-3495(83)84384-7. [DOI] [PMC free article] [PubMed] [Google Scholar]
- Ermentrout B. Simulating, analyzing, and animating dynamical systems: A guide to XPPAUT for researchers and students. Philadelphia: SIAM; 2002. [Google Scholar]
- Izhikevich EM. Neural excitability, spiking and bursting. Int. J. Bifur. Chaos. 2000;10:1171–1266. [Google Scholar]
- LeBeau AP, Robson AB, McKinnon AE, Sneyd J. Analysis of a reduced model of corticotroph action potentials. J. Theor. Biol. 1998;192:319–339. doi: 10.1006/jtbi.1998.0656. [DOI] [PubMed] [Google Scholar]
- Mansvelder HD, Kits KS. The relation of exocytosis and rapid endocytosis to calcium entry evoked by short repetitive depolarizing pulses in rat melanotropic cells. J. Neurosci. 1998;18:81–92. doi: 10.1523/JNEUROSCI.18-01-00081.1998. [DOI] [PMC free article] [PubMed] [Google Scholar]
- Mennerick S, Matthews G. Ultrafast exocytosis elicited by calcium current in synaptic terminals of retinal bipolar neurons. Neuron. 1996;17:1241–1249. doi: 10.1016/s0896-6273(00)80254-8. [DOI] [PubMed] [Google Scholar]
- Prinz AA, Abbott LF, Marde E. The dynamic clamp comes of age. Trends Neurosci. 2004;27:218–224. doi: 10.1016/j.tins.2004.02.004. [DOI] [PubMed] [Google Scholar]
- Rinzel J. A formal classification of bursting mechanisms in excitable systems. In: Teramoto E, Yamaguti M, editors. Mathematical Topics in Population Biology, Morphogenesis, and Neurosciences, Lecture Notes in Biomathematics. Berlin: Springer; 1987. pp. 267–281. [Google Scholar]
- Roussel C, Erneux T, Schiffmann S, Gall D. Modulation of neuronal excitability by intracellular calcium buffering: From spiking to bursting. Cell Calcium. 2006;39:455–466. doi: 10.1016/j.ceca.2006.01.004. [DOI] [PubMed] [Google Scholar]
- Sharp AA, O’Neil MB, Abbott LF, Marder E. Dynamic clamp: computer-generated conductances in real neurons. J. Neurophysiol. 1993;69:992–995. doi: 10.1152/jn.1993.69.3.992. [DOI] [PubMed] [Google Scholar]
- Sheng ZH, Rettig J, Cook T, Catterall WA. Calcium-dependent interaction of N-type calcium channels with the synaptic core complex. Nature. 1996;379:451–454. doi: 10.1038/379451a0. [DOI] [PubMed] [Google Scholar]
- Stern JV, Osinga HM, LeBeau A, Sherman A. Resetting behavior in a model of bursting in secretory pituitary cells: distinguishing plateaus from pseudo-plateaus. Bull. Math. Biol. 2008;70:68–88. doi: 10.1007/s11538-007-9241-x. [DOI] [PubMed] [Google Scholar]
- Stojilkovic SS, Zemkova H, Van Goor F. Biophysical basis of pituitary cell type-specific Ca2+ signaling-secretion coupling. Trends Endocrinol. Metabol. 2005;16:152–159. doi: 10.1016/j.tem.2005.03.003. [DOI] [PubMed] [Google Scholar]
- Tabak J, Toporikova N, Freeman ME, Bertram R. Low dose of dopamine may stimulate prolactin secretion by increasing fast potassium currents. J. Comput. Neurosci. 2007;22:211–222. doi: 10.1007/s10827-006-0008-4. [DOI] [PMC free article] [PubMed] [Google Scholar]
- Tsaneva-Atanasova K, Sherman A, Van Goor F, Stojilkovic SS. Mechanism of spontaneous and receptor-controlled electrical activity in pituitary somatotrophs: experiments and theory. J. Neurophysiol. 2007;98:131–144. doi: 10.1152/jn.00872.2006. [DOI] [PubMed] [Google Scholar]
- Tse FW, Tse A, Hille B, Horstmann H, Almers W. Local Ca2+ release from internal stores controls exocytosis in pituitary gonadotrophs. Neuron. 1997;18:121–132. doi: 10.1016/s0896-6273(01)80051-9. [DOI] [PubMed] [Google Scholar]
- Van Goor F, Li Y-X, Stojilkovic SS. Paradoxical role of large-conductance calcium-activated K+ (BK) channels in controlling action potential-driven Ca2+ entry in anterior pituitary cells. J. Neurosci. 2001a;21:5902–5915. doi: 10.1523/JNEUROSCI.21-16-05902.2001. [DOI] [PMC free article] [PubMed] [Google Scholar]
- Van Goor F, Zivadinovic D, Martinez-Fuentes AJ, Stojilkovic SS. Dependence of pituitary hormone secretion on the pattern of spontaneous voltage-gated calcium influx. Cell type-specific action potential secretion coupling. J. Biol. Chem. 2001b;276:33840–33846. doi: 10.1074/jbc.M105386200. [DOI] [PubMed] [Google Scholar]
- Zhang M, Goforth P, Bertram R, Sherman A, Satin L. The Ca2+ dynamics of isolated mouse β-cells and islets: implications for mathematical models. Biophys. J. 2003;84:2852–2870. doi: 10.1016/S0006-3495(03)70014-9. [DOI] [PMC free article] [PubMed] [Google Scholar]


