

Abstract
Neural basic helix-loop-helix (bHLH) transcription factors are crucial in regulating the differentiation and neuronal subtype specification of neurons. Precisely how these transcription factors direct such processes is largely unknown due to the lack of bona fide targets in vivo. Genetic evidence suggests that bHLH factors have shared targets in their common differentiation role, but unique targets with respect to their distinct roles in neuronal subtype specification. However, whether neuronal subtype-specific targets exist remains an unsolved question. To address this question, we focused on Atoh1 (Math1), a bHLH transcription factor that specifies distinct neuronal subtypes of the proprioceptive pathway in mammals including the dI1 (dorsal interneuron 1) population of the developing spinal cord. We identified transcripts unique to the Atoh1-derived lineage using microarray analyses of specific bHLH-sorted populations from mouse. Chromatin immunoprecipitation-sequencing experiments followed by enhancer reporter analyses identified five direct neuronal subtype-specific targets of Atoh1 in vivo along with their Atoh1-responsive enhancers. These targets, Klf7, Rab15, Rassf4, Selm, and Smad7, have diverse functions that range from transcription factors to regulators of endocytosis and signaling pathways. Only Rab15 and Selm are expressed across several different Atoh1-specified neuronal subtypes including external granule cells (external granule cell layer) in the developing cerebellum, hair cells of the inner ear, and Merkel cells. Our work establishes on a molecular level that neuronal differentiation bHLH transcription factors have distinct lineage-specific targets.
Introduction
First discovered in Drosophila, neural-specific basic-helix-loop-helix (bHLH) transcription factors are crucial for determining proper neural cell fates (Jan and Jan, 1994). In vertebrates, bHLH transcription factors are essential for the general neuronal differentiation as well as neuronal subtype specification of diverse cell types in the peripheral and CNSs (Bertrand et al., 2002). They are thought to share activity in inducing neuronal differentiation but have distinct functions in specifying neuronal subtypes (Parras et al., 2002; Nakada et al., 2004a). While several studies have found targets of bHLH transcription factors, they have mostly focused on their common role in neurogenesis (Bertrand et al., 2002; Castro et al., 2006; Seo et al., 2007).
Elegant genetic studies in Drosophila and mouse suggest that, in addition to shared downstream transcriptional targets, bHLH transcription factors have unique targets relevant for the function or development of that specific neuronal subtype. Studies misexpressing scute or ato (Chien et al., 1996; Jarman and Ahmed, 1998), or substituting Neurog2 with Ascl1 (Parras et al., 2002) respecified neurons in a context-dependent manner. Similarly, overexpression of Ascl1 and Atoh1 in the chick spinal cord induces progenitors to differentiate into specific neuronal subtypes (Gowan et al., 2001; Nakada et al., 2004a).
We focused our study on mammalian atonal (ato) homolog 1 (Atoh1), a bHLH transcription factor required for the formation of different proprioceptive neuronal subtypes (Bermingham et al., 2001). Due to its discrete expression in defining progenitors to the dorsal interneuron 1 (dI1) population of the developing spinal cord (Bermingham et al., 2001; Gowan et al., 2001), Atoh1 was an ideal bHLH to identify neuronal subtype-specific targets. In addition to dI1 neurons, Atoh1 specifies progenitors to the granule layer of the cerebellum (Ben-Arie et al., 1997), several hindbrain neurons (Ben-Arie et al., 1997; Machold and Fishell, 2005; Wang et al., 2005; Maricich et al., 2009b; Rose et al., 2009a,b), sensory hair cells of the inner ear (Bermingham et al., 1999; Zheng and Gao, 2000; Izumikawa et al., 2005; Raft et al., 2007), and Merkel cells in the skin and vibrissae (Ben-Arie et al., 2000; Maricich et al., 2009a; Morrison et al., 2009; Van Keymeulen et al., 2009). However, fundamental mechanistic understanding of how Atoh1 directs specification of these neuronal subtypes is lacking in the spinal cord since the only known direct Atoh1 target in vivo in addition to Atoh1 itself (Helms et al., 2000) is the transcription factor Barhl2 in dI1 neurons (Saba et al., 2005). In contrast, in the developing cerebellum, a variety of direct Atoh1 targets were recently identified (Klisch et al., 2011) adding to the previously known targets, Barhl1 and Gli2 (Kawauchi and Saito, 2008; Flora et al., 2009).
In this study, we identified unique targets of Atoh1 by comparing sorted Atoh1 lineage cells in the developing dorsal neural tube with a neighboring population defined by the expression of the bHLH factor neurogenin1 [Neurog1 (Ngn1)]. We identified transcripts enriched in Atoh1 lineage cells and biased against identifying common bHLH targets. Using chromatin immunoprecipitation and sequencing (ChIP-seq) data from a FLAG-tagged Atoh1 knock-in mouse, we identified five new direct lineage-specific in vivo targets of Atoh1 whose enhancers respond to Atoh1 expression: Klf7, Rassf4, Rab15, Selm, and Smad7.
Materials and Methods
Experimental animals and generation of transgenic mice.
Atoh1BAC-GFP (Math1GFP-BAC) (Raft et al., 2007) and dNeurog1-GFP (TgN1-13G) (Nakada et al., 2004b) transgenic mice were generated previously. Atoh1BAC-GFP transgenic mice contain the bacterial artificial chromosome RPCI-23318G16 with the Atoh1 coding sequence replaced with nuclear localized GFP. dNeurog1-GFP transgenic mice contain an enhancer from the Neurog1 gene that directs GFP reporter expression primarily to the dP2/dI2 domains in the dorsal neural tube. Transgenic embryos were identified by GFP fluorescence. Tail clips and yolks sacs of transgenic mice were PCR genotyped for GFP.
Transgenic mice of Klf7 site A and Rassf4 site A enhancers cloned into the BgnEGFP vector (Lumpkin et al., 2003) were generated using standard procedures (Brinster et al., 1985). Each transgene was isolated from recombinant plasmid on a standard agarose gel and microinjected at 1–3 ng/μl into pronuclei of fertilized eggs from B6SJLF1 (C57BL/6J×SJL) crosses by the Transgenic Core Facility of University of Texas Southwestern Medical Center at Dallas. All animal experiments were approved by the Institutional Animal Care and Use Committee at University of Texas Southwestern.
Fluorescence-activated cell sorting and mRNA isolation.
Atoh1BAC-GFP and dNeurog1-GFP transgenic mouse E10.5 neural tubes from forelimb to hindlimb were dissected in DMEM/F12 (Invitrogen) and dissociated with 0.25% trypsin-EDTA (Invitrogen). Fluorescence-activated cell sorting (FACS) was performed by the University of Texas Southwestern Flow Cytometry Core Facility. Cells were sorted into GFP− and GFP+ cells with a MoFlo (Dako/Beckman Coulter; 100 μm nozzle) or a FACSAria (BD Biosciences) cell sorter directly into ZR RNA buffer (Zymo Research). RNA was extracted using the Mini RNA Isolation II Kit (Zymo Research).
cDNA preparation, RT-PCR, and quantitative RT-PCR.
cDNA for RT-PCR was prepared from TURBO DNase (Ambion)-treated GFP+ and GFP− cell sorted RNA from E10.5 neural tubes using Omniscript or Sensiscript reverse transcription kits (QIAGEN) with oligo-dT primer. The quality of GFP-sorted cells was verified by RT-PCR (QIAGEN Taq) using primers to Atoh1 (5′-GCT GGT AAG GAG AAG CGG CTG TG-3′ and 5′-TGT ACC CCA TTC ACC TGT TTG C-3′) or Neurog1 (5′-CCA CTG TGG CAT CAC CAC TC-3′ and 5′-GCG TCG TGT GGA GCA GGT CTT TG-3′), GFP (5′-CAG AAG AAC GGC ATC AAG GTG AAC-3′ and 5′-GGG TGC TCA GGT AGT GGT TG-3′), and GAPDH (5′-ACC ACA GTC CAT GCC ATC AC-3′ and 5′-CAG CTC TGG GAT GAC CTT GC-3′) mRNA and visualized on a 2% agarose gel with ethidium bromide.
cDNA for quantitative PCR (qPCR) was prepared from TURBO DNase (Ambion)-treated pooled GFP+ and GFP− cell-sorted RNA from E10.5 mouse neural tubes using the SuperScript III First-Strand Synthesis System (Invitrogen) with random hexamers. qPCR was performed with Fast SYBR Green Master Mix (ABI) on the 7500 Fast Real-Time PCR System (ABI) using the following primers: Atoh1 (5′-GTA AGG AGA AGC GGC TGT G-3′ and 5′-AGC CAA GCT CGT CCA CTA-3′), Rab15 (5′-GGC TTG GGC TGT GTC ATT G-3′ and 5′-GGC AGA CAG GCC AGG AAA-3′), Selm (5′-TCG TGC TGT TAA GCC GAA ATT-3′ and 5′-CCG GGT CAT TTG GCT GAG T-3′), Smad7 (5′-CGA AGA CAG GAA ACG AGA GTC A-3′ and 5′-GGT GGT GCC CAC TTT CAC A-3′), Neurog1 (5′-CTG CGC TTC GCC TAC AAC TAC-3′ and 5′-ATC TGC CAG GCG CAG TGT-3′), and peptidylprolyl isomerase B (Ppib) (formerly known as Cyclophilin B) (5′-GGA GAT GGC ACA GGA GGA A-3′ and 5′-GCC CGT AGT GCT TCA GCT T-3′). The ΔΔCt method was used to determine the mRNA fold change of transcripts in the Atoh1BAC-GFP+ to dNeurog1-GFP+ cells (see Fig. 1D) and the Atoh1BAC-GFP+ to GFP− cells (see Fig. 2B) using Ppib as the endogenous control gene. Graphs were made using Prism 5 software.
Figure 1.
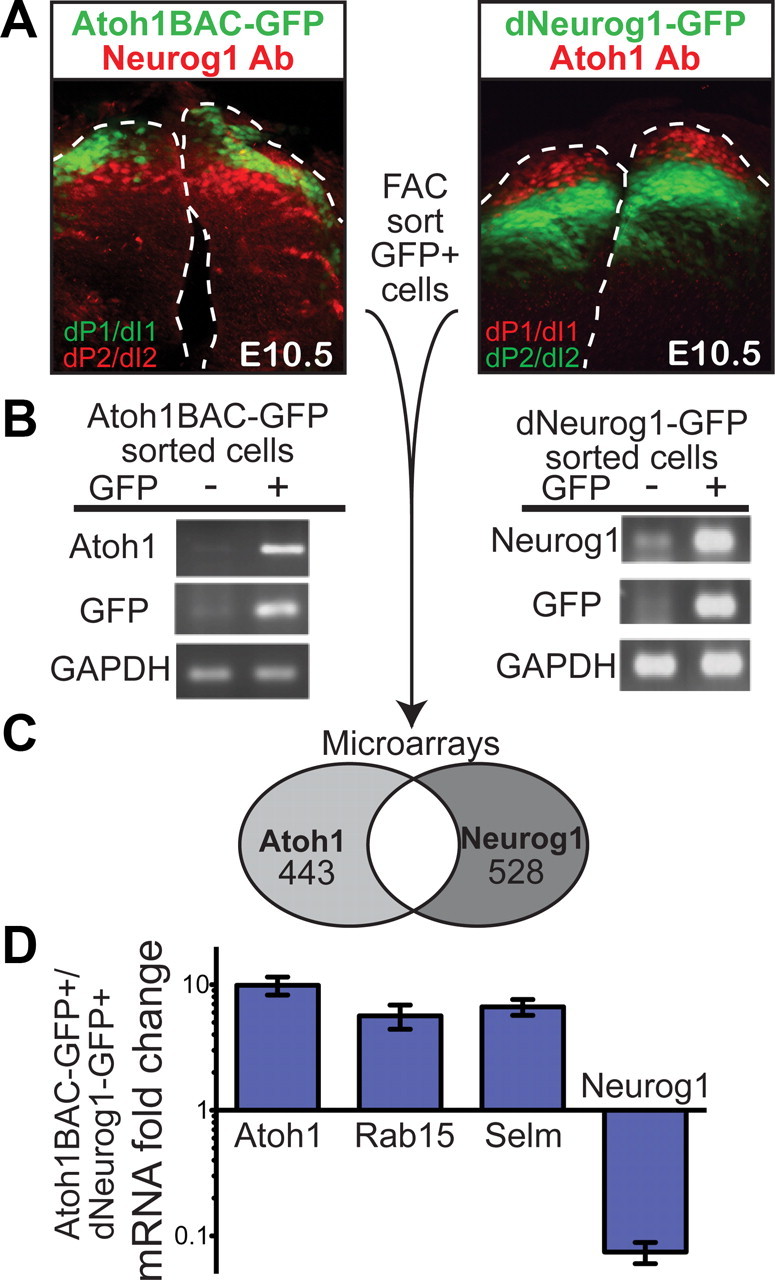
Discrete Atoh1 and Neurog1 dorsal neural tube populations were isolated for microarray analyses. A, Immunostaining of E10.5 mouse neural tubes (transverse sections) from Atoh1BAC-GFP and dNeurog1-GFP transgenic mice shows that the GFP fluorescence has little overlap with the neighboring population (immunostained with Neurog1 antibody or Atoh1 antibody, respectively). Atoh1 and Atoh1BAC-GFP mark the dorsal progenitor and interneuron 1 (dP1 and dI1) populations, while Neurog1 and dNeurog1-GFP mark the dorsal progenitor and interneuron 2 (dP2 and dI2) populations. GFP positive (+) and negative (−) cells were separated by FACS. B, RT-PCR of RNA extracted from GFP+ and GFP− cells shows that the cells were well separated with Atoh1 and GFP transcripts enriched in the GFP+ Atoh1BAC-GFP sorted cells, and Neurog1 and GFP transcripts enriched in the GFP+ dNeurog1-GFP sorted cells, while the control, GAPDH, remained in both populations. C, GFP+ cells from Atoh1BAC-GFP and dNeurog1-GFP neural tubes were analyzed by Affymetrix Mouse 430 2.0 microarrays and the number of genes enriched in each population is given. D, mRNA fold change expression of transcripts from Atoh1BAC-GFP+ sorted cells compared with dNeurog1-GFP+ cells quantitated by RT-qPCR. Ppib (formerly Cyclophilin B) was used as the endogenous control gene. SDs are reported.
Figure 2.
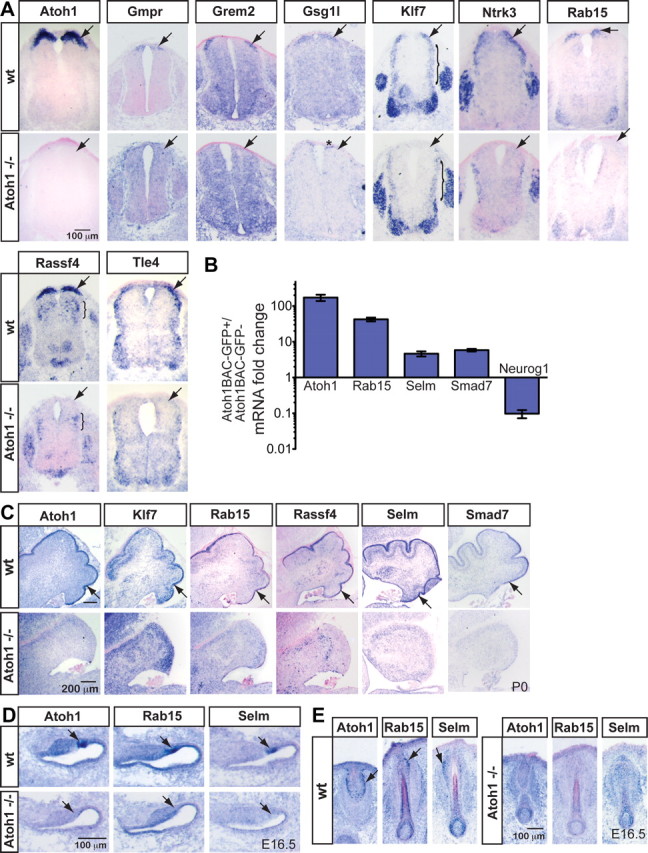
Novel transcripts specific to Atoh1-derived domains were identified. A, Several transcripts found to be enriched in the Atoh1-derived population over the neighboring Neurog1-derived population in the microarray analyses are expressed in the dorsal-most part of the developing E10.5 neural tube and are absent in Atoh1 mutant embryos (arrows) (Ben-Arie et al., 1997) as detected by ISH. The asterisk (*) denotes that Gsg1l expression appears to be near the roof plate in the Atoh1 knock-out. The bracket (}) indicates lateral expression of Klf7 and expression of Rassf4 in the Ascl1-derived domain of the neural tube in their respective panels. B, mRNA fold change expression of transcripts from Atoh1BAC-GFP+ sorted cells compared with GFP− cells quantitated by RT-qPCR. Ppib (formerly Cyclophilin B) was used as the endogenous control gene. SDs are reported. C, Klf7, Rab15, Rassf4, Selm, and Smad7 are present in the developing EGL at P0. D, E, Rab15 and Selm are present in developing E16.5 hair cells (D) and Merkel cells in the vibrissae (E), and their expression is lost in the Atoh1 mutant mouse.
Microarray analysis.
Integrity of the isolated total RNA was analyzed using a 2100 Bioanalyzer (Agilent). One microgram of RNA pooled from Atoh1BAC-GFP+ or dNeurog1-GFP+ sorted cells from multiple embryos from multiple litters was processed for Affymetrix Mouse 430 2.0 microarrays by the University of Texas Southwestern Microarray Core Facility using standard protocols. Two biological samples per transgenic mouse type were processed for microarrays, preprocessed with MAS 5.0 to generate normalized signal intensity data, and analyzed using GeneSpring Agilent GX 7.3 Expression Analysis software. Signals <0.01 were set to 0.01 and each chip was normalized to the 50th percentile and analyzed for probes with over twofold change in signal where the Affymetrix probes had to be present or marginal in at least one of the Atoh1BAC-GFP or dNeurog1-GFP samples. Individual arrays from Atoh1BAC-GFP+ cells versus the dNeurog1-GFP+ cells were compared. Fold differences in transcript levels are presented separately since reliable statistical analyses cannot be performed on only two arrays. The raw microarray data has been deposited in the NCBI Gene Expression Omnibus database (Edgar et al., 2002) (GEO Series accession number GSE23089) (http://www.ncbi.nlm.nih.gov/geo/query/acc.cgi? acc=GSE23089). The processed data will be provided upon request or can be found at http://www8.utsouthwestern.edu/utsw/cda/dept120915/files/150735.html.
Tissue preparation, immunostaining, and microscopy.
Whole mouse male and female embryos from wild-type or Atoh1 knock-out mice (Ben-Arie et al., 1997) were dissected at E10.5 where E0 was timed as halfway through the dark cycle of the morning that the vaginal plug was detected. Mouse and chick embryos were fixed in 4% paraformaldehyde for 1.5–2 h, washed, cryoprotected, embedded, and cryosectioned (transverse, 20–30 μm). Heads of E16.5 embryos were fixed overnight. The noses were cut and embedded for coronal sections while the rest of the head was cut at a 45° angle between coronal and transverse sections to obtain the appropriate visualization for the developing inner ear. P0 pups were perfused with 2 ml of PBS, and brains were dissected out, fixed overnight, and embedded for sagittal sections.
Mouse or chick sections were incubated in primary antibody and the appropriate secondary fluorophore-conjugated antibodies (Alexa fluorophores 488, 568, 594, 647; Invitrogen). Primary antibodies used were as follows: 1:100, rabbit anti-Atoh1 (Helms and Johnson, 1998); 1:4000, rabbit anti-Lhx2/9 (Liem et al., 1997); 1:500, rabbit anti-Neurog1 (Gowan et al., 2001); 1:500, chick anti-GFP (Aves); 1:500, mouse anti-BOSS (Krämer et al., 1991); 1:1000, mouse anti-c-myc (Santa Cruz Biotechnology); 1:100, mouse anti-Islet1/2 (40.2D6) (Developmental Studies Hybridoma Bank) (Ericson et al., 1992); 1:100, mouse-anti Lhx1/5 (4F2) (Developmental Studies Hybridoma Bank) (Tsuchida et al., 1994); and 1:200, goat anti-Neurod (Santa Cruz Biotechnology). Sections were imaged using a Zeiss LSM510 confocal microscope. For Figure 5, G, J, and K, the endogenous GFP fluorescence gain and offset was kept constant and 16-bit tiff images taken on the same day within one set of chick electroporation experiments of an enhancer-GFP construct plus control, BOSSAtoh1, or mycAscl1. Mean GFP pixel intensity/cell of colocalized GFP and BOSS- or myc-tagged bHLH was processed using ImageJ (Abramoff et al., 2004). The threshold for colocalization was optimized for each image. In the cases in which the GFP fluorescence was below detectable levels (Fig. 5D,D″,F), the GFP fluorescence of the entire image was calculated. The insets in Figure 5 were manipulated with Photoshop to show that GFP fluorescence was detectable in some cases and that the neural tube was adequately injected. SEMs are given and p values were determined in Excel using a two-tailed two-sample unequal variance (heteroscedastic) t test.
Figure 5.
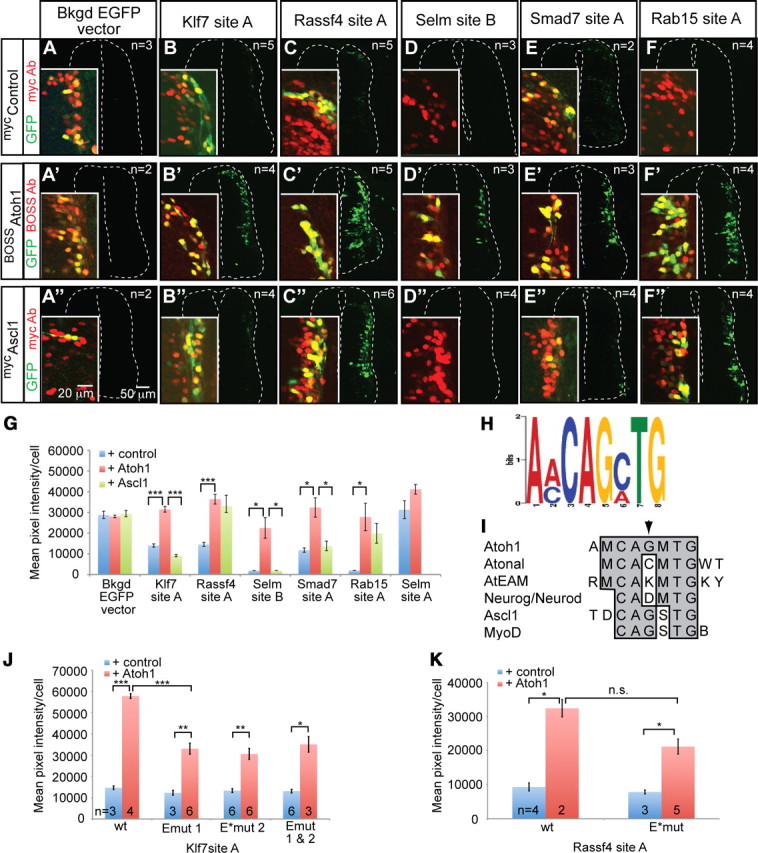
Enhancers of Atoh1 targets are induced by Atoh1 and contain a common E-box motif. Each enhancer found to drive expression to dI1 neurons was tested for its sensitivity to Atoh1 overexpression in chick neural tubes. A–F″, Enhancers of Atoh1 targets, Klf7 site A (B–B″), Rassf4 site A (C–C″), Selm site B (D–D″), Smad7 site A (E–E″), and Rab15 site A (F–F″) driving GFP were coinjected with a myc-tagged control bHLH inactive mutant (Nakada et al., 2004a), a BOSS-tagged Atoh1 (Helms et al., 2000), or a myc-tagged Ascl1 (Nakada et al., 2004a). In all cases, Atoh1 increased the GFP fluorescence intensity of the enhancer reporter (B′, C′, D′, E′, F′), while Ascl1 did not except for Rassf4 site A (C″) and Rab15 site A (F″). The insets are enlarged manipulated images showing that the GFP fluorescence could be detected and the cells were injected (myc or BOSS antibody, red). For D, D″, and F, the GFP gain was set very low to accommodate the significant increase in GFP fluorescence upon coelectroporation with Atoh1, so there appears to be no GFP fluorescence; however, if the gain is increased, there is detectable GFP fluorescence (our observation) as seen in Figure 3K and 4A. The EGFP vector with no enhancer was not significantly induced by Atoh1 or Ascl1 (A–A″). G, Colocalized cells (GFP+ and myc+ or BOSS+) were outlined and the average pixel intensity per cell calculated for each image. Number of images quantified per sample are given in A–F″. All five enhancers were induced by Atoh1, whereas Selm site A, which does not direct expression to the dI1 domain, was not induced by Atoh1 (n = 3) over control (n = 2). H, MEME enhancer analysis of Atoh1-bound regions of Atoh1 responding enhancers identified a common E-box motif. I, Comparison of the Atoh1 common E-box motif to consensus E-box sequences derived for Atonal (Powell et al., 2004), Atoh1 in the cerebellum (AtEAM) (Klisch et al., 2011), Neurog/Neurod1 (Seo et al., 2007), Ascl1 (Castro et al., 2006), and MyoD (Cao et al., 2010). The arrowhead points to the first N site of the E-box that is different between the Atoh1 common E-box and Atonal consensus binding site. B = C/G/T, D = A/G/T, K = G/T, M = A/C, R = G/A, S = G/C, W= A/T, Y = C/T. J, The average pixel intensity per cell was calculated (as in G) for Klf7 site A with either one or both of the two E-boxes mutated (Emut 1, E*mut 2, and Emut 1&2) with and without Atoh1. E*mut indicates the E-box that meets the common E-box motif found in H. K, Similarly, the average pixel intensity per cell was calculated for Rassf4 site A with only the common E-box mutated (E*mut) with and without Atoh1. The number of images quantified per condition is given. For G, J, and K, SEMs are reported. *p < 0.05, **p < 0.001, ***p < 0.0001; n.s., not significant.
In situ probe and enhancer cloning.
In situ probes were cloned from E10.5 neural tubes or P0 cerebella cDNA. Enhancers were cloned from whole genomic DNA of ICR wild-type mice into the BgnEGFP vector (Lumpkin et al., 2003). Primer sets, cloning sites, and parent plasmid vector used for each probe or enhancer construct will be provided upon request or at http://www8.utsouthwestern.edu/utsw/cda/dept120915/files/150735.html. PCR products were obtained using standard protocols from the iProof kit (Bio-Rad), KOD Xtreme HotStart DNA Polymerase (Novagen) kit, or Expand High Fidelity (Roche) kit.
In situ hybridization.
In situ hybridization (ISH) was performed as per standard protocols. A detailed protocol is available upon request. Digoxygenin (DIG)-labeled antisense RNA probes (1–5 mg/ml) were hybridized overnight at 65°C, incubated with anti-digoxygenin AP antibody (Roche), and then incubated with NBT/BCIP (Roche). The sections were immediately imaged or counterstained with eosin before imaging with a Zeiss Discovery Stereomicroscope V12.
ChIP-seq.
Chromatin immunoprecipitation of p300, a transcriptional coactivator, followed by high-throughput sequencing (ChIP-seq) of E11.5 neural tubes from the posterior hindbrain to the hindlimb was performed as previously described for E11.5 forebrain, midbrain, and limb (Visel et al., 2009). The Atoh1-FLAG ChIP-seq from P5 cerebella was performed as described previously (Flora et al., 2009). The recovered DNA was submitted for Solexa sequencing at the Center for Cancer Epigenetics Solexa Sequencing Core at M. D. Anderson (Houston, TX), where the sequencing libraries were prepared and sequenced on the Illumina Solexa GAII pipeline according their standard operating procedures (Klisch et al., 2011). ChIP regions along with 30 vertebrate species conservation are viewed in University of California Santa Cruz (UCSC) browser, NCBI37/mm9 mouse build (Kent et al., 2002).
Bioinformatics.
The following enhancer sequences of Atoh1-regulated genes in the dorsal neural tube were analyzed with MEME (Bailey and Elkan, 1994). Atoh1 enhancer A and B (Chr6: 64683369-64684709), Barhl1 enhancer, Barhl2 enhancer, Klf7 subset of site A, Rassf4 subset of site A (Chr6: 116620232-116621468), Selm site B, Smad7 subset of site A (Chr18: 75594185-75594975), and Rab15 site A (for coordinates, see Table 3). MEME was asked to find 10, 8 bp motifs that occurred in every sequence (one per sequence, minimum and maximum width = 8). As a control, sequences 2000 bp upstream of the enhancers were subject to the same analysis.
Table 3.
ChIP-seq sites functionally tested: Atoh1-FLAG ChIP-seq sites
| Enhancer name | Chr | Coordinates (mm9/NCBI37) | Summit | Fold change | No. bp | Gene | PubMed ID | Gene coordinates | Str | Distance from gene | Expr in dI1 | |
|---|---|---|---|---|---|---|---|---|---|---|---|---|
| Atoh1 site C | chr6 | 64677583 | 64678058 | 193 | 88.18 | 475 | Atoh1 | NM_007500 | chr6:64679140–64681229 | + | 1 kb 5′ | No |
| Atoh1 enh A | chr6 | 64683369 | 64683681 | 136 | 31.7 | 312 | Atoh1 | NM_007500 | chr6:64679140–64681229 | + | 2 kb 3′ | Yesa |
| Atoh1 enh B | chr6 | 64684413 | 64684709 | 136 | 54.59 | 296 | Atoh1 | NM_007500 | chr6:64679140–64681229 | + | 3 kb 3′ | Yesa |
| Barhl1 enh | chr2 | 28764004 | 28764321 | 115 | 83.99 | 317 | Barhl1 | NM_019446 | chr2: 28763203–28771942 | − | 3′ area | NDb |
| Barhl2 enh | chr5 | 106880777 | 106881319 | 346 | 62.99 | 542 | Barhl2 | NM_001005477 | chr5:106887185–106881542 | − | 5.9 kb 3′ | Yes |
| Grem2 site A | chr1 | 176790554 | 176790790 | 139 | 75.59 | 236 | Grem2 | NM_011825 | chr1:176763916–176851950 | − | Intronic | No |
| Klf7 subset of site A | chr1 | 64113406 | 64113823 | 270 | 71.39 | 417 | Klf7 | NM_033563 | chr1:64082247–64167963 | − | Intronic | Yesc |
| Rab15 site A | chr12 | 77921622 | 77921867 | 179 | 41.99 | 245 | Rab15 | NM_134050 | chr12:77898950–77923511 | − | Intronic | Yes |
| Rassf4 subset of site A | chr6 | 116620232 | 116620542 | 242 | 42.77 | 310 | Rassf4 | NM_178045 | chr6:116583026–116623854 | − | Intronic | Yesc |
| Rassf4 subset of site A | chr6 | 116620826 | 116621468 | 428 | 50.4 | 642 | Rassf4 | NM_178045 | chr6:116583026–116623854 | − | Intronic | Yesc |
| Rassf4 site B | chr6 | 116623775 | 116623937 | 68 | 41.99 | 162 | Rassf4 | NM_178045 | chr6:116583026–116623854 | − | Proximal 5′ | Very little |
| Selm subset of site A | chr11 | 3309170 | 3309376 | 150 | 18.87 | 206 | Selm | NM_053267 | chr11:3414705–3417354 | + | 105 kb 5′ | Yesc |
| Selm site B | chr11 | 3415722 | 3415940 | 101 | 49.06 | 218 | Selm | NM_053267 | chr11:3414705–3417354 | + | Intronic | Yes |
| Selm site C | chr11 | 3427046 | 3427394 | 161 | 42.27 | 348 | Selm | NM_053267 | chr11:3414705–3417354 | + | 9.7 kb 3′ in Smtn | No |
| Selm site D | chr11 | 3427851 | 3428180 | 119 | 54.59 | 329 | Selm | NM_053267 | chr11:3414705–3417354 | + | 10.5 kb 3′ in Smtn | No |
| Smad7 subset of site A | chr18 | 75594185 | 75594482 | 115 | 83.99 | 297 | Smad7 | NM_001042660 | chr18:75527019–75555588 | + | 38 kb 3′ in Gm672 | Yesc |
| Smad7 subset of site A | chr18 | 75594728 | 75594975 | 83 | 50.39 | 247 | Smad7 | NM_001042660 | chr18:75527019–75555588 | + | 38 kb 3′ in Gm672 | Yesc |
Atoh1-FLAG ChIP is from P5 cerebella. In italics are previously identified Atoh1 enhancers (Helms et al., 2000; Saba et al., 2005; Kawauchi and Saito, 2008).
aAtoh1 enhancer A and B together direct expression to dI1 (Helms et al., 2000).
bThe Barhl1 enhancer drives expression to the developing granule cell layer but is not determined (ND) for dI1's (Kawauchi and Saito, 2008).
cThe larger region detected from the p300 ChIP was tested in GFP reporter assays (Table 2).
Chick in ovo electroporation.
Fertilized White Leghorn chick eggs were obtained from the Texas A&M Poultry Department. The neural tube of chick embryos staged HH14–HH17 (Hamburger and Hamilton, 1992) were injected with 1 μg/μl of the enhancer-GFP plasmid construct and 1 μg/μl of the appropriate bHLH transcription factor plasmid and electroporated as previously described (Nakada et al., 2004a). Embryos were harvested after 36–48 h at 38°C. bHLH plasmids used for this study were made in the pMiWIII expression vector: myc-tagged rat Ascl1-AQ (Mash1 NR-AQ, myccontrol) inactive mutant control (Nakada et al., 2004a), BOSS-tagged mouse Atoh1 (BOSS-Math1, BOSSAtoh1) (Helms et al., 2000), and myc-tagged rat Ascl1 in which five myc tags were inserted at the N terminus of Ascl1 (Mash1, mycAscl1) (Nakada et al., 2004a).
Results
Microarray analyses identified transcripts enriched in the Atoh1-specific population of the dorsal neural tube relative to the neighboring Neurog1-specific population
To determine downstream targets of Atoh1 unique to the Atoh1 lineage, we identified transcripts enriched specifically in the dorsal progenitor and interneuron 1 (dP1/dI1) populations located adjacent to the roof plate in the developing neural tube. The dP1 domain begins expressing Atoh1 and differentiates into the dorsal interneuron 1 (dI1) population marked by LIM-HD transcription factors, Lhx2 and Lhx9 (Bermingham et al., 2001; Gowan et al., 2001). Similarly, the neighboring progenitor population (dP2) is marked by Neurog1 and differentiates into the dorsal interneuron 2 (dI2) population as marked by Lhx1 and Lhx5. To identify transcripts present in the Atoh1-derived (dP1/dI1) domains that are distinct from the Neurog1-derived (dP2/dI2) domains, we compared transcripts in these two related, but discrete, cell populations.
Two transgenic mouse lines, Atoh1BAC-GFP (Raft et al., 2007) and dNeurog1-GFP (Nakada et al., 2004b), drive GFP either to the dP1/dI1 domains or the dP2/dI2 domains, respectively. Immunostaining with an antibody to each neighboring population, Neurog1 antibody for Atoh1BAC-GFP and Atoh1 antibody for dNeurog1-GFP in E10.5 neural tubes, demonstrates the restriction of GFP to dP1/dI1 or dP2/dI2, respectively (Fig. 1A). GFP+ and GFP− cells from E10.5 neural tubes from Atoh1BAC-GFP and dNeurog1-GFP mice were separated by FACS. RT-PCR of RNA extracted from these populations showed good separation between GFP+ and GFP− cells (Fig. 1B). In Atoh1BAC-GFP sorted cells, Atoh1 and GFP transcripts are enriched in GFP+ cells, while GAPDH was present in both populations. Likewise, RT-PCR of RNA sorted from the dNeurog1-GFP population showed enrichment in transcripts of Neurog1 and GFP. Two microarrays were performed from RNA of GFP+ cells from the Atoh1BAC-GFP and dNeurog1-GFP sorts to determine transcripts enriched specifically in the Atoh1-derived population rather than general neuronal expressed genes at this stage (GEO Series accession number GSE23089).
The intersection of two independent microarray experiments comparing Atoh1BAC-GFP and dNeurog1-GFP sorted cells found 520 Affymetrix probes were more than twofold enriched in the Atoh1 population, corresponding to 443 genes (Fig. 1C). Genes known to be enriched in the dI1 population, Atoh1 (Helms et al., 2000), Lhx2/9 (Bermingham et al., 2001; Gowan et al., 2001), Barhl1 (Bermingham et al., 2001), and Barhl2 (Saba et al., 2005), were more than fourfold enriched in the Atoh1 marked population (Table 1). This finding confirms successful isolation of dP1/dI1 cells and illustrates the quality of our microarray analyses. The microarray data were further validated by RT-qPCR of Atoh1 and Neurog1 in the Atoh1BAC-GFP+ cells relative to the dNeurog1-GFP+ cells (Fig. 1D). The RT-qPCR confirms that we have good enrichment of Atoh1 in the Atoh1BAC-GFP+ cells (10-fold) and Neurog1 in the dNeurog1-GFP+ cells (13-fold). In situ probes were generated for 21 genes that were more than twofold enriched in the Atoh1BAC-GFP+ cells, had fluorescence values of >100 in at least one of the microarray samples, and were of biological interest. Fourteen of these (67%) gave detectable ISH signal in E10.5 neural tubes and/or P0 cerebella. Ten of these 14 candidate genes gave clear ISH signal in the dorsal most domain at E10.5 or by RT-qPCR (Figs. 1D, 2A,B) and were pursued for further analysis (Table 1). A complete list of genes enriched in the Atoh1 population will be provided upon request or at http://www8.utsouthwestern.edu/utsw/cda/dept120915/files/150735.html.
Table 1.
Transcripts enriched in the Atoh1 lineage over the Neurog1 lineage in the dorsal neural tube
| No. | Fold change arrays no. 1 | Fold change arrays no. 2 | Gene symbol | Gene name |
|---|---|---|---|---|
| 1 | 6.7 | 10.5 | Barhl2 | BarH-like 2 |
| 2 | 10.0 | 10.3 | Atoh1 | Atonal homolog 1 |
| 3 | 8.4 | 8.6 | Lhx2 | LIM homeobox protein 2 |
| 4 | 4.7 | 7.3 | Barhl1 | BarH-like 1 |
| 5 | 8.3 | 6.2 | Lhx9 | LIM homeobox protein 9 |
| 6 | 5.8 | 5.8 | Grem2 | Gremlin 2 homolog, cysteine knot superfamily (Xenopus laevis) |
| 7 | 6.9 | 5.7 | Rassf4 | Ras association (RalGDS/AF-6) domain family 4 |
| 8 | 4.8 | 5.2 | Gsg1l | GSG1-like |
| 9 | 4.5 | 5.1 | Gmpr | Guanosine monophosphate reductase |
| 10 | 7.1 | 4.3 | Smad7 | MAD homolog 7 (Drosophila) |
| 11 | 3.1 | 4.0 | Rab15 | RAB15 member RAS oncogene family |
| 12 | 3.3 | 3.6 | Selm | Selenoprotein M |
| 13 | 3.2 | 2.8 | Ntrk3 | Neurotrophic tyrosine kinase, receptor, type 3 (TrkC) |
| 14 | 3.8 | 2.7 | Klf7 | Kruppel-like factor 7 (ubiquitous) |
| 15 | 3.8 | 2.3 | Tle4 | Transducin-like enhancer of split 4, homolog of Drosophila E(spl) |
Subset of genes with more than twofold change in two sets of Affymetrix microarrays that were pursued in Figure 2. The genes in bold are known to be downstream of Atoh1 and are previously described in the literature (Ben-Arie et al., 1997, 2000; Helms and Johnson, 1998; Bermingham et al., 1999, 2001; Gowan et al., 2001; Saba et al., 2005; Kawauchi and Saito, 2008).
Several newly identified genes are specific to the dorsal neural tube Atoh1 lineage and require Atoh1 for expression
Transcripts enriched in the Atoh1-derived population (Table 1) were tested for their specificity to the Atoh1 lineage by comparing their expression in wild-type versus Atoh1 knock-out mice by ISH (Ben-Arie et al., 1997). In Atoh1 mutants, dI1 interneurons are not generated, but rather transfate to cells with either roof plate or dI2 identity (Bermingham et al., 2001; Gowan et al., 2001). ISH probes to Gmpr, Grem2, Gsg1l, Klf7, Ntrk3 (TrkC), Rab15, Rassf4, and Tle4 all gave ISH signal in the dorsal-most domain of E10.5 neural tubes that disappeared in the Atoh1 knock-out (Fig. 2A), demonstrating that these transcripts are in the dP1/dI1 populations and require Atoh1 for expression. Note that some of these genes, Klf7, Ntrk3, Rassf4, and Tle4, have mRNA expression in other domains of the dorsal neural tube and may be activated by other bHLH factors. ISH probes to Selm and Smad7 gave robust signal in P0 cerebella (Fig. 2C) but did not give detectable signal at E10.5 (data not shown), even though they had clear signals in the microarray experiments (see GEO Series accession number GSE23089). By qPCR, Selm and Smad7 transcripts are enriched in Atoh1BAC-GFP+ sorted cells compared with GFP− cells fivefold to sixfold (Fig. 2B). In comparison, Atoh1 and Rab15 transcripts (which are clearly detectable by ISH) had 172-fold and 42-fold changes, respectively (Fig. 2A,B). Thus, using microarray analyses, ISH, and RT-qPCR, we identified 10 genes enriched in the dP1/dI1 populations that are potential subtype-specific targets of Atoh1 (Table 1, Fig. 2A,B).
ChIP-seq identifies dI1 enhancers
To assess whether these Atoh1 downstream genes are direct Atoh1 targets and to identify Atoh1-responsive dI1-specific enhancers, we used ChIP-seq data obtained from FLAG-tagged Atoh1 knock-in mice (Flora et al., 2009; Klisch et al., 2011). Due to the paucity of Atoh1-expressing cells in the E10.5 neural tube, Atoh1-expressing granule precursor cells from postnatal day 5 cerebella were used to identify Atoh1-bound sites in vivo that we further test for function in the neural tube. Thus, this analysis will identify targets that are common to both tissues. Identification of Atoh1-FLAG ChIP-seq bound sites at previously characterized Atoh1 enhancers A and B (Helms et al., 2000) (see Fig. 4D), Barhl1 enhancer (Kawauchi and Saito, 2008), and Barhl2 enhancer (Saba et al., 2005) (Table 3), confirms these genes as direct targets of Atoh1 in vivo and demonstrates the robustness of the ChIP-seq experiment.
Figure 4.

Atoh1-FLAG bound sites were tested for enhancer activity. A, B, Rab15 site A in an intron of Rab15 directs expression to the dI1 domain in GFP reporter assays in the chick neural tube as detected by GFP antibody staining (green) colocalized with Lhx2/9 antibody staining (red) (arrows). C, D, Atoh1 site C (∼1 kb upstream of Atoh1) driving GFP gives partial expression in the dI1 domain (arrowhead), but not significantly. This is consistent with the previous report by our laboratory that a transgenic line of 15 kb sequence 5′ of the Atoh1 gene does not drive LacZ reporter expression in mice (Helms et al., 2000). E, F, Grem2 had only one Atoh1-FLAG peak within 200 kb of the gene in the Grem2 intron. Grem2 site A did not appear to drive GFP to the dI1 domain. Atoh1-FLAG sites (green), gene structure (blue), and vertebrate conservation of 30 species (purple) are displayed from UCSC browser (Kent et al., 2002). E-boxes matching the consensus CANNTG (light blue lines) and the newly identified AMCAGMTG (E*) common E-box are shown. The insets highlight the dI1 domain [top, GFP antibody staining (green); bottom, GFP (green) and Lhx2/9 (red) antibody staining].
To identify candidate enhancer regions in the Atoh1-specific lineage targets, we searched for Atoh1-FLAG binding sites located within 200 kb 5′ and 3′ of each gene (Table 1) (Klisch et al., 2011). Given that there are on average 11 Atoh1-FLAG binding sites per gene, we limited our analysis to genes that had an experimentally tractable number of binding sites surrounding the gene of interest (Figs. 3, 4; Tables 2, 3). These Atoh1 DNA binding regions were tested for their activity during neural tube development by assaying their ability to drive GFP expression in enhancer-reporter constructs introduced into the chick neural tube by electroporation (Timmer et al., 2001). Five of the 11 genomic regions tested, Klf7 site A, Rassf4 site A, Smad7 site A, Selm site B, and Rab15 site A drove appropriate GFP expression to dI1 interneurons (Figs. 3B,D,G,K, 4A) as determined by coexpression of GFP with the dI1 lineage markers Lhx2/9.
Figure 3.
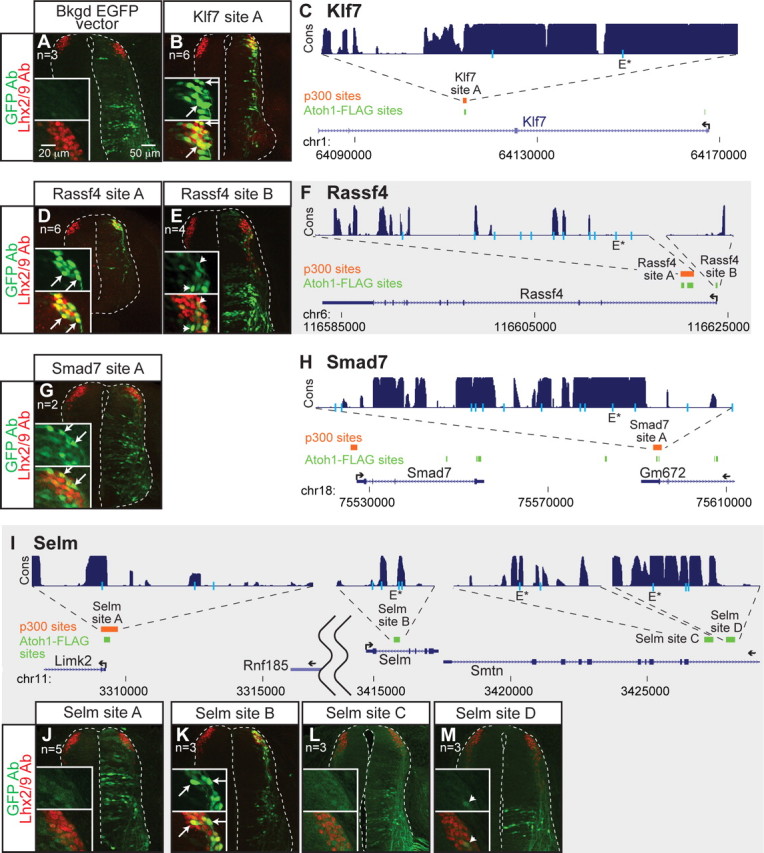
Identification of multiple enhancers of Atoh1 target genes that direct expression to the dI1 population by Atoh1-FLAG ChIP-seq. ChIP of Atoh1-FLAG (green), a FLAG-tagged Atoh1 knock-in mouse, from P5 cerebella, identified several binding regions near Atoh1 downstream genes (C, F, H, I). Regions bound by p300 (orange), a transcriptional coactivator, from E11.5 neural tubes are also noted. Gene structures are shown in blue and conservation across 30 different vertebrate species for the tested sites is shown in purple (UCSC browser) (Kent et al., 2002). E-boxes matching the consensus CANNTG (light blue lines) and the identified common E-box sequence, AMCAGMTG (E*), are shown. Genomic sites were tested for enhancer activity in GFP reporter assays in the chick neural tube with the right side being the electroporated side. GFP expression is labeled with GFP antibody (green) and the dI1 neurons labeled with Lhx2/9 antibody (red) (A, B, D, E, G, J–M). The insets highlight the dI1 domain [top, GFP antibody staining (green); bottom, GFP (green) and Lhx2/9 (red) antibody staining]. The arrows indicate double-labeled cells (B, D, G, K), and the arrowheads indicate low level of double labeling (E, M). The EGFP vector with no enhancer sequence (A) gives some background fluorescence in the ventral neural tube that does not overlap with the dI1 domain (A, inset).
Table 2.
ChIP-seq sites functionally tested: p300 ChIP-seq sites
| Enhancer name | Chr | Coordinates (mm9/NCBI37) | Peak height | No. bp | Gene | PubMed ID | Gene coordinates | Str | Distance from gene | Expr in dI1 | |
|---|---|---|---|---|---|---|---|---|---|---|---|
| Klf7 site A | chr1 | 64113076 | 64113901 | 9 | 825 | Klf7 | NM_033563 | chr1:64082247–64167963 | − | Intronic | Yes |
| Rassf4 site A | chr6 | 116620126 | 116621501 | 15 | 1375 | Rassf4 | NM_178045 | chr6:116583026–116623854 | − | Intronic | Yes |
| Selm site A | chr11 | 3309051 | 3309676 | 9 | 625 | Selm | NM_053267 | chr11:3414705–3417354 | + | 105 kb 5′ | No |
| Smad7 site A | chr18 | 75593601 | 75595451 | 9 | 1850 | Smad7 | NM_001042660 | chr18:75527019–75555588 | + | 38 kb 3′ in Gm672 | Yes |
p300 ChIP is from E11.5 neural tube.
Atoh1 bound regions that gave enhancer activity had some shared properties. For example, four of the five active enhancers are within introns of their respective genes (Klf7 site A, Rassf4 site A, Selm site B, and Rab15 site A) (Figs. 3C,F,I, 4B). The exception is Smad7 site A, which is located ∼38 kb 3′ of Smad7 in the Gm672 gene (Fig. 3H). Gm672 is expressed in the dP1/dI1 Atoh1 population based on the microarray data, but it is not specific to this population. One tested intronic Atoh1-FLAG binding region, Grem2 site A, did not give enhancer activity (Fig. 4E,F). Notably, three of the five enhancers, Klf7 site A, Rassf4 site A, and Smad7 site A, are also identified as active enhancers since they are also bound by the histone acetyltransferase, p300, as detected in ChIP-seq from E11.5 neural tubes (A. Visel and L. Pennacchio, unpublished observations) (Table 2) (Goodman and Smolik, 2000; Visel et al., 2009). However, the presence of p300 on a site does not ensure efficient dI1 expression as demonstrated by Selm site A (Fig. 3I,J). Furthermore, there are many genomic regions where Atoh1 is bound in cerebellar tissue that do not drive significant enhancer activity to the dI1 domain: Rassf4 site B, Selm site A, Selm site C, Selm site D, Atoh1 site C, and Grem2 site A (Figs. 3E,J,L,M, 4C,E). Whether these regions can drive expression in the developing cerebellum is not known. However, the inability of Atoh1 site C to direct dP1/dI1 specific expression is consistent with the inability of a 15 kb sequence 5′ of the Atoh1 gene, which includes the Atoh1 site C, to direct LacZ reporter expression in transgenic mice (Helms et al., 2000). Together, five new dI1 enhancers were identified, four of which are located in introns: Klf7 site A, Rassf4 site A, Selm site B, Smad7 site A, and Rab15 site A.
Newly identified enhancers are responsive to Atoh1
The identified enhancers, Klf7 site A, Rassf4 site A, Selm site B, Smad7 site A, and Rab15 site A, were tested for their response to Atoh1. Coelectroporation of enhancer-GFP constructs with an epitope-tagged Atoh1 expression vector (Helms et al., 2000) into chick neural tubes gave a marked increase in GFP fluorescence intensity for each of the enhancers tested compared with an inactive bHLH mutant control (Fig. 5). GFP fluorescence was quantified for cells that coexpressed both GFP and the bHLH factor (Fig. 5G). To test the specificity of this response, we also tested the responsiveness of the enhancer to another neural bHLH factor, Ascl1. An epitope-tagged Ascl1 did not significantly activate any of the enhancers except for Rassf4 site A and Rab15 site A, highlighting the specificity of these enhancers for Atoh1 (Fig. 5B″,C″,D″,E″,F″,G). Of the two exceptions, Rassf4 site A may be responsive to Ascl1 in this context since this regulatory element drives GFP expression to some dI3 Ascl1 lineage cells in transgenic mice (Fig. 6C), Rassf4 has faint expression in the Ascl1 domain by ISH (Fig. 2A), and this site is bound by Ascl1 by ChIP (M. D. Borromeo and J. E. Johnson, unpublished observation). The lack of specificity in the response of the Rab15 enhancer is not known; however, it may be due to a missing negative regulatory element from the sequence used here.
Figure 6.

Enhancers Rassf4 site A and Klf7 site A drive GFP expression to Atoh1-derived domains in transgenic mice. A–E, Rassf4 site A drives GFP expression preferentially to the Atoh1-derived domains of the developing neural tube. Endogenous GFP fluorescence colocalizes with Atoh1+ (B) and Lhx2/9+ (C) cells (arrows). Very light GFP fluorescence colocalizes with Islet1/2+ cells (arrowheads; C, inset; gain increased to visualize colocalization), a marker for dI3 cells. Colocalization of Lhx1/5, a marker for dI2 cells, can only be visualized by adding GFP antibody to increase the GFP signal (compare D, E, arrowheads). F–H, Rassf4 site A drives GFP expression to the external granule cell layer of the developing cerebellum at P0. Endogenous GFP colocalizes with Atoh1 antibody staining (G, arrows) and the differentiating granule cells marked by Neurod antibody (H, arrows). I–L, Klf7 site A drives GFP expression to the dI1 domain as well as dI2 and dI3. Endogenous GFP fluorescence colocalizes with Atoh1+ (J, arrows), Lhx2/9+ cells (K, arrows), Lhx1/5+ (L, arrows), and barely with Islet1/2+ cells (K, arrowhead; inset; gain increased to visualized colocalization).
Functional Atoh1 enhancers share a common E-box
Class II (Massari and Murre, 2000) tissue-specific bHLH factors form heterodimers with E-proteins (E2–2, E2A, and HEB) to bind an E-box defined as CANNTG where N is any base. We looked to see whether we could find a common E-box motif in the enhancer sequences. Using the Atoh1-FLAG binding limits of these five enhancers combined with the previously identified, Atoh1 enhancer A and B, Barhl1 enhancer, and Barhl2 enhancer for a total of eight enhancer sequences (Table 3), we searched for common 8 bp motifs using MEME (Bailey and Elkan, 1994). One of the common motifs was an extended E-box (Fig. 5H), AMCAGMTG, where M is A/C. This is a subset of the extended E-box identified from genome-wide analysis of Atoh1 binding sites in the cerebellum called AtEAM, RMCAKMTGKY, where R is G/A, K is G/T, and Y is C/T (Fig. 5I) (Klisch et al., 2011). The same MEME analysis performed on control sequences 2000 bp upstream of each enhancer did not give any recognizable E-box motif, indicating that the motif identified is enriched in Atoh1-responsive enhancers.
The functionality of the common E-box was tested in the context of Klf7 site A and Rassf4 site A. Klf7 site A has two E-boxes meeting the general CANNTG consensus (Fig. 3C) designated Emut 1 and E*mut 2, where the asterisk (*) indicates the extended common E-box found in Figure 5H. These sites were mutated and tested for their sensitivity to Atoh1 compared with an inactive bHLH mutant control in the chick enhancer assay. Mutation of either E-box causes a significant decrease in the ability of the enhancer to be induced by Atoh1. However, even with both E-boxes mutated, the Klf7 enhancer is still responsive to Atoh1 (Fig. 5J), suggesting Atoh1 may also indirectly regulate this enhancer. Also notable is the lack of distinction between Atoh1 responsiveness of the two E-boxes, even though only one of them matches the shared motif. Similarly, the Rassf4 site A enhancer does not require the E-box with the shared motif (Fig. 5K); however, this enhancer has a cluster of 11 E-boxes (Fig. 3F) that likely contribute to the activation of this enhancer.
Rassf4 and Klf7 enhancers drive GFP expression to dI1 neurons in transgenic mice
Rassf4 site A and Klf7 site A were tested in transgenic mice for their ability to drive GFP expression to the Atoh1-derived dorsal neural tube (dP1/dI1). Notably, Rassf4 site A recapitulates the expression of the Atoh1 autoregulatory enhancer (Helms et al., 2000) (Fig. 6A) and drives prominent GFP expression to the Atoh1-derived domain as marked by Atoh1 and Lhx2/9 (Fig. 6B,C). Only faint GFP expression colocalizes with Lhx1/5 (Fig. 6E) marking dI2 interneurons, and Islet1/2 (Fig. 6C, inset) marking dI3 interneurons, and can only be seen upon increasing the GFP gain or adding GFP antibody to increase the fluorescence signal. Furthermore, Rassf4 site A drives GFP to the external granule cell layer (EGL) of the developing cerebellum marked by Atoh1 antibody and differentiating granule cells marked by Neurod antibody (Fig. 6F–H) (Helms et al., 2001) confirming this enhancer is active in other Atoh1-derived domains.
Klf7 site A drives GFP to Atoh1+ and Lhx2/9+ cells (Fig. 6J,K) marking the dP1 and dI1 domains. This enhancer, however, also drives GFP reasonably well to Lhx1/5+ and somewhat to Islet1/2+ cells (Fig. 6K,L). This is consistent with the ISH of Klf7 (Fig. 2A), where it appears much of the Klf7 transcript is expressed laterally in the mantle zone of the E10.5 neural tube. Together, two Atoh1-responsive enhancer elements identified by in vivo binding of Atoh1 are sufficient to direct expression of a reporter gene in an Atoh1-like pattern in transgenic embryos.
Rab15 and Selm are targets of Atoh1 in other Atoh1-derived neuronal subtypes
As discussed above, Klf7, Rab15, Rassf4, Selm, and Smad7 are direct transcriptional targets of Atoh1 in the developing dorsal neural tube. Analysis of mRNA expression of these genes by ISH found that all of these genes are expressed in the developing cerebellum (Fig. 2C) and disappear in the Atoh1 mutant that lack a cerebellar EGL (Ben-Arie et al., 1997). Furthermore, Rab15 and Selm are also found in Atoh1 lineage cells in the inner ear and Merkel cells in the vibrissae (Fig. 2D,E). Strikingly, these two genes were also found to be in common among Atoh1 lineages by intersecting genes identified in our microarrays of the dP1/dI1 lineage with microarray results of Atoh1-GFP sorted populations from the inner ear (N. Segil and A. Groves, House Ear Institute, unpublished data) and Merkel cells from the skin (Haeberle et al., 2004).
Discussion
Atoh1 target genes have diverse biological functions and are neuronal subtype specific
bHLH transcription factors have common roles in inducing neuronal differentiation, but distinct roles in neuronal subtype specification, functions that are contingent on developmental context (Parras et al., 2002; Nakada et al., 2004a; Powell et al., 2004; Reeves and Posakony, 2005). To determine Atoh1-specific targets, we first identified transcripts specific to the Atoh1 lineage and not common to the neighboring dorsal Neurog1 lineage. Significantly, we identified five new Atoh1-specific targets and their responsive enhancers using a combination of microarray expression data, ChIP-seq experiments, and enhancer-reporter assays.
Previously, known direct targets of Atoh1 in vivo in the developing neural tube or cerebellum included the homeodomain transcription factors, Barhl1 and Barhl2 (Saba et al., 2005; Kawauchi and Saito, 2008), the Sonic hedgehog transcriptional effector, Gli2 (Flora et al., 2009), and Atoh1 itself (Helms et al., 2000). The direct Atoh1 targets identified here have diverse functions that go beyond the identification of transcription factor cascades. Kruppel-like factor 7 (Klf7), a transcription factor implicated in nociceptive neuron development in the dorsal root ganglion (Lei et al., 2005), upregulates the cyclin-dependent kinase inhibitor, p21 (Laub et al., 2005). Interestingly, in Merkel cell carcinomas in which Atoh1 plays a tumor suppressor role, Atoh1 upregulates Ntrk1 (TrkA) and p21 expression leading to cell cycle arrest (Bossuyt et al., 2009), which together with our evidence could be through Klf7. Notably, in dI1 neurons, Ntrk3 (TrkC), is enriched in the Atoh1-derived domain (Fig. 2A), indicating that Atoh1 may activate different neurotrophic receptor tyrosine kinases under different contexts.
Two of the target genes discovered are associated with the Ras pathway. Activated Ras proteins are usually associated with growth and proliferation; however, some Ras effector proteins such as Rassf4, Ras association (RalGDS/AF-6) domain family 4, are thought to be tumor suppressor genes that bind activated K-Ras (Eckfeld et al., 2004). As a target of Atoh1, Rassf4 may reduce proliferation allowing the differentiation of dP1 cells into dI1 neurons. Rab15, a small GTPase that is a member of the RAS oncogene family, appears to inhibit early endocytosis and recycling in cultured cells (Zuk and Elferink, 2000). An attractive hypothesis is that expression of Rab15 in dP1 cells may inhibit the endocytosis of a receptor, perhaps Notch or BMP receptor, and allow for differentiation of the cell. However, it also may play a role in neuronal migration as has been implicated for Rnd2, the small GTPase found as a Neurog2 target (Heng et al., 2008), and other Rab GTPases (Kawauchi et al., 2010).
The last two genes discovered likely play a role in the proliferation versus differentiation decision during development. Selenoprotein M (Selm) is enriched in the brain, where it may serve a protective role in Alzheimer's disease possibly by inhibiting β/γ-secretase activity and decreasing Tau phosphorylation (Korotkov et al., 2002; Hwang et al., 2005; Yim et al., 2009). The role of Selm in inhibiting β/γ-secretase may be reconciled with a possible developmental signaling mechanism that is activated by Atoh1 to inhibit γ-secretase, thereby preventing the cleavage of the Notch intracellular domain allowing for differentiation of progenitor cells (Louvi and Artavanis-Tsakonas, 2006). Last, Smad7 inhibits TGFβ signaling through interactions with the type I receptor (Hayashi et al., 1997) and can even interact with β-catenin in cancer cells to promote cell adhesion (Hoover and Kubalak, 2008). Future work will be required to address exactly what these Atoh1 targets are doing in the Atoh1 lineages and whether their expression is specifically needed for Atoh1 neuronal subtypes to develop and function in proprioceptive neuronal circuitry.
Other studies have identified genes downstream of Atoh1, but they likely represent downstream effectors of the differentiation role shared by other bHLH factors (Castro et al., 2006; Krizhanovsky et al., 2006; Seo et al., 2007; Miesegaes et al., 2009). For example, Hes5 is induced by Atoh1 in E14.5 cerebellum (Krizhanovsky et al., 2006), but is also induced by Neurog2 in P19 cells, suggesting it is a common target of these bHLH transcription factors (Seo et al., 2007). Furthermore, the Hes5 Drosophila homolog, E(Spl), was found to be a target of both Atonal and Scute (Reeves and Posakony, 2005; Aerts et al., 2010). Although multiple genes have been identified downstream of Atoh1 (such as Nr2f6 and Cbln2) or Atonal (mouse homologs Cdkn1a and Tacr3) (Powell et al., 2004; Krizhanovsky et al., 2006; Sukhanova et al., 2007; Miesegaes et al., 2009; zur Lage and Jarman, 2010), additional experiments are required to determine whether these are direct and constitute neuronal subtype-specific targets. Recently, genome-wide scale identification of Atonal targets has suggested that Atonal does not directly activate terminal differentiation genes, but instead activates molecules in major signaling pathways (Aerts et al., 2010); however, another analysis found that Atonal was able to directly activate at least one differentiation gene (Cachero et al., 2011), and it is known that the related bHLH factor, chick Atoh7, can directly activate a terminal differentiation gene in the retina (Skowronska-Krawczyk et al., 2005). Together, analyses of targets for Atonal and Atoh1 indicate that these transcription factors can turn on genes with a wide array of functions including transcription factors, signaling pathways, and terminal differentiation genes, which has also been shown for the cerebellum (Klisch et al., 2011).
cis-regulation of Atoh1-specific targets
With the identification of several Atoh1-specific targets, we have laid the foundation for understanding how Atoh1 can activate specific targets relative to other bHLH transcription factors. Two models have been proposed for the activation of Atoh1-specific targets: either Atoh1 binds a unique E-box consensus that is different from other bHLH proteins as has been suggested in Drosophila (Powell et al., 2004), or coregulatory sites are required to bring in cofactors that work with Atoh1 to drive cell type-specific expression similar to Ascl1 and POU domain transcription factors (Castro et al., 2006) or the Drosophila ETS transcription factor, Pointed, and Atonal (zur Lage et al., 2004; Sukhanova et al., 2007).
A common extended E-box, AMCAGMTG, where M is A/C (Fig. 5H), was identified using the sequence from eight Atoh1-responsive enhancers. This is a subset of the AtEAM motif identified in Atoh1-bound regions from cerebellum genomic analysis (Fig. 5I) (Klisch et al., 2011). This common E-box was highly conserved in six of the eight enhancers (Figs. 3, 4) (Kent et al., 2002; Rhead et al., 2010). Species conservation often highlights regulatory areas of interest (Visel et al., 2008), but conservation is not detected in all regulatory binding sites (Jeong et al., 2008; Wilson and Odom, 2009; Schmidt et al., 2010). Furthermore, although we identified a shared E-box among these Atoh1 target enhancers, no distinct activity could be attributed to this E-box over other E-boxes present (Fig. 5J,K). An alignment of the Atoh1 common E-box to consensus binding sites identified for Atonal, Ascl1, Neurog/Neurod1, and MyoD (Bertrand et al., 2002; Powell et al., 2004; Castro et al., 2006; Seo et al., 2007; Cao et al., 2010) reveals only subtle differences (Fig. 5I). The differences between the Atoh1 and ato E-boxes (Fig. 5I, arrowhead) (Ben-Arie et al., 1996, 2000; Chien et al., 1996; Wang et al., 2002) may be due to the differences in function with which the targets were identified (neuronal subtype specification vs differentiation) or the few targets used to form both E-box sequences (Powell et al., 2004; zur Lage and Jarman, 2010). Slight differences in the bHLH consensus sequences may represent true binding preferences in vivo; however, it seems more likely that bHLH factors work with other factors to carry out neuronal subtype-specific programs. Indeed, mutating both E-boxes in the Klf7 site A enhancer did not completely abolish enhancer activity (Fig. 5J), suggesting Atoh1 may activate an intermediate cofactor that contributes to tissue-specific expression.
To identify potential transcription factors that work with Atoh1, we performed a preliminary MEME analysis and uncovered several motifs enriched in the eight test enhancers over control sequences (H. C. Lai and J. E. Johnson, unpublished observation); however, these motifs were novel sequences with no known transcription factor binding sites, making it difficult to identify a good candidate cofactor. The ETS binding motif, which we might expect to find due to Pointed being a cofactor of Atonal (zur Lage et al., 2004; Sukhanova et al., 2007), was found in both test and control sequences. Last, Zic-related factors have been implicated in regulating Atoh1-related cell type gene expression (Ebert et al., 2003; Bertrand and Hobert, 2009), and six Atoh1-responsive enhancers contain the motif GGAGCWG, where W is A/T, which is within the sequence identified as the Zic1 binding region in the Atoh1 enhancer (Ebert et al., 2003).
In summary, we identified five in vivo targets of Atoh1 in the developing spinal cord that represent genes enriched in the Atoh1-expressing cells in the dorsal neural tube, and demonstrate that proneuronal bHLH factors have unique targets. Finding neuronal subtype-specific targets is essential for a basic understanding of neuronal specification processes and will allow for a better framework to understand differentiation of specific neuronal subtypes from embryonic stem cells. Furthermore, identifying the functions of these Atoh1-specific targets within the Atoh1 lineage may reveal tractable therapeutic targets for medulloblastomas (Wechsler-Reya, 2003; Zhao et al., 2008; Flora et al., 2009) or Merkel cell carcinomas (Bossuyt et al., 2009) in which Atoh1 is misregulated.
Notes
Supplemental material for this article is available at http://www8.utsouthwestern.edu/utsw/cda/dept120915/files/150735.html. This is the Johnson Laboratory website, which has a link to the supplemental material. This material has not been peer reviewed.
Footnotes
This work was supported by NIH Grants F32 NS059165 (H.C.L.) and R01 NS048887 (J.E.J.) and HHMI (H.Y.Z.). We are very grateful to Drs. Axel Visel and Len Pennacchio for sharing E11.5 neural tube p300 ChIP-seq data, and Drs. Neil Segil, Angelika Doetzlhofer, Patricia White, and Andrew Groves for sharing Atoh1-GFP inner ear microarray data before publication. We thank Dr. Lei Lei for Ntrk3 (TrkC) and Klf7 ISH probes and Dr. Thomas Jessell for the rabbit anti-Lhx2/9 antibody. Thanks to M. Borromeo, P. Mayer, D. Meredith, and T. Vue for critical reading of this manuscript, Z. Barnett, L. Dickel, J. Dumas, and T. Savage for technical assistance, and E. Kim and members of the Johnson Laboratory for their support.
The authors declare no competing financial interests.
References
- Abramoff MD, Magelhaes PJ, Ram SJ. Image processing with image. J Biophotonics Int. 2004;11:36–42. [Google Scholar]
- Aerts S, Quan XJ, Claeys A, Naval Sanchez M, Tate P, Yan J, Hassan BA. Robust target gene discovery through transcriptome perturbations and genome-wide enhancer predictions in Drosophila uncovers a regulatory basis for sensory specification. PLoS Biol. 2010;8:e1000435. doi: 10.1371/journal.pbio.1000435. [DOI] [PMC free article] [PubMed] [Google Scholar]
- Bailey TL, Elkan C. Fitting a mixture model by expectation maximization to discover motifs in biopolymers. Proc Int Conf Intell Syst Mol Biol. 1994;2:28–36. [PubMed] [Google Scholar]
- Ben-Arie N, McCall AE, Berkman S, Eichele G, Bellen HJ, Zoghbi HY. Evolutionary conservation of sequence and expression of the bHLH protein Atonal suggests a conserved role in neurogenesis. Hum Mol Genet. 1996;5:1207–1216. doi: 10.1093/hmg/5.9.1207. [DOI] [PubMed] [Google Scholar]
- Ben-Arie N, Bellen HJ, Armstrong DL, McCall AE, Gordadze PR, Guo Q, Matzuk MM, Zoghbi HY. Math1 is essential for genesis of cerebellar granule neurons. Nature. 1997;390:169–172. doi: 10.1038/36579. [DOI] [PubMed] [Google Scholar]
- Ben-Arie N, Hassan BA, Bermingham NA, Malicki DM, Armstrong D, Matzuk M, Bellen HJ, Zoghbi HY. Functional conservation of atonal and Math1 in the CNS and PNS. Development. 2000;127:1039–1048. doi: 10.1242/dev.127.5.1039. [DOI] [PubMed] [Google Scholar]
- Bermingham NA, Hassan BA, Price SD, Vollrath MA, Ben-Arie N, Eatock RA, Bellen HJ, Lysakowski A, Zoghbi HY. Math1: an essential gene for the generation of inner ear hair cells. Science. 1999;284:1837–1841. doi: 10.1126/science.284.5421.1837. [DOI] [PubMed] [Google Scholar]
- Bermingham NA, Hassan BA, Wang VY, Fernandez M, Banfi S, Bellen HJ, Fritzsch B, Zoghbi HY. Proprioceptor pathway development is dependent on Math1. Neuron. 2001;30:411–422. doi: 10.1016/s0896-6273(01)00305-1. [DOI] [PubMed] [Google Scholar]
- Bertrand N, Castro DS, Guillemot F. Proneural genes and the specification of neural cell types. Nat Rev Neurosci. 2002;3:517–530. doi: 10.1038/nrn874. [DOI] [PubMed] [Google Scholar]
- Bertrand V, Hobert O. Linking asymmetric cell division to the terminal differentiation program of postmitotic neurons in C. elegans. Dev Cell. 2009;16:563–575. doi: 10.1016/j.devcel.2009.02.011. [DOI] [PMC free article] [PubMed] [Google Scholar]
- Bossuyt W, Kazanjian A, De Geest N, Van Kelst S, De Hertogh G, Geboes K, Boivin GP, Luciani J, Fuks F, Chuah M, VandenDriessche T, Marynen P, Cools J, Shroyer NF, Hassan BA. Atonal homolog 1 is a tumor suppressor gene. PLoS Biol. 2009;7:e39. doi: 10.1371/journal.pbio.1000039. [DOI] [PMC free article] [PubMed] [Google Scholar]
- Brinster RL, Chen HY, Trumbauer ME, Yagle MK, Palmiter RD. Factors affecting the efficiency of introducing foreign DNA into mice by microinjecting eggs. Proc Natl Acad Sci U S A. 1985;82:4438–4442. doi: 10.1073/pnas.82.13.4438. [DOI] [PMC free article] [PubMed] [Google Scholar]
- Cachero S, Simpson TI, Zur Lage PI, Ma L, Newton FG, Holohan EE, Armstrong JD, Jarman AP. The gene regulatory cascade linking proneural specification with differentiation in Drosophila sensory neurons. PLoS Biol. 2011;9:e1000568. doi: 10.1371/journal.pbio.1000568. [DOI] [PMC free article] [PubMed] [Google Scholar]
- Cao Y, Yao Z, Sarkar D, Lawrence M, Sanchez GJ, Parker MH, MacQuarrie KL, Davison J, Morgan MT, Ruzzo WL, Gentleman RC, Tapscott SJ. Genome-wide MyoD binding in skeletal muscle cells: a potential for broad cellular reprogramming. Dev Cell. 2010;18:662–674. doi: 10.1016/j.devcel.2010.02.014. [DOI] [PMC free article] [PubMed] [Google Scholar]
- Castro DS, Skowronska-Krawczyk D, Armant O, Donaldson IJ, Parras C, Hunt C, Critchley JA, Nguyen L, Gossler A, Göttgens B, Matter JM, Guillemot F. Proneural bHLH and Brn proteins coregulate a neurogenic program through cooperative binding to a conserved DNA motif. Dev Cell. 2006;11:831–844. doi: 10.1016/j.devcel.2006.10.006. [DOI] [PubMed] [Google Scholar]
- Chien CT, Hsiao CD, Jan LY, Jan YN. Neuronal type information encoded in the basic-helix-loop-helix domain of proneural genes. Proc Natl Acad Sci U S A. 1996;93:13239–13244. doi: 10.1073/pnas.93.23.13239. [DOI] [PMC free article] [PubMed] [Google Scholar]
- Ebert PJ, Timmer JR, Nakada Y, Helms AW, Parab PB, Liu Y, Hunsaker TL, Johnson JE. Zic1 represses Math1 expression via interactions with the Math1 enhancer and modulation of Math1 autoregulation. Development. 2003;130:1949–1959. doi: 10.1242/dev.00419. [DOI] [PubMed] [Google Scholar]
- Eckfeld K, Hesson L, Vos MD, Bieche I, Latif F, Clark GJ. RASSF4/AD037 is a potential ras effector/tumor suppressor of the RASSF family. Cancer Res. 2004;64:8688–8693. doi: 10.1158/0008-5472.CAN-04-2065. [DOI] [PubMed] [Google Scholar]
- Edgar R, Domrachev M, Lash AE. Gene Expression Omnibus: NCBI gene expression and hybridization array data repository. Nucleic Acids Res. 2002;30:207–210. doi: 10.1093/nar/30.1.207. [DOI] [PMC free article] [PubMed] [Google Scholar]
- Ericson J, Thor S, Edlund T, Jessell TM, Yamada T. Early stages of motor neuron differentiation revealed by expression of homeobox gene Islet-1. Science. 1992;256:1555–1560. doi: 10.1126/science.1350865. [DOI] [PubMed] [Google Scholar]
- Flora A, Klisch TJ, Schuster G, Zoghbi HY. Deletion of Atoh1 disrupts Sonic Hedgehog signaling in the developing cerebellum and prevents medulloblastoma. Science. 2009;326:1424–1427. doi: 10.1126/science.1181453. [DOI] [PMC free article] [PubMed] [Google Scholar]
- Goodman RH, Smolik S. CBP/p300 in cell growth, transformation, and development. Genes Dev. 2000;14:1553–1577. [PubMed] [Google Scholar]
- Gowan K, Helms AW, Hunsaker TL, Collisson T, Ebert PJ, Odom R, Johnson JE. Crossinhibitory activities of Ngn1 and Math1 allow specification of distinct dorsal interneurons. Neuron. 2001;31:219–232. doi: 10.1016/s0896-6273(01)00367-1. [DOI] [PubMed] [Google Scholar]
- Haeberle H, Fujiwara M, Chuang J, Medina MM, Panditrao MV, Bechstedt S, Howard J, Lumpkin EA. Molecular profiling reveals synaptic release machinery in Merkel cells. Proc Natl Acad Sci U S A. 2004;101:14503–14508. doi: 10.1073/pnas.0406308101. [DOI] [PMC free article] [PubMed] [Google Scholar]
- Hamburger V, Hamilton HL. A series of normal stages in the development of the chick embryo. 1951. Dev Dyn. 1992;195:231–272. doi: 10.1002/aja.1001950404. [DOI] [PubMed] [Google Scholar]
- Hayashi H, Abdollah S, Qiu Y, Cai J, Xu YY, Grinnell BW, Richardson MA, Topper JN, Gimbrone MA, Jr, Wrana JL, Falb D. The MAD-related protein Smad7 associates with the TGFbeta receptor and functions as an antagonist of TGFbeta signaling. Cell. 1997;89:1165–1173. doi: 10.1016/s0092-8674(00)80303-7. [DOI] [PubMed] [Google Scholar]
- Helms AW, Johnson JE. Progenitors of dorsal commissural interneurons are defined by MATH1 expression. Development. 1998;125:919–928. doi: 10.1242/dev.125.5.919. [DOI] [PubMed] [Google Scholar]
- Helms AW, Abney AL, Ben-Arie N, Zoghbi HY, Johnson JE. Autoregulation and multiple enhancers control Math1 expression in the developing nervous system. Development. 2000;127:1185–1196. doi: 10.1242/dev.127.6.1185. [DOI] [PubMed] [Google Scholar]
- Helms AW, Gowan K, Abney A, Savage T, Johnson JE. Overexpression of MATH1 disrupts the coordination of neural differentiation in cerebellum development. Mol Cell Neurosci. 2001;17:671–682. doi: 10.1006/mcne.2000.0969. [DOI] [PubMed] [Google Scholar]
- Heng JI, Nguyen L, Castro DS, Zimmer C, Wildner H, Armant O, Skowronska-Krawczyk D, Bedogni F, Matter JM, Hevner R, Guillemot F. Neurogenin 2 controls cortical neuron migration through regulation of Rnd2. Nature. 2008;455:114–118. doi: 10.1038/nature07198. [DOI] [PubMed] [Google Scholar]
- Hoover LL, Kubalak SW. Holding their own: the noncanonical roles of Smad proteins. Sci Signal. 2008;1:pe48. doi: 10.1126/scisignal.146pe48. [DOI] [PMC free article] [PubMed] [Google Scholar]
- Hwang DY, Cho JS, Oh JH, Shim SB, Jee SW, Lee SH, Seo SJ, Lee SK, Lee SH, Kim YK. Differentially expressed genes in transgenic mice carrying human mutant presenilin-2 (N141I): correlation of selenoprotein M with Alzheimer's disease. Neurochem Res. 2005;30:1009–1019. doi: 10.1007/s11064-005-6787-6. [DOI] [PubMed] [Google Scholar]
- Izumikawa M, Minoda R, Kawamoto K, Abrashkin KA, Swiderski DL, Dolan DF, Brough DE, Raphael Y. Auditory hair cell replacement and hearing improvement by Atoh1 gene therapy in deaf mammals. Nat Med. 2005;11:271–276. doi: 10.1038/nm1193. [DOI] [PubMed] [Google Scholar]
- Jan YN, Jan LY. Genetic control of cell fate specification in Drosophila peripheral nervous system. Annu Rev Genet. 1994;28:373–393. doi: 10.1146/annurev.ge.28.120194.002105. [DOI] [PubMed] [Google Scholar]
- Jarman AP, Ahmed I. The specificity of proneural genes in determining Drosophila sense organ identity. Mech Dev. 1998;76:117–125. doi: 10.1016/s0925-4773(98)00116-6. [DOI] [PubMed] [Google Scholar]
- Jeong S, Rebeiz M, Andolfatto P, Werner T, True J, Carroll SB. The evolution of gene regulation underlies a morphological difference between two Drosophila sister species. Cell. 2008;132:783–793. doi: 10.1016/j.cell.2008.01.014. [DOI] [PubMed] [Google Scholar]
- Kawauchi D, Saito T. Transcriptional cascade from Math1 to Mbh1 and Mbh2 is required for cerebellar granule cell differentiation. Dev Biol. 2008;322:345–354. doi: 10.1016/j.ydbio.2008.08.005. [DOI] [PubMed] [Google Scholar]
- Kawauchi T, Sekine K, Shikanai M, Chihama K, Tomita K, Kubo K, Nakajima K, Nabeshima Y, Hoshino M. Rab GTPases-dependent endocytic pathways regulate neuronal migration and maturation through N-cadherin trafficking. Neuron. 2010;67:588–602. doi: 10.1016/j.neuron.2010.07.007. [DOI] [PubMed] [Google Scholar]
- Kent WJ, Sugnet CW, Furey TS, Roskin KM, Pringle TH, Zahler AM, Haussler D. The human genome browser at UCSC. Genome Res. 2002;12:996–1006. doi: 10.1101/gr.229102. [DOI] [PMC free article] [PubMed] [Google Scholar]
- Klisch TJ, Xi Y, Flora A, Wang L, Li W, Zoghbi HY. The in vivo Atoh1 targetome reveals how a proneural transcription factor regulates cerebellar development. Proc Natl Acad Sci U S A. 2011;108:3288–3293. doi: 10.1073/pnas.1100230108. [DOI] [PMC free article] [PubMed] [Google Scholar]
- Korotkov KV, Novoselov SV, Hatfield DL, Gladyshev VN. Mammalian selenoprotein in which selenocysteine (Sec) incorporation is supported by a new form of Sec insertion sequence element. Mol Cell Biol. 2002;22:1402–1411. doi: 10.1128/mcb.22.5.1402-1411.2002. [DOI] [PMC free article] [PubMed] [Google Scholar]
- Krämer H, Cagan RL, Zipursky SL. Interaction of bride of sevenless membrane-bound ligand and the sevenless tyrosine-kinase receptor. Nature. 1991;352:207–212. doi: 10.1038/352207a0. [DOI] [PubMed] [Google Scholar]
- Krizhanovsky V, Soreq L, Kliminski V, Ben-Arie N. Math1 target genes are enriched with evolutionarily conserved clustered E-box binding sites. J Mol Neurosci. 2006;28:211–229. doi: 10.1385/JMN:28:2:211. [DOI] [PubMed] [Google Scholar]
- Laub F, Lei L, Sumiyoshi H, Kajimura D, Dragomir C, Smaldone S, Puche AC, Petros TJ, Mason C, Parada LF, Ramirez F. Transcription factor KLF7 is important for neuronal morphogenesis in selected regions of the nervous system. Mol Cell Biol. 2005;25:5699–5711. doi: 10.1128/MCB.25.13.5699-5711.2005. [DOI] [PMC free article] [PubMed] [Google Scholar]
- Lei L, Laub F, Lush M, Romero M, Zhou J, Luikart B, Klesse L, Ramirez F, Parada LF. The zinc finger transcription factor Klf7 is required for TrkA gene expression and development of nociceptive sensory neurons. Genes Dev. 2005;19:1354–1364. doi: 10.1101/gad.1227705. [DOI] [PMC free article] [PubMed] [Google Scholar]
- Liem KF, Jr, Tremml G, Jessell TM. A role for the roof plate and its resident TGFbeta-related proteins in neuronal patterning in the dorsal spinal cord. Cell. 1997;91:127–138. doi: 10.1016/s0092-8674(01)80015-5. [DOI] [PubMed] [Google Scholar]
- Louvi A, Artavanis-Tsakonas S. Notch signalling in vertebrate neural development. Nat Rev Neurosci. 2006;7:93–102. doi: 10.1038/nrn1847. [DOI] [PubMed] [Google Scholar]
- Lumpkin EA, Collisson T, Parab P, Omer-Abdalla A, Haeberle H, Chen P, Doetzlhofer A, White P, Groves A, Segil N, Johnson JE. Math1-driven GFP expression in the developing nervous system of transgenic mice. Gene Expr Patterns. 2003;3:389–395. doi: 10.1016/s1567-133x(03)00089-9. [DOI] [PubMed] [Google Scholar]
- Machold R, Fishell G. Math1 is expressed in temporally discrete pools of cerebellar rhombic-lip neural progenitors. Neuron. 2005;48:17–24. doi: 10.1016/j.neuron.2005.08.028. [DOI] [PubMed] [Google Scholar]
- Maricich SM, Wellnitz SA, Nelson AM, Lesniak DR, Gerling GJ, Lumpkin EA, Zoghbi HY. Merkel cells are essential for light-touch responses. Science. 2009a;324:1580–1582. doi: 10.1126/science.1172890. [DOI] [PMC free article] [PubMed] [Google Scholar]
- Maricich SM, Xia A, Mathes EL, Wang VY, Oghalai JS, Fritzsch B, Zoghbi HY. Atoh1-lineal neurons are required for hearing and for the survival of neurons in the spiral ganglion and brainstem accessory auditory nuclei. J Neurosci. 2009b;29:11123–11133. doi: 10.1523/JNEUROSCI.2232-09.2009. [DOI] [PMC free article] [PubMed] [Google Scholar]
- Massari ME, Murre C. Helix-loop-helix proteins: regulators of transcription in eucaryotic organisms. Mol Cell Biol. 2000;20:429–440. doi: 10.1128/mcb.20.2.429-440.2000. [DOI] [PMC free article] [PubMed] [Google Scholar]
- Miesegaes GR, Klisch TJ, Thaller C, Ahmad KA, Atkinson RC, Zoghbi HY. Identification and subclassification of new Atoh1 derived cell populations during mouse spinal cord development. Dev Biol. 2009;327:339–351. doi: 10.1016/j.ydbio.2008.12.016. [DOI] [PMC free article] [PubMed] [Google Scholar]
- Morrison KM, Miesegaes GR, Lumpkin EA, Maricich SM. Mammalian Merkel cells are descended from the epidermal lineage. Dev Biol. 2009;336:76–83. doi: 10.1016/j.ydbio.2009.09.032. [DOI] [PMC free article] [PubMed] [Google Scholar]
- Nakada Y, Hunsaker TL, Henke RM, Johnson JE. Distinct domains within Mash1 and Math1 are required for function in neuronal differentiation versus neuronal cell-type specification. Development. 2004a;131:1319–1330. doi: 10.1242/dev.01008. [DOI] [PubMed] [Google Scholar]
- Nakada Y, Parab P, Simmons A, Omer-Abdalla A, Johnson JE. Separable enhancer sequences regulate the expression of the neural bHLH transcription factor neurogenin 1. Dev Biol. 2004b;271:479–487. doi: 10.1016/j.ydbio.2004.04.021. [DOI] [PubMed] [Google Scholar]
- Parras CM, Schuurmans C, Scardigli R, Kim J, Anderson DJ, Guillemot F. Divergent functions of the proneural genes Mash1 and Ngn2 in the specification of neuronal subtype identity. Genes Dev. 2002;16:324–338. doi: 10.1101/gad.940902. [DOI] [PMC free article] [PubMed] [Google Scholar]
- Powell LM, zur Lage PI, Prentice DR, Senthinathan B, Jarman AP. The proneural proteins Atonal and Scute regulate neural target genes through different E-box binding sites. Mol Cell Biol. 2004;24:9517–9526. doi: 10.1128/MCB.24.21.9517-9526.2004. [DOI] [PMC free article] [PubMed] [Google Scholar]
- Raft S, Koundakjian EJ, Quinones H, Jayasena CS, Goodrich LV, Johnson JE, Segil N, Groves AK. Cross-regulation of Ngn1 and Math1 coordinates the production of neurons and sensory hair cells during inner ear development. Development. 2007;134:4405–4415. doi: 10.1242/dev.009118. [DOI] [PubMed] [Google Scholar]
- Reeves N, Posakony JW. Genetic programs activated by proneural proteins in the developing Drosophila PNS. Dev Cell. 2005;8:413–425. doi: 10.1016/j.devcel.2005.01.020. [DOI] [PubMed] [Google Scholar]
- Rhead B, Karolchik D, Kuhn RM, Hinrichs AS, Zweig AS, Fujita PA, Diekhans M, Smith KE, Rosenbloom KR, Raney BJ, Pohl A, Pheasant M, Meyer LR, Learned K, Hsu F, Hillman-Jackson J, Harte RA, Giardine B, Dreszer TR, Clawson H, et al. The UCSC Genome Browser database: update 2010. Nucleic Acids Res. 2010;38:D613–D619. doi: 10.1093/nar/gkp939. [DOI] [PMC free article] [PubMed] [Google Scholar]
- Rose MF, Ren J, Ahmad KA, Chao HT, Klisch TJ, Flora A, Greer JJ, Zoghbi HY. Math1 is essential for the development of hindbrain neurons critical for perinatal breathing. Neuron. 2009a;64:341–354. doi: 10.1016/j.neuron.2009.10.023. [DOI] [PMC free article] [PubMed] [Google Scholar]
- Rose MF, Ahmad KA, Thaller C, Zoghbi HY. Excitatory neurons of the proprioceptive, interoceptive, and arousal hindbrain networks share a developmental requirement for Math1. Proc Natl Acad Sci U S A. 2009b;106:22462–22467. doi: 10.1073/pnas.0911579106. [DOI] [PMC free article] [PubMed] [Google Scholar]
- Saba R, Johnson JE, Saito T. Commissural neuron identity is specified by a homeodomain protein, Mbh1, that is directly downstream of Math1. Development. 2005;132:2147–2155. doi: 10.1242/dev.01781. [DOI] [PubMed] [Google Scholar]
- Schmidt D, Wilson MD, Ballester B, Schwalie PC, Brown GD, Marshall A, Kutter C, Watt S, Martinez-Jimenez CP, Mackay S, Talianidis I, Flicek P, Odom DT. Five-vertebrate ChIP-seq reveals the evolutionary dynamics of transcription factor binding. Science. 2010;328:1036–1040. doi: 10.1126/science.1186176. [DOI] [PMC free article] [PubMed] [Google Scholar]
- Seo S, Lim JW, Yellajoshyula D, Chang LW, Kroll KL. Neurogenin and NeuroD direct transcriptional targets and their regulatory enhancers. EMBO J. 2007;26:5093–5108. doi: 10.1038/sj.emboj.7601923. [DOI] [PMC free article] [PubMed] [Google Scholar]
- Skowronska-Krawczyk D, Matter-Sadzinski L, Ballivet M, Matter JM. The basic domain of ATH5 mediates neuron-specific promoter activity during retina development. Mol Cell Biol. 2005;25:10029–10039. doi: 10.1128/MCB.25.22.10029-10039.2005. [DOI] [PMC free article] [PubMed] [Google Scholar]
- Sukhanova MJ, Deb DK, Gordon GM, Matakatsu MT, Du W. Proneural basic helix-loop-helix proteins and epidermal growth factor receptor signaling coordinately regulate cell type specification and cdk inhibitor expression during development. Mol Cell Biol. 2007;27:2987–2996. doi: 10.1128/MCB.01685-06. [DOI] [PMC free article] [PubMed] [Google Scholar]
- Timmer J, Johnson J, Niswander L. The use of in ovo electroporation for the rapid analysis of neural-specific murine enhancers. Genesis. 2001;29:123–132. doi: 10.1002/gene.1015. [DOI] [PubMed] [Google Scholar]
- Tsuchida T, Ensini M, Morton SB, Baldassare M, Edlund T, Jessell TM, Pfaff SL. Topographic organization of embryonic motor neurons defined by expression of LIM homeobox genes. Cell. 1994;79:957–970. doi: 10.1016/0092-8674(94)90027-2. [DOI] [PubMed] [Google Scholar]
- Van Keymeulen A, Mascre G, Youseff KK, Harel I, Michaux C, De Geest N, Szpalski C, Achouri Y, Bloch W, Hassan BA, Blanpain C. Epidermal progenitors give rise to Merkel cells during embryonic development and adult homeostasis. J Cell Biol. 2009;187:91–100. doi: 10.1083/jcb.200907080. [DOI] [PMC free article] [PubMed] [Google Scholar]
- Visel A, Prabhakar S, Akiyama JA, Shoukry M, Lewis KD, Holt A, Plajzer-Frick I, Afzal V, Rubin EM, Pennacchio LA. Ultraconservation identifies a small subset of extremely constrained developmental enhancers. Nat Genet. 2008;40:158–160. doi: 10.1038/ng.2007.55. [DOI] [PMC free article] [PubMed] [Google Scholar]
- Visel A, Blow MJ, Li Z, Zhang T, Akiyama JA, Holt A, Plajzer-Frick I, Shoukry M, Wright C, Chen F, Afzal V, Ren B, Rubin EM, Pennacchio LA. ChIP-seq accurately predicts tissue-specific activity of enhancers. Nature. 2009;457:854–858. doi: 10.1038/nature07730. [DOI] [PMC free article] [PubMed] [Google Scholar]
- Wang VY, Hassan BA, Bellen HJ, Zoghbi HY. Drosophila atonal fully rescues the phenotype of Math1 null mice: new functions evolve in new cellular contexts. Curr Biol. 2002;12:1611–1616. doi: 10.1016/s0960-9822(02)01144-2. [DOI] [PubMed] [Google Scholar]
- Wang VY, Rose MF, Zoghbi HY. Math1 expression redefines the rhombic lip derivatives and reveals novel lineages within the brainstem and cerebellum. Neuron. 2005;48:31–43. doi: 10.1016/j.neuron.2005.08.024. [DOI] [PubMed] [Google Scholar]
- Wechsler-Reya RJ. Analysis of gene expression in the normal and malignant cerebellum. Recent Prog Horm Res. 2003;58:227–248. doi: 10.1210/rp.58.1.227. [DOI] [PubMed] [Google Scholar]
- Wilson MD, Odom DT. Evolution of transcriptional control in mammals. Curr Opin Genet Dev. 2009;19:579–585. doi: 10.1016/j.gde.2009.10.003. [DOI] [PubMed] [Google Scholar]
- Yim SY, Chae KR, Shim SB, Hong JT, Park JY, Lee CY, Son HJ, Sheen YY, Hwang DY. ERK activation induced by selenium treatment significantly downregulates beta/gamma-secretase activity and Tau phosphorylation in the transgenic rat overexpressing human selenoprotein M. Int J Mol Med. 2009;24:91–96. doi: 10.3892/ijmm_00000211. [DOI] [PubMed] [Google Scholar]
- Zhao H, Ayrault O, Zindy F, Kim JH, Roussel MF. Post-transcriptional down-regulation of Atoh1/Math1 by bone morphogenic proteins suppresses medulloblastoma development. Genes Dev. 2008;22:722–727. doi: 10.1101/gad.1636408. [DOI] [PMC free article] [PubMed] [Google Scholar]
- Zheng JL, Gao WQ. Overexpression of Math1 induces robust production of extra hair cells in postnatal rat inner ears. Nat Neurosci. 2000;3:580–586. doi: 10.1038/75753. [DOI] [PubMed] [Google Scholar]
- Zuk PA, Elferink LA. Rab15 differentially regulates early endocytic trafficking. J Biol Chem. 2000;275:26754–26764. doi: 10.1074/jbc.M000344200. [DOI] [PubMed] [Google Scholar]
- zur Lage PI, Jarman AP. The function and regulation of the bHLH gene, cato, in Drosophila neurogenesis. BMC Dev Biol. 2010;10:34. doi: 10.1186/1471-213X-10-34. [DOI] [PMC free article] [PubMed] [Google Scholar]
- zur Lage PI, Powell LM, Prentice DR, McLaughlin P, Jarman AP. EGF receptor signaling triggers recruitment of Drosophila sense organ precursors by stimulating proneural gene autoregulation. Dev Cell. 2004;7:687–696. doi: 10.1016/j.devcel.2004.09.015. [DOI] [PubMed] [Google Scholar]