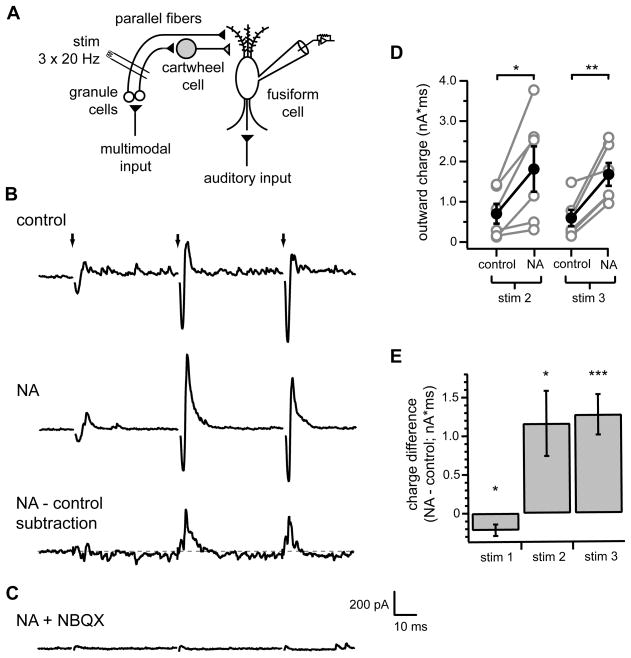
Figure 1. NA enhances parallel fiber-evoked feed-forward inhibition of DCN fusiform cells.
(A) Simplified DCN circuit diagram. Black and gray triangles represent glutamatergic and glycinergic/GABAergic synaptic terminals, respectively. Recording and stimulus (stim) electrodes illustrate experimental configuration for (B–G).
(B) Example responses to identical parallel fiber stimulation (3 stimuli at 20 Hz, arrows) recorded from a fusiform cell in control conditions (top) or in 10 μM NA (middle). Bottom trace shows difference current calculated from subtraction of response in control from response in NA. Gray dotted line is zero current level. (C) NBQX eliminated both inward and outward components of evoked responses, confirming disynaptic nature of outward currents. Same cell as in (B).(D) Summary of total charge of outward components (see Methods) of second and third responses in control and NA. Gray circles are data from individual cells. Filled black circles with error bars represent mean±SEM of outward charge measurements. NA significantly increased outward charge for both stimulus 2 (*p<0.05) and 3 (**p<0.01), n=6.
(E) Summary of mean total charge measurements after each stimulus (20 ms window) determined from subtraction currents as shown in (E). Charge difference significantly different from 0 pA*ms for all stimuli (stim1 *p<0.05, stim2 *p<0.05, stim3 ***p<0.005), one sample t-tests, n=6.
In (B–C), current traces are averages of 20 sweeps. Stimulus artifacts were removed from (B, top and middle, C) for clarity. Scale bars apply to all current traces.

