Abstract
Previous studies have shown that erythropoietin (EPO) is neuroprotective in both in vivo and in vitro models of hypoxia ischemia. However theses studies hold limited clinical translations because the underlying mechanism remains unclear and the key molecules involved in EPO-induced neuroprotection are still to be determined. This study investigated if tissue inhibitor of matrix metalloproteinase-1 (TIMP-1) and if its upstream regulator signaling molecule Janus kinase-2 (JAK-2) are critical in EPO-induced neuroprotection. Hypoxia Ischemia (HI) was modeled in-vitro by oxygen and glucose deprivation (OGD) and in-vivo by a modified version of Rice-Vannucci model of HI in 10-day-old rat pups.
EPO treated cells were exposed to AG490, an inhibitor of JAK-2 or TIMP-1 neutralizing antibody for 2 hours with OGD. Cell death, phosphorylation of JAK-2 and signal transducers and activators of transcription protein-3 (STAT-3), TIMP-1 expression, and matrix metalloproteinase-9 (MMP-9) activity were measured and compared with normoxic group. Hypoxic ischemic animals were treated one hour following HI and evaluated 48 hours after. Our data showed that EPO significantly increased cell survival, associated with increased TIMP-1 activity, phosphorylation of JAK-2, STAT-3, and decreased MMP-9 activity in vivo and in vitro. EPO’s protective effects were reversed by inhibition of JAK-2 or TIMP-1 in both models. We concluded that JAK-2, STAT-3 and TIMP-1 are key mediators of EPO-induced neuroprotection during hypoxia ischemia injury.
Keywords: JAK-2, STAT-3, TIMP-1, EPO, neonatal HI
Introduction
Asphyxia is the disruption of placental/ pulmonary gas exchange. It is associated with hypoxemia, respiratory and systemic acidosis, which are linked to cerebral hypoxia ischemia in neonates (Vannucci 2000). Erythropoietin (EPO), a hematopoietic growth factor, with non-hematopoietic functions, is upregulated during hypoxia ischemia in the brain of most mammals (Prass et al. 2003). Although the upregulation of endogenous EPO is not enough to confer neuroprotection during hypoxia, it is able to turn on some of the necessary pro-survival pathways (Shein et al. 2008). Previous studies have shown that exogenous administration of EPO confers neuroprotection in both in vitro and in vivo models of cerebral ischemia (Brines et al. 2000; Sakanaka et al. 1998; Sun et al. 2005). Our understanding of the mechanism by which this occurs is still unfolding. Physiologically, EPO binds to the EPO receptor (EPOR) and promotes cellular differentiation, proliferation and inhibition of apoptosis (Brines et al. 2000; Sakanaka et al. 1998; Sun et al. 2005). It also prevents damage against mechanical trauma, excitotoxins, and neuro-inflammation (Brines et al. 2000; Sakanaka et al. 1998; Sun et al. 2005).
Previous studies have shown that EPO and other hematopoietic growth factors are associated with the Janus kinase-2 (JAK-2), a tyrosine kinase (Harpur et al. 1992; Witthuhn et al. 1993). Janus kinases are a family of receptor tyrosine kinases associated with membrane receptors and are phosphorylated when specific ligands bind to its receptor. JAK-2 kinases phosphorylate cytosolic transcription factors, signal transducers and activators of transcription (STAT), allowing for the transcription of proteins such as: cytokines, growth factors, cell survival and differentiation factors depending on the ligand (Ihle 1995b; Ihle 1995a; Shuai et al. 1992; Kaplan et al. 1996). STAT-3 and STAT-5 are both associated with the EPOR and are both activated by the binding of EPO to its receptor (Ruscher et al. 2002; Toth et al. 2008). STAT-3 is not as well studied as the other EPO activated STATs. However some earlier findings show that STAT-3 can bind to the promoter sequence of the tissue inhibitor of matrix metalloproteinase (TIMP) -1 gene (Bugno et al. 1995, Dominguez et al. 2008). TIMP-1 is associated with erythroid cell survival, growth and differentiation in the presence of EPO (Kadri et al. 2000; Bugno et al. 1995).
TIMPs are a family of four secreted proteins (TIMPs 1-4) that function in maintaining extracellular matrix homeostasis (Gomez et al. 1997; Carmichael et al. 1986; Stetler-Stevenson 1990; Stetler-Stevenson et al. 1990). TIMPs are endogenous inhibitors of matrix metalloproteinases (MMP), a family of protein-degrading zinc dependant endopeptidases (Jiang et al. 2002; Baker et al. 2002). The delicate balance between TIMPs and MMPs regulates extracellular matrix, receptor shedding and growth factor bioavailability (Sternlicht & Werb, 2001). MMPs are important in embryonic development, angiogenesis, wound healing, inflammation, cancer, and tissue destruction. MMPs cleave most of the extracellular matrix (ECM) and are involved in the breakdown and remodeling of many tissues and organs (Birkedal-Hansen et al., 1993; Isaksen and Fagerhol, 2001). Because of its ability to degrade ECM, changes in the MMP-9 to TIMP-1 ratio leads to excessive tissue degradation and cell death. The delicate balance is usually altered during hypoxia leading to a significant increase in MMPs secretion that is not proportional to that of TIMPs(Reynolds, 1996;Ejeil et al., 2003;Andrian et al., 2007). Previous studies have confirmed that EPO triggers an increase in both mRNA and protein levels of TIMP-1 (Kadri et al. 2000). TIMP-1 forms a 1:1 complex with MMP-9 and inhibits its proteinase activities. Increased MMP-9 mediated apoptosis thus, its inhibition is associated with improved cell survival in both in vivo and in vitro model of hypoxia ischemia (Chen et al. 2008; Jiang et al. 2002; Baker et al. 2002). Additionally, an inverse correlation with MMP-9 expression and activity and erythroid cell survival has been shown (Kadri et al. 2000). However, this correlation has not been shown in non-hematopoietic cells such as neurons and the role of TIMP-1 in EPO-induced neuroprotection in vivo and in vitro awaits further investigation.
In this study, we sought to determine whether TIMP-1 expression and anti-gelatinase activity are important in EPO induced neuroprotection during hypoxia ischemia. Cerebral hypoxia ischemia was modeled in vitro by oxygen and glucose deprivation (OGD) in PC12 cells and in vivo by permanent ligation of the right common carotid artery followed by two hours of hypoxia in 10-day-old (P-10) rat pups (Zagorska and Dulak 2004; Vannucci et al. 1999). We examined the expression of TIMP-1, phosphorylated JAK-2 and STAT-3, as well as the activities of TIMP-1 and MMP-9 with EPO treatment during OGD. We then investigated if pharmacological inhibition of JAK-2 or TIMP-1 negated EPO induced neuroprotection during hypoxia ischemia in vitro and in vivo. The endpoints used to determine neuroprotection were cell death and infarct volume in vitro and in vivo respectively.
Materials and Methods
Materials
Rat pheochromocytoma (PC-12) cells, fetal bovine serum (FBS) and horse serum (HS) were obtained from ATCC (Manassas, VA). Procrit ©, human recombinant erythropoietin was from Loma Linda University, Hospital Pharmacy (Loma Linda, CA.). Neuronal growth factor (NGF) was from Alomone Laboratories Ltd. (Jerusalem, Israel). Reverse zymography kit was from University of East Anglia, School of Biological Sciences (Norwich UK). TIMP-1 neutralizing antibody was from AbD Serotec (Raleigh, NC). AG490 was from Calibiochem (San Diego, CA). Rabbit phospho-STAT-3 (Tyr705) (D3A7) monoclonal antibody was from Cell Signaling (Danvers MA). Rabbit phospho-JAK-2 (Tyr1007/1008) polyclonal antibody, rabbit anti- JAK-2 and mouse anti-TIMP-1, (clone 7-6C1) monoclonal antibodies were obtained from Millipore Biosciences. (Temecula, CA). Rabbit anti STAT-3, β–actin and all secondary antibodies were from Santa Cruz Biotechnology. Cell death ELISA was from Roche Diagnostics (Indianapolis, IN). All other reagents were obtained from Fisher Scientific (Tustin, CA).
Methods
Culture and Differentiation of Cells
PC-12 cells passage 6 through 9 were used. Cells were grown on 100 mm2 poly-D-lysine plates in Dulbeco’s modified Eagle’s medium (DMEM) supplemented with: 5% FBS, 10% HS, 1% Penicillin/streptomycin, 25 mM glucose, 50 ng/ml NGF and incubated at 37°C in 5% CO2 for 7 days as previously described (Greene 1976;Dickson et al. 1986).
Treatment
Normal media was replaced with glucose-free, supplemented DMEM with either 0,3,10 or 30 U/ml EPO. Cells were placed in a hypoxic chamber with less than 1% oxygen for 2 hours (Agani et al. 2002). Treatment media was discarded and cells were allowed to recover for 18 hours under normal conditions and collected for zymography, reverse zymography, western blotting, trypan blue exclusion and cell death ELISA. Cells were treated with 25 mM of AG490 during OGD for the inhibition of JAK/STAT and 3 μg/mL of TIMP-1 neutralizing antibody for inhibition of TIMP-1.
Protein Extraction from PC-12 Cells
Protein was extracted as previously described (Andrews and Faller 1991). Briefly, cells were detached by scraping, rinsed with cold PBS, centrifuged and supernatant discarded. One hundred μL of radio-immuno-precipitation assay (RIPA) lysis buffer [20 mM Tris, pH 7.5, 150 mM NaCl, 1% NP40, 0.5% Na deoxycholate, 1 mM EDTA, and 0.1% sodium dodecyl sulfate (SDS)] supplemented with mammalian protease inhibitor cocktail, phenylmethanesulfonylfluoride, (Sigma-Aldrich, St. Louis, MO) and sodium orthovanadate (Santa Cruz, Hercules CA) were added and the suspension shaken for 15 minutes at 4°C followed by centrifugation. Protein concentrations were estimated by Bradford Assay (BioRad, Hercules, and CA). Samples not used immediately were aliquoted stored at −80°C for later use.
Cell Death Assays
Cell death was assessed by trypan blue exclusion and cell death ELISA according to manufacturer’s protocol (Roche Diagnostics, Indianapolis, IN.) Briefly, cells were collected by scraping. Sixteen μl of cell suspension mixed with 4 μl of trypan blue and allowed to sit for 5 minutes. Cells were re-suspended and counted on a hemocytometer thrice by two independent investigators. The formula used to calculate percent cell death was as follows: (Trypan blue positive cells)]/ total cell counted) × 100. The average of all six counts was used. There was an n of six per group. Cell death was also determined by the concentration of mono- and oligonucleosomes present in whole cell lysates using an ELISA kit (ROCHE Diagnostics). Concentration was determined by spectrophotometry at wavelength 405nm with a reference wavelength of 495nm using a 96 well plate reader (BioRad, Hercules CA).
Western Blotting
Western blotting was done as previously described (Dominguez et al. 2008). A 30μg sample of total protein per well with Laemmli sample buffer (62.5 mM Tris-HCl, pH 6.8, 25% glycerol, 2% SDS, 0.01% Bromophenol Blue and 5% β-mercaptoethanol) was denatured at 90°C for 3-5 minutes prior to loading on a 4-12% Bis Tris gel (Biorad, Hercules, CA). Gel was electrophoresed and protein transferred to nitrocellulose membrane. The membrane was blocked with nonfat blocking grade milk (Biorad, Hercules, CA) and probed with the appropriate dilutions of primary and secondary antibodies to either JAK-2, pJAK-2, STAT-3, pSTAT-3, TIMP-1 or β–actin. Membranes were washed and protein visualized using ECL Plus, Chemiluminescence (GE Healthcare and Life Sciences, Piscataway, NJ). The optical densities of the bands were calculated with Image J, version 1.0 and normalized to β-actin which was used as a loading control for all proteins studied.
Gelatin Zymography
Gelatin zymography was performed as previously described (Tang et al. 2004; Wang et al. 2000; Wu et al. 2010). Briefly, 60 μg samples of protein extract were prepared and separated by electrophoresis in 10% Tris-glycine gel with 0.1% gelatin as substrate (Bio-Rad, Hercules, CA). The gel was re-natured for one hour and then incubated with development buffer at 37°C for 48 hours. After development, the gel was stained with 0.5% coomassie brilliant blue R-250 for one hour and then destained appropriately. MMP activity was quantified. Optical densities were calculated with Image J (version 1.0) software.
Reverse Zymography
Reverse zymography was performed according to manufacturer’s protocol. Briefly, 60μg samples cell lysate (total protein) was mixed with (1:2 ratio) zymography sample buffer [62.5 mM Tris-HCl, pH 6.8, 25% glycerol, 4% SDS, 0.01% Bromophenol Blue] (Bio-Rad, Hercules, CA), and loaded on a 15% gelatinase gel. Electrophoresis was performed at 140V, and then gels were rinsed and incubated at 37°C for 48hours. Stained withTIMP-1 and TIMP-2 were observed as dark bands as indicated by TIMPs standard (East Anglia University, Norwich UK). TIMP-1 activity was quantified, and optical densities were calculated with Image J, version 1.0.
Neonatal Hypoxic Ischemic Model
All animal research was conducted in accordance with protocols approved by Loma Linda University Institutional Animal Care and Use Committee (IACUC). Time pregnant female Sprague-Dawley rats (n=5) (Harlan Laboratories, Indianapolis, IN) with their dams were housed in light and temperature controlled environment with food and water ad libitum for the duration of the study. Hypoxia ischemia (HI) was performed as previously described (Calvert et al. 2002). Briefly, the right common carotid artery of anesthetized (2.5% isoflourane in 30% O2 and 70% medical air) post-natal day 10 pups (n=56) were permanently ligated, followed by one hour of rest and 2.5 hours of hypoxia (8% O2 balance N2). The pups were returned to their respective dams and maintained at ambient temperature for 24 hours. Animals were sacrificed under deep anesthesia at 48 hours post hypoxia and samples collected for 2, 3, 5-triphenyltetrazolium chloride monohydrate (TTC) staining, imunohistochemistry, western blotting, zymography or reverse zymography.
Intracerebral Ventricular Injection
Intracerebral ventricular injection was performed 1 hour prior to HI, as previously described by Pang et al. Briefly the skull was exposed by a midline incision and the 0.5 ul of drug (300ng TIMP-1 neutralizing antibody or 15ug AG490) was administered. The coordinates used were 1.0 mm posterior and 1.0 mm lateral to the bregma and 2.0 mm deep to the skull surface on the contralateral hemisphere (Pang et al. 2003). All drugs were concentrated so that animals received no more than 0.5 μl of fluid in the ventricle. Dose response curves for both TIMP-1 neutralizing antibody and AG490 were performed to determine the optimum doses. The doses presented in this study were 300 ng per pup of TIMP-1 neutralizing antibody and 15 μM of AG490. The vehicles used were IgG and 10% DMSO respectively. Sham operated animals were given a needle stick using the same coordinates as vehicle and treated animals to minimize/eliminated difference due to surgical techniques.
Infarct Volume
Infarct volume was assessed by TTC staining as previously described (Yin et al. 2003). Briefly, pups were euthanized by isoflurane inhalation. Brain was immediately removed and sectioned into 2 μm slices. The slices were submerged in 2% TTC solution for 5 minutes at 37°C and rinsed with cold phosphate buffered saline (PBS). Sections were then fixed with 10% formaldehyde. The slices were photographed and analyzed using Image J, version 1.0 software by different researchers both of whom were blinded to the groups in this study. The following formula was used to calculated percent infarct [(total area of contralateral hemisphere × 2) – (area of uninfarcted area of ipsilateral hemisphere)]/ (total area of contralateral hemisphere × 2) for each slice.
Immunohistochemistry
Transcardial perfusion was performed as previously described (Hu et al. 1999;Leonardo et al. 2010). Briefly, following anesthesia with 3.0% isoflurane for 3 to 5 minutes, pups were thoracotomized. A catheter was placed in the apex of the left ventricle and an incision was made on the right atrium. The pups were perfused with 40 ml of PBS followed by 40 ml of 10% formalin. Collected brain tissues were first fixed in 10% formalin and then cryopreserved in 30% sucrose solution. The tissues were frozen in optimal temperature cutting (OTC) solution (Fisher Scientific, Tustin CA) and sectioned into 10 μm coronal slices by cryostat (CM3050S, Leica Microsystems, Bannockburn, IL). The 10 μm sections were incubated with primary mouse anti- TIMP-1, rabbit anti-MMP-9 (Millipore) or goat anti-MAP-2 (Santa Cruz Inc.) overnight at 4°C. Fluorescence dye-conjugated secondary antibodies (Jackson Immuno Research, West Grove, PA) fluorescein isothiocyanate (FITC; green fluorescence) donkey anti-mouse, Texas red-conjugated donkey anti-rabbit IgG and AMCA-conjugated affinity pure donkey anti-goat (Blue) were used. Sections were then observed under an Olympus B 51 microscope with a digital camera and Image-Pro plus software.
Statistical Analysis
Data are presented as mean ± standard deviation. All data were validated using one way ANOVA followed by Tukey or Dunn’s test. Statistical evaluation was performed using Sigma Stat software version 3.5 (DUNDAS software LTD. Germany).
Results
Determining the Optimum Dose of EPO
To investigate the most effective dose of EPO during OGD, cells were treated with 0,3,10 or 30 U/ml of EPO. After 18 hours of recovery, cell death was determined quantitatively by trypan blue exclusion (figure 1a, n=6) and qualitatively by ELISA (figure1b, n=5). As compared with untreated, medium dose EPO 10 U/ml conferred the most protection. Both low (3 U/ml) and high (30 U/ml) doses were ineffective in minimizing cell death during OGD. Medium dose (10 U/mL) conferred significant neuroprotection (p< 0.05) compared to the untreated group making this the most effective dose (Figure1).
Figure 1. The Optimum dose of Erythropoietin for neuroprotection during Oxygen and Glucose Deprivation in vitro.
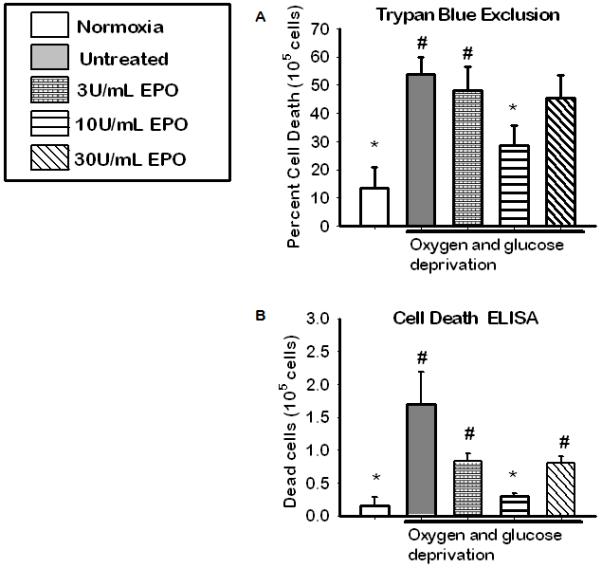
(A) Cell viability as assessed by trypan blue exclusion following HI and 18hrs of recovery. Data represent the mean (±SD): n = 6 in all groups. (B) Cell viability as determined by cell death ELISA. Data represent the mean (±SD): n = 5 in all groups. *P < 0.05 compared to untreated. # P< 0.05 compared to 10U/ml EPO group. 10U/mL conferred the most neuroprotection.
Phosphorylation of JAK-2 and STAT-3 in vitro
To examine if phosphorylation of JAK-2 and STAT-3 are involved in EPO induced neuroprotection we profile the expression of the phospho-proteins in the presence and absence of their inhibitors and EPO during OGD in NGF differentiated PC-12 cells. Figure 2 (b) shows a significant increase in JAK-2 phosphorylation (p<0.05) in EPO treated group compared to normoxic, untreated and JAK inhibitor group (25 μM AG490). The expression of phosphorylated STAT-3 was also significantly increased in the 10U/mL EPO treated group (p<0.05) compared to that of all other groups Figure 2(c). This indicates EPO has an effect on both JAK-2 and STAT-3 phosphorylation when used to treat NGF differentiated PC-12 cell during OGD.
Figure 2. The profile of pJAK-2 and pSTAT-3 after the inhibition JAK-2 and TIMP-1 during 2 hours of OGD.
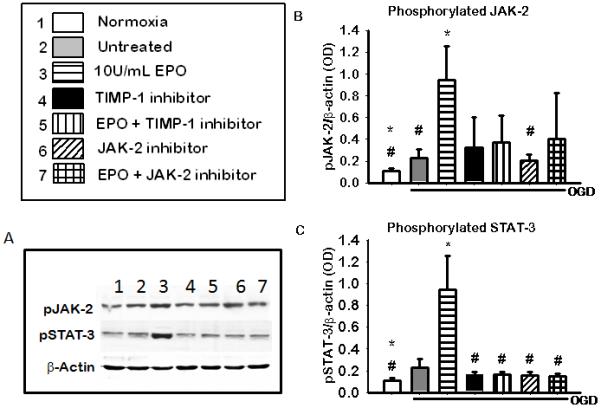
(A) Shows a representative blots of pJAK-2, pSTAT-3 and the b-actin used as the loading control. (B) JAK-2 phosphorylation in the presence of JAK-2 and TIMP-1 inhibitors.(C) STAT-3 phosphorylation in the presence of JAK-2 and TIMP-1 inhibitors. Data represent the mean (±SD): n = 5 in all groups. .* P< 0.05 compared to untreated # P< 0.05 compared to the 10U/ml EPO treated group. Phosphorylation of both JAK-2 and STAT-3 was increase with EPO treatment and reversed by inhibitors.
TIMP-1 Expression and TIMP-1 and MMP-9 Activity Following OGD in Cultures
To determine the importance of TIMP-1 expression in EPO induced neuroprotection we profile the expression and activity of TIMP-1, and its substrate, MMP-9 in the presence and absence of TIMP-1 inhibition and EPO during OGD. A neutralizing antibody was used to inhibit TIMP-1 (3 μg/ml). Thus it was not surprising that although there was a visible increase in TIMP-1 expression figure 3(a) row 1 representative blot and figure 3(b) densiometric quantification. It was expected that only the biological activity and not the expression of TIMP-1 would be altered by the use of a neutralizing antibody, which was shown in figure 3(a) row 3 representative gel and figure 3 (c) densiometric quantification .TIMP-1 activity was significantly increased in EPO treated group (p<0.05) compared to the other groups. There was an inverse correlation betweenTIMP-1 and MMP-9 activity figure 3(a) representative gel and figure 3(d) densiometric quantification. MMP-9 activity was significantly decreased (p<0.05) in the presence of EPO treatment compared to untreated.
Figure 3. The Expression of TIMP-1 and Activity of TIMP-1 and MMP-9 in the presence of JAK-2 and TIMP-1 inhibitors 18 hours after OGD.
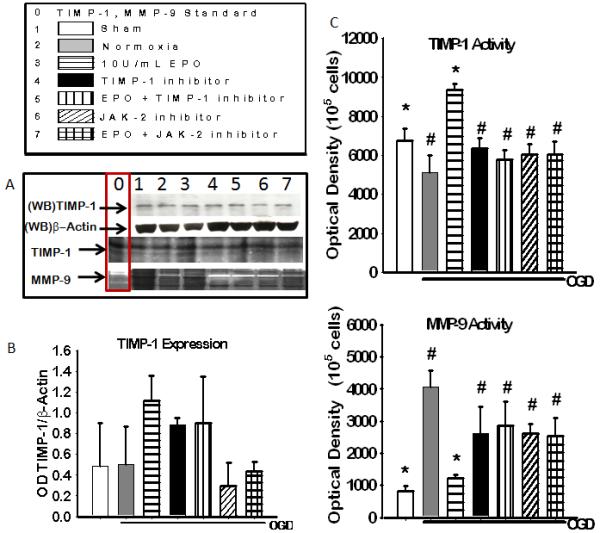
(A) Representative blot (WB) of TIMP-1 and b-actin expression and coomassie blue stain of TIMP-1 activity (dark bands) and MMP – activity (light bands), column 0 shows positive controls for TIMP-1 and MMP-9. (B)Densitometric quantification of western blot for TIMP-1 expression. (C) densiometric calculation of reverse zymography of TIMP-1 activity. (D) Densiometric quantification of zymography of MMP-9 activity. Data represent the mean (±SD): n = 6 in all groups represented in B,C and D. * P < 0.05 in all group compared to untreated. # P < 0.05 compared to 10U/mL EPO treated group. EPO treatment increased TIMP-1 activity and expression and reduced MMP-9 activity.
Reversing EPO’s Neuroprotection
TIMP-1 or JAK-2 inhibitors were added to OGD cells in the presence or absence of EPO to determine if these molecules were necessary for EPO-induced neuroprotection. Neuroprotection was assessed by cell death assays. Inhibition of either JAK-2 or TIMP-1 negated the neuroprotective effects of EPO (Figure 4). Both trypan blue exclusion figure 4 (a) and cell death ELISA figure 4(b) showed a significant increase in cell survival in the presence of EPO treatment compared to untreated and inhibitor groups. EPO induced cell survival was attenuated in the presence of both inhibitors.
Figure 4. The effect of 2 hours of inhibition JAK-2 and TIMP-1 during OGD on cell death.
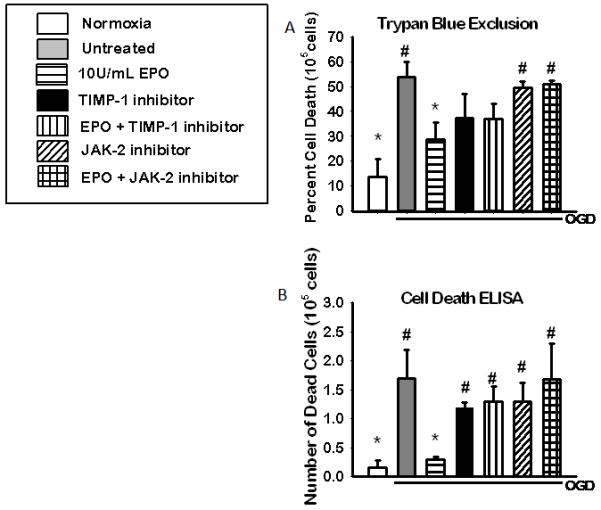
Cell death assays showing the neuroprotective effects of EPO is reduced in the presence of JAK-2 and STAT-3 inhibitors during OGD. Cell viability as assessed by: (A) trypan blue exclusion (n=6) and (B) cell death ELISA (n=5) following HI and 18hrs of recovery. Data represent the mean (±SD). * P< 0.05 compared to untreated. #P < 0.05 in all group compared to 10U/EPO treated group.
In vivo Results Corroborate in vitro Findings
Phosphorylated JAK-2, phosphorylated STAT-3 is necessary for protection in vivo
To determine if the role of JAK-2 and STAT-3 in EPO-induced neuroprotection is similar in animal to that observed in cultures, we profile the phosphorylation of JAK-2 and STAT-3 in the presence and absence of their inhibitors and EPO in the ipsilateral cortex of neonatal hypoxic ischemic pups. Figure 5 (c) shows a significant increase in JAK-2 phosphorylation (p<0.05) in sham, IgG +EPO and DMSO +EPO compared to IgG vehicle and DMSO vehicle as well as TIMP-1 inhibitor with and without EPO. The expression of phosphorylated STAT-3 was also significantly increased in the IgG+ EPO and DMSO + EPO groups (p<0.05) compared to TIMP-1 inhibitor groups with and without EPO and JAK-2 inhibitor groups with and without EPO, Figure 5(c). This suggests a role for JAK-2 and STAT-3 in EPO-induced neuroprotection in vivo.
Figure 5. The profile of phosphorylated JAK-2 and phosphorylated STAT-3 in the ipsilateral cortex of the brain of HI rats (48 hrs) after inhibition of JAK2 or TIMP-1.
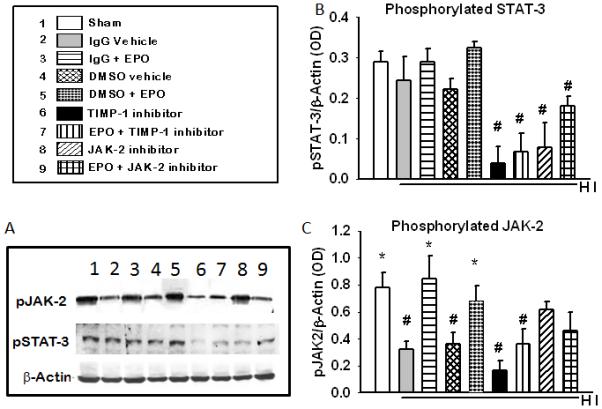
(A) Shows a representative blots of pJAK-2, pSTAT-3 and the b-actin used as the loading control. (B) JAK-2 phosphorylation in the presence of JAK-2 and TIMP-1 inhibitors. (C) STAT-3 phosphorylation in the presence of JAK-2 and TIMP-1 inhibitors. Data represent the mean (±SD): n = 6 in all groups. .* P< 0.05 compared to untreated. # P< 0.05 compared to the 10U/ml EPO treated group. EPO treatment increase the phosphorylation of JAK-2 and STAT-3 and the inhibitors decreased both.
TIMP-1 expression and TIMP-1 and MMP-9 activity in vivo 48 hours after HI
To determine the importance of TIMP-1 expression in EPO induced neuroprotection we profile the expression and activity of TIMP-1, and its substrate, MMP-9 in the presence and absence of TIMP-1 inhibition and EPO during HI. A neutralizing antibody was used to inhibit TIMP-1 (300ng/pup). Neutralizing antibodies binds to the active site of the protein thereby physically inhibiting the interaction of that protein with its substrate. Thus it was not surprising that although there was a visible increase in TIMP-1 expression figure 6(a) row 1 representative blot and figure 6(b) densiometric quantification there was no significant difference between the TIMP-1 inhibitors group and the IgG + EPO groups. . It was expected that only the biological activity and not the expression of TIMP-1 would be altered by the use of a neutralizing antibody, which was shown in figure 6(a) row 3 representative gel and figure 6 (c) densiometric quantification .TIMP-1 activity was significantly increased in the IgG +EPO group (p<0.05) compared to the other groups. There was an inverse correlation betweenTIMP-1 and MMP-9 activity as shown in figure 6. See representative gels figure 6 (a) rows 4 and bar graph in figure 6(d). MMP-9 activity was significantly decreased in the IgG +EPO group (p<0.05) compared to IgG vehicle, EPO+ TIMP-1 inhibitor and EPO + JAK-2 inhibitor. Suggesting that both JAK-2 and TIMP-1 are involved in EPO induce neuroprotection in vivo.
Figure 6. The Expression of TIMP-1 and Activity of TIMP-1 and MMP-9 in the presence of JAK-2 and TIMP-1 inhibitors 48 hours after HI in the brain.
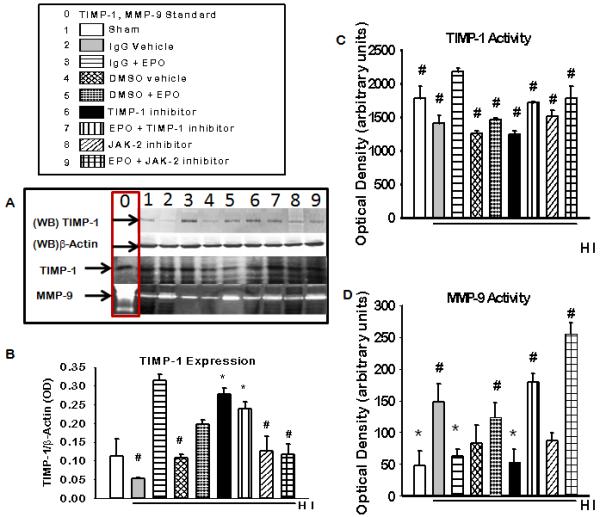
(A) Representative blot (WB) of TIMP-1 and b-actin expression and coomassie blue stain of TIMP-1 activity (dark bands) and MMP –9 activity (light bands), column 0 shows positive controls for TIMP-1 and MMP-9. (B)Densitometric quantification of western blot for TIMP-1 expression. (C) densiometric calculation of reverse zymography of TIMP-1 activity. (D) Densiometric quantification of zymography of MMP-9 activity. Data represent the mean (±SD): n = 6 in all groups represented in B, C and D. * P < 0.05 in all group compared to IgG vehicle # P < 0.05 compared to IgG + EPO group. EPO treatment increased TIMP-1 activity and expression and reduced MMP-9 activity.
Co-localization of TIMP-1 and MMP-9, 48 hours after Hypoxia Ischemia in vivo
To determine that the increase in TIMP-1 expression seen with EPO treatment in vitro also occurred in vivo we performed immunohistochemistry staining for TIMP-1 and MMP-9 in HI animals with EPO using JAK-2 or TIMP-1 inhibitor (Figure 7). There was an increase in TIMP-1 expression and a corresponding decrease in MMP-9 expression in the cortex and hippocampus of animals and visible co-localization between TIMP-1 and MMP-9 in neurons indicating that there is interaction between the two. The optimum dose of both JAK-2 inhibitor (AG490) and TIMP-1 neutralizing antibody was determined by dose response curves (data not shown). The dose that reduced JAK-2 expression and TIMP-1 activity without exacerbating injury was used. The optimum dose of AG490 used in vivo was 15 μM/pup. The dose of TIMP-1 neutralizing antibody used was 300 ng/pup. There was no visible difference between the inhibitor only groups and the inhibitor with EPO groups so only the inhibitors plus EPO group were shown in the figure 7.
Figure 7. TIMP-1 and MMP-9 expression in the brain of neonatal hypoxic ischemic rats after inhibition of JAK-2 and TIMP-1.
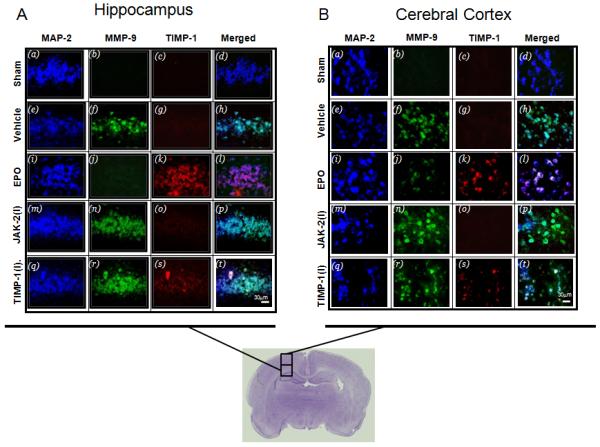
The expression of TIMP-1 (Texas Red) and MMP-9 (green, FITC) in neurons (blue, AMCA) in the (A) hippocampus and (B) cortex of neonatal HI animals treated with (5U/g) EPO. Merge of TIMP-1 and MMP-9 with and without EPO are shown in the right panes. The co-localization of TIMP-1and MMP-9 in neurons 48 hours after hypoxia ischemia in EPO treated neonatal rats. Both inhibitors suppressed the upregulation of TIMP-1 in the presence of EPO treatment.
Inhibition of JAK-2 or TIMP-1 Reverses EPO’s Neuroprotection in vivo
EPO was effective in conferring neuroprotection in 10 day old neonatal hypoxic ischemic pups. Similar to the in vitro results of EPO’s neuroprotective effects were reversed by inhibition of either JAK-2 or TIMP-1 in vivo resulting in increase tissue infarction figure 8(a) representative brain slices, figure 8(b) quantification of infarction. Tissue infarction/cell death was significantly decreased in EPO treated animals without inhibitor compared to both vehicle and inhibitor treated animals.
Figure 8. Triphenyltetrazolium chloride (TTC) staining of brain tissue of neonatal hypoxic ischemic pups after inhibition of JAK-2 and TIMP-1.
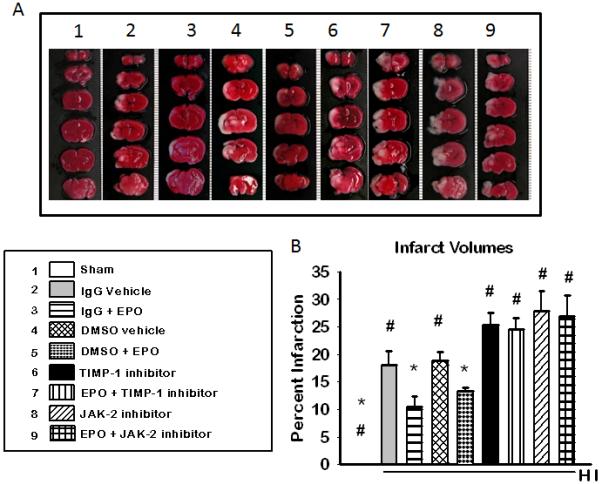
(A) Representative cross-sections from the brain of ischemic rat pups are depicted from anterior top) to posterior (bottom). The white areas show the area of infarction for that pup at that particular cross-sectional level. The mean (±SD) percent area of infarction is represented on the graph in (B). (n=6 for sham) (n= 8 for all other groups). * P < 0.05 in all group compared to IgG vehicle: #P < 0.05 in all group compared to 10U/EPO treated group. Inhibition of JAK or TIMP-1 reverses EPO’s protection in vivo
Discussion
Our findings showed that the upregulation of TIMP-1 by exogenous EPO is necessary for EPO-induced neuroprotection following neonatal hypoxia ischemia or oxygen and glucose deprivation. We also found that that EPO-induced neuroprotection was associated with increased phosphorylation of the JAK-2 receptor, downstream signal transducer STAT-3 and its transcription product TIMP-1 and significantly lower MMP-9 activity.
Erythropoietin is up-regulated during ischemia in the brain of most mammals (Prass et al., 2003). EPO released in response to low oxygen promotes cellular differentiation, proliferation and inhibition of apoptosis (Brines et al. 2000; Sakanaka et al. 1998; Yoshimura 1998).Previous studies have shown that exogenous administration of EPO is associated with neuroprotection in vivo and in vitro which was corroborate by our findings (Sun et al. 2005; Ruscher et al 2002). The optimum dose of EPO needed to produce these effects varies from cell type to cell type (Ruscher et al. 2002; Kadri et al. 2000; Renzi et al. 2002). Chan et al. showed that the optimum dose for JAK-2 activation and MMP-9 inhibition and subsequent protection of cultured ischemic hearts was 5 U/mL (Chan et al 2007). Interestingly EPO was shown to confer neuroprotection at a significantly lower dose of 0.1 U/mL (Rusher et al. 2002). Our results showed that 10 U/mL of EPO were the optimum dose for neuroprotection in NGF differentiated PC-12 cells. We demonstrated the mechanism by which this occurred and the importance of TIMP-1 activity in this protection. Several studies have shown that EPO is associated with the family of JAK receptor tyrosine kinases. It is believed that binding of EPO to its receptor EPOR promotes the phosphorylation of JAK-2 (Lacombe and Mayeux 1999a; Lacombe and Mayeux 1999b; Constantinescu et al. 1999). The phosphorylated receptor recruits different signaling molecules such as STAT proteins 1-6 for phosphorylation, depending on the specific ligand bound to the receptor (Ihle 1995b; Ihle 1995a; Shuai et al. 1992; Kaplan et al. 1996b). The phosphorylated STAT is translocated to the nucleus where it binds to the promoter of specific genes and initiates transcription of that gene (Ihle 1995b; Ihle 1995a; Shuai et al. 1992; Kaplan et al. 1996b). The specific STAT that is associated with EPO is still controversial. According to Chen et al STAT-5, one of the most widely studies transcription factors, is associated with EPOR binding. STAT-5 promotes the transcription of anti-apoptotic gene BCL-XL and activation of Ras mitogen activated protein kinase (MAPK), ERK-1/-2, and PI3K/Akt pathways (Chen et al. 2003; Kilic et al. 2005). However, contrary to previous suggestion that STAT-3 is not involved in EPO’s signaling; our results show that phosphorylated STAT-3 is involved in EPO induced neuroprotection (Rusher et al 2002). This contradiction could possibly be explained by the passage of cells and the age of the animals studied. In our studies we used neonatal models of hypoxia ischemia. Neonatal animals are more likely to express higher levels of STAT-3 than their adult counterparts because STAT-3 is a primordial STAT associated with embryonic development (Murphya et al 2005.). Additionally, STAT-3 is shown to be induced in response to injury in peripheral nerves. It is also shown to be involved in axonal regeneration (Schwaiger et al. 2000; Sheu et al. 2000; Qiu et al. 2005). Studies have shown that STAT-3 binds to the promoter sequences of TIMP-1, which is associated with erythroid cell survival, growth and differentiation in the presence of EPO (Kadri et al. 2000b; Bugno et al. 1995). Our study demonstrates that in non-erythroid cells EPO up-regulates TIMP-1 by phosphorylation of its transcription factor STAT-3. Concordantly, there was a significant decrease in cell viability of EPO treated cells if the JAK/STAT pathway was inhibited or there was a lower expression of phosphorylated STAT-3. We did not study STAT-5 as the role of STAT-5 in EPO induced neuroprotection was previously shown. We did not detect an induction of MMP-2 during OGD in vitro and we observed that MMP-2 was constituently expressed in vivo 48 hours after HI thus we only focused on MMP-9.
In this present study EPO treatment was accompanied by increased phosphorylation of JAK-2, STAT-3 and TIMP-1 expression and activity. Kadri et al. showed EPO induced increase in TIMP-1 expression in erythroid cells (Kadri et al. 2000b; Bugno et al. 1995). However since EPO is shown to have different effects in non hematopoietic cells we needed to verify if TIMP-1 is important for EPO induced neuroprotection. Our findings showed that TIMP-1 neutralizing antibody (figure 3a and 3b) did not significantly alter TIMP-1 expression which was not surprising. Neutralizing antibody alters/inhibits the biological function/activities of cells/receptors/proteins but does not change the protein levels. We observed an inverse correlation between TIMP-1 and MMP-9 activity in the presence of EPO. This finding is consistent with studies done by earlier authors which show similar correlations in erythroid cells (Kadri et al. 2000b; Bugno et al. 1995). Our in vivo studies also reflect a similar correlation between TIMP-1 and MMP-9 expression. There was a higher expression of MMP-9 as shown by imunohistochemistry in the vehicle group compared to EPO treated or sham operated animals. This finding seems to contradict previous studies which showed that EPO increased MMP2/9 secretion into the media of endothelial cells (Wang L. et al). This apparent disparity could be explained by the difference in media and whole cell lysate. Additionally endothelial cells make up a small proportion of brain tissue and thus would not impact total MMP-9 activity. In vivo inhibitions of either JAK-2 or TIMP-1 show a notable decrease in TIMP-1 expression (immunohistochemistry) even with EPO treatment which we also saw with our TIMP-1 activity but not expression. Immunohistochemistry preserves protein structure and integrity thus allowing for continued interaction between the active site of TIMP-1 and the neutralizing antibody. However during western blotting the protein is run under denaturing conditions thus allowing for separation of the neutralizing antibody from the epitope. Thus it not surprising that visible TIMP-1 suppression was observes via immunohistochemistry in the TIMP-1 neutralizing antibody group that was not seen in the western blot results. The interplay between EPO, TIMP and MMP appeared to be occurring primarily in neuron, whether this interaction is autocrine or paracrine is still to be elucidated.
The mechanism by which EPO confers its neuroprotection is still unfolding. In 2002, Ruscher et al observed that inhibition of the JAK/STAT pathway with pharmaceutical inhibitor AG490 abolished EPO’s neuroprotection in an in-vitro model of hypoxia ischemia (Ruscher et al. 2002). This was validated by our findings both in vitro and in vivo. However the reversal of EPO’s neuroprotection by inhibition of TIMP-1 that we observed was not previously shown in neuronal cell in vitro or in vivo. Thus based on this observation we concluded that in addition to the activity of the JAK/STAT pathway TIMP-1 also plays a crucial role in EPO-induced neuroprotection in in-vivo and in vitro models of hypoxia ischemia. This finding provides important information for expanding our understanding of EPO as a potential treatment for neonatal hypoxic-ischemic brain injury.
Research Highlights.
TIMP-1 mediates EPO-induced neuroprotection
STAT-3 is necessary for EPO-induced neuroprotection
The above mediator of EPO were studied in vitro and in vivo
Abbreviations
- EPO
Erythropoietin
- HI
Hypoxia Ischemia
- JAK
Janus Kinase
- MMP
Matrix Metalloproteinase
- NGF
Neuronal Growth Factor
- OGD
Oxygen and Glucose Deprivation
- STAT
Signal Transducer and Activator of Transcription
- TIMP
Tissue Inhibitor of matrix Metalloproteinase
Footnotes
Publisher's Disclaimer: This is a PDF file of an unedited manuscript that has been accepted for publication. As a service to our customers we are providing this early version of the manuscript. The manuscript will undergo copyediting, typesetting, and review of the resulting proof before it is published in its final citable form. Please note that during the production process errors may be discovered which could affect the content, and all legal disclaimers that apply to the journal pertain.
Reference List
- Agani FH, Puchowicz M, Chavez JC, Pichiule P, LaManna J. Role of nitric oxide in the regulation of HIF-1alpha expression during hypoxia. Am. J. Physiol Cell Physiol. 2002;283:C178–C186. doi: 10.1152/ajpcell.00381.2001. [DOI] [PubMed] [Google Scholar]
- Andrews NC, Faller DV. A rapid micropreparation technique for extraction of DNA-binding proteins from limiting numbers of mammalian cells. Nucleic Acids Res. 1991;19:2499. doi: 10.1093/nar/19.9.2499. [DOI] [PMC free article] [PubMed] [Google Scholar]
- Baker AH, Edwards DR, Murphy G. Metalloproteinase inhibitors: biological actions and therapeutic opportunities. J. Cell Sci. 2002;115:3719–3727. doi: 10.1242/jcs.00063. [DOI] [PubMed] [Google Scholar]
- Brines ML, Ghezzi P, Keenan S, Agnello D, de Lanerolle NC, Cerami C, Itri LM, Cerami A. Erythropoietin crosses the blood-brain barrier to protect against experimental brain injury. Proc. Natl. Acad. Sci. U. S. A. 2000;97:10526–10531. doi: 10.1073/pnas.97.19.10526. [DOI] [PMC free article] [PubMed] [Google Scholar]
- Bugno M, Graeve L, Gatsios P, Koj A, Heinrich PC, Travis J, Kordula T. Identification of the interleukin-6/oncostatin M response element in the rat tissue inhibitor of metalloproteinases-1 (TIMP-1) promoter. Nucleic Acids Res. 1995;23:5041–5047. doi: 10.1093/nar/23.24.5041. [DOI] [PMC free article] [PubMed] [Google Scholar]
- Calvert JW, Yin W, Patel M, Badr A, Mychaskiw G, Parent AD, Zhang JH. Hyperbaric oxygenation prevented brain injury induced by hypoxia-ischemia in a neonatal rat model. Brain Res. 2002;951:1–8. doi: 10.1016/s0006-8993(02)03094-9. [DOI] [PubMed] [Google Scholar]
- Carmichael RD, Gordon AS, Lobue J. Effects of the hormone erythropoietin in milk on erythropoiesis in neonatal rats. Endocrinol. Exp. 1986;20:167–188. [PubMed] [Google Scholar]
- Chen CW, Chang YH, Tsi CJ, Lin WW. Inhibition of IFN-gamma-mediated inducible nitric oxide synthase induction by the peroxisome proliferator-activated receptor gamma agonist, 15-deoxy-delta 12,14-prostaglandin J2, involves inhibition of the upstream Janus kinase/STAT1 signaling pathway. J. Immunol. 2003;171:979–988. doi: 10.4049/jimmunol.171.2.979. [DOI] [PubMed] [Google Scholar]
- Chen YD, Xu X, Xia X, Wu H, Liu K, Zheng Z, Zhu D. MMP9 is involved in glycation end-products induced increase of retinal vascular permeability in rats and the therapeutic effect of minocycline. Curr. Eye Res. 2008;33:977–983. doi: 10.1080/02713680802450984. [DOI] [PubMed] [Google Scholar]
- Constantinescu SN, Ghaffari S, Lodish HF. The Erythropoietin Receptor: Structure, Activation and Intracellular Signal Transduction. Trends Endocrinol. Metab. 1999;10:18–23. doi: 10.1016/s1043-2760(98)00101-5. [DOI] [PubMed] [Google Scholar]
- Chan CY, Chen YS, Lee HH, Huang HS, Lai YL, Chen CF, Ma MC. Erythropoietin protects post-ischemic hearts by preventing extracellular matrix degradation: role of Jak2-ERK pathway. Life Sci. 2007;81:717–723. doi: 10.1016/j.lfs.2007.07.013. [DOI] [PubMed] [Google Scholar]
- Dickson G, Prentice H, Julien JP, Ferrari G, Leon A, Walsh FS. Nerve growth factor activates Thy-1 and neurofilament gene transcription in rat PC12 cells. EMBO J. 1986;5:3449–3453. doi: 10.1002/j.1460-2075.1986.tb04668.x. [DOI] [PMC free article] [PubMed] [Google Scholar]
- Dominguez E, Rivat C, Pommier B, Mauborgne A, Pohl M. JAK/STAT3 pathway is activated in spinal cord microglia after peripheral nerve injury and contributes to neuropathic pain development in rat. J. Neurochem. 2008;107:50–60. doi: 10.1111/j.1471-4159.2008.05566.x. [DOI] [PubMed] [Google Scholar]
- Gomez DE, Alonso DF, Yoshiji H, Thorgeirsson UP. Tissue inhibitors of metalloproteinases: structure, regulation and biological functions. Eur. J. Cell Biol. 1997;74:111–122. [PubMed] [Google Scholar]
- Greene T. Current therapy for acute leukemia in childhood. Nurs. Clin. North Am. 1976;11:3–19. [PubMed] [Google Scholar]
- Harpur AG, Andres AC, Ziemiecki A, Aston RR, Wilks AF. JAK2, a third member of the JAK family of protein tyrosine kinases. Oncogene. 1992;7:1347–1353. [PubMed] [Google Scholar]
- Hu X, Brannstrom T, Gu W, Wester P. A photothrombotic ring stroke model in rats with or without late spontaneous reperfusion in the region at risk. Brain Res. 1999;849:175–186. doi: 10.1016/s0006-8993(99)02152-6. [DOI] [PubMed] [Google Scholar]
- Ihle JN. The Janus protein tyrosine kinase family and its role in cytokine signaling. Adv. Immunol. 1995a;60:1–35. doi: 10.1016/s0065-2776(08)60582-9. [DOI] [PubMed] [Google Scholar]
- Ihle JN. The Janus protein tyrosine kinases in hematopoietic cytokine signaling. Semin. Immunol. 1995b;7:247–254. doi: 10.1006/smim.1995.0029. [DOI] [PubMed] [Google Scholar]
- Jiang Y, Goldberg ID, Shi YE. Complex roles of tissue inhibitors of metalloproteinases in cancer. Oncogene. 2002;21:2245–2252. doi: 10.1038/sj.onc.1205291. [DOI] [PubMed] [Google Scholar]
- Kadri N, Mouchtaq N, Hakkou F, Moussaoui D. Relapses in bipolar patients: changes in social rhythm? Int. J. Neuropsychopharmacol. 2000a;3:45–49. doi: 10.1017/S1461145799001704. [DOI] [PubMed] [Google Scholar]
- Kadri Z, Petitfrere E, Boudot C, Freyssinier JM, Fichelson S, Mayeux P, Emonard H, Hornebeck W, Haye B, Billat C. Erythropoietin induction of tissue inhibitors of metalloproteinase-1 expression and secretion is mediated by mitogen-activated protein kinase and phosphatidylinositol 3-kinase pathways. Cell Growth Differ. 2000b;11:573–580. [PubMed] [Google Scholar]
- Kaplan MH, Sun YL, Hoey T, Grusby MJ. Impaired IL-12 responses and enhanced development of Th2 cells in Stat4-deficient mice. Nature. 1996b;382:174–177. doi: 10.1038/382174a0. [DOI] [PubMed] [Google Scholar]
- Kilic U, Kilic E, Soliz J, Bassetti CI, Gassmann M, Hermann DM. Erythropoietin protects from axotomy-induced degeneration of retinal ganglion cells by activating ERK-1/-2. FASEB J. 2005;19:249–251. doi: 10.1096/fj.04-2493fje. [DOI] [PubMed] [Google Scholar]
- Lacombe C, Mayeux P. Erythropoietin (Epo) receptor and Epo mimetics. Adv. Nephrol. Necker Hosp. 1999a;29:177–189. [PubMed] [Google Scholar]
- Lacombe C, Mayeux P. The molecular biology of erythropoietin. Nephrol. Dial. Transplant. 1999b;14(Suppl 2):22–28. doi: 10.1093/ndt/14.suppl_2.22. [DOI] [PubMed] [Google Scholar]
- Leonardo CC, Hall AA, Collier LA, Green SM, Willing AE, Pennypacker KR. Administration of a Sigma Receptor Agonist Delays MCAO-Induced Neurodegeneration and White Matter Injury. Transl. Stroke Res. 2010;1:135–145. doi: 10.1007/s12975-009-0005-9. [DOI] [PMC free article] [PubMed] [Google Scholar]
- Pang Y, Cai Z, Rhodes PG. Disturbance of oligodendrocyte development, hypomyelination and white matter injury in the neonatal rat brain after intracerebral injection of lipopolysaccharide. Brain Res. Dev. Brain Res. 2003;140:205–214. doi: 10.1016/s0165-3806(02)00606-5. [DOI] [PubMed] [Google Scholar]
- Prass K, Scharff A, Ruscher K, Lowl D, Muselmann C, Victorov I, Kapinya K, Dirnagl U, Meisel A. Hypoxia-induced stroke tolerance in the mouse is mediated by erythropoietin. Stroke. 2003;34:1981–1986. doi: 10.1161/01.STR.0000080381.76409.B2. [DOI] [PubMed] [Google Scholar]
- Qiu J, Cafferty WB, McMahon SB, Thompson SW. Conditioning injury-induced spinal axon regeneration requires signal transducer and activator of transcription 3 activation. J. Neurosci. 2005;25:1645–1653. doi: 10.1523/JNEUROSCI.3269-04.2005. [DOI] [PMC free article] [PubMed] [Google Scholar]
- Renzi MJ, Farrell FX, Bittner A, Galindo JE, Morton M, Trinh H, Jolliffe LK. Erythropoietin induces changes in gene expression in PC-12 cells. Brain Res. Mol. Brain Res. 2002;104:86–95. doi: 10.1016/s0169-328x(02)00323-6. [DOI] [PubMed] [Google Scholar]
- Ruscher K, Freyer D, Karsch M, Isaev N, Megow D, Sawitzki B, Priller J, Dirnagl U, Meisel A. Erythropoietin is a paracrine mediator of ischemic tolerance in the brain: evidence from an in vitro model. J. Neurosci. 2002;22:10291–10301. doi: 10.1523/JNEUROSCI.22-23-10291.2002. [DOI] [PMC free article] [PubMed] [Google Scholar]
- Sakanaka M, Wen TC, Matsuda S, Masuda S, Morishita E, Nagao M, Sasaki R. In vivo evidence that erythropoietin protects neurons from ischemic damage. Proc. Natl. Acad. Sci. U. S. A. 1998a;95:4635–4640. doi: 10.1073/pnas.95.8.4635. [DOI] [PMC free article] [PubMed] [Google Scholar]
- Schwaiger FW, Hager G, Schmitt AB, Horvat A, Hager G, Streif R, Spitzer C, Gamal S, Breuer S, Brook GA, Nacimiento W, Kreutzberg GW. Peripheral but not central axotomy induces changes in Janus kinases (JAK) and signal transducers and activators of transcription (STAT) Eur. J. Neurosci. 2000;12:1165–1176. doi: 10.1046/j.1460-9568.2000.00005.x. [DOI] [PubMed] [Google Scholar]
- Shein NA, Grigoriadis N, Alexandrovich AG, Simeonidou C, Spandou E, Tsenter J, Yatsiv I, Horowitz M, Shohami E. Differential neuroprotective properties of endogenous and exogenous erythropoietin in a mouse model of traumatic brain injury. J Neurotrauma. 2008;25:112–123. doi: 10.1089/neu.2007.0358. [DOI] [PubMed] [Google Scholar]
- Sheu JY, Kulhanek DJ, Eckenstein FP. Differential patterns of ERK and STAT3 phosphorylation after sciatic nerve transection in the rat. Exp. Neurol. 2000;166:392–402. doi: 10.1006/exnr.2000.7508. [DOI] [PubMed] [Google Scholar]
- Shuai K, Schindler C, Prezioso VR, Darnell JE., Jr. Activation of transcription by IFN-gamma: tyrosine phosphorylation of a 91-kD DNA binding protein. Science. 1992a;258:1808–1812. doi: 10.1126/science.1281555. [DOI] [PubMed] [Google Scholar]
- Stetler-Stevenson WG. Type IV collagenases in tumor invasion and metastasis. Cancer Metastasis Rev. 1990;9:289–303. doi: 10.1007/BF00049520. [DOI] [PubMed] [Google Scholar]
- Stetler-Stevenson WG, Brown PD, Onisto M, Levy AT, Liotta LA. Tissue inhibitor of metalloproteinases-2 (TIMP-2) mRNA expression in tumor cell lines and human tumor tissues. J. Biol. Chem. 1990;265:13933–13938. [PubMed] [Google Scholar]
- Sun Y, Calvert JW, Zhang JH. Neonatal hypoxia/ischemia is associated with decreased inflammatory mediators after erythropoietin administration. Stroke. 2005b;36:1672–1678. doi: 10.1161/01.STR.0000173406.04891.8c. [DOI] [PubMed] [Google Scholar]
- Sun Y, Calvert JW, Zhang JH. Neonatal hypoxia/ischemia is associated with decreased inflammatory mediators after erythropoietin administration. Stroke. 2005a;36:1672–1678. doi: 10.1161/01.STR.0000173406.04891.8c. [DOI] [PubMed] [Google Scholar]
- Tang J, Liu J, Zhou C, Alexander JS, Nanda A, Granger DN, Zhang JH. Mmp-9 deficiency enhances collagenase-induced intracerebral hemorrhage and brain injury in mutant mice. J. Cereb. Blood Flow Metab. 2004;24:1133–1145. doi: 10.1097/01.WCB.0000135593.05952.DE. [DOI] [PubMed] [Google Scholar]
- Toth C, Martinez JA, Liu WQ, Diggle J, Guo GF, Ramji N, Mi R, Hoke A, Zochodne DW. Local erythropoietin signaling enhances regeneration in peripheral axons. Neuroscience. 2008;154:767–783. doi: 10.1016/j.neuroscience.2008.03.052. [DOI] [PubMed] [Google Scholar]
- Vannucci RC. Hypoxic-ischemic encephalopathy. Am. J. Perinatol. 2000;17:113–120. doi: 10.1055/s-2000-9293. [DOI] [PubMed] [Google Scholar]
- Vannucci RC, Connor JR, Mauger DT, Palmer C, Smith MB, Towfighi J, Vannucci SJ. Rat model of perinatal hypoxic-ischemic brain damage. J. Neurosci. Res. 1999;55:158–163. doi: 10.1002/(SICI)1097-4547(19990115)55:2<158::AID-JNR3>3.0.CO;2-1. [DOI] [PubMed] [Google Scholar]
- Wang JL, Sun Y, Wu S. Gamma-irradiation induces matrix metalloproteinase II expression in a p53-dependent manner. Mol. Carcinog. 2000;27:252–258. doi: 10.1002/(sici)1098-2744(200004)27:4<252::aid-mc2>3.0.co;2-3. [DOI] [PubMed] [Google Scholar]
- Wang L, Zhang ZG, Zhang RL, Gregg SR, Hozeska-Solgot A, LeTourneau Y, Wang Y, Chopp M. Matrix metalloproteinase 2 (MMP2) and MMP9 secreted by erythropoietin-activated endothelial cells promote neural progenitor cell migration. J Neurosci. 2006;26:5996–6003. doi: 10.1523/JNEUROSCI.5380-05.2006. [DOI] [PMC free article] [PubMed] [Google Scholar]
- Witthuhn BA, Quelle FW, Silvennoinen O, Yi T, Tang B, Miura O, Ihle JN. JAK2 associates with the erythropoietin receptor and is tyrosine phosphorylated and activated following stimulation with erythropoietin. Cell. 1993;74:227–236. doi: 10.1016/0092-8674(93)90414-l. [DOI] [PubMed] [Google Scholar]
- Wu B, Ma Q, Khatibi N, Chen W, Sozen T, Cheng O, Tang J. Ac-YVAD-CMK Deceases Blood-Brain Barrier Degradation by Inhibiting Caspase-1 Activation of Interleukin-1beta in Intracerebral Hemorrhage Mouse Model. Transl Stroke Res. 2010;1:57–64. doi: 10.1007/s12975-009-0002-z. [DOI] [PMC free article] [PubMed] [Google Scholar]
- Yin D, Zhou C, Kusaka I, Calvert JW, Parent AD, Nanda A, Zhang JH. Inhibition of apoptosis by hyperbaric oxygen in a rat focal cerebral ischemic model. J. Cereb. Blood Flow Metab. 2003;23:855–864. doi: 10.1097/01.WCB.0000073946.29308.55. [DOI] [PubMed] [Google Scholar]
- Yoshimura A. The CIS family: negative regulators of JAK-STAT signaling. Cytokine Growth Factor Rev. 1998;9:197–204. doi: 10.1016/s1359-6101(98)00019-7. [DOI] [PubMed] [Google Scholar]
- Zagorska A, Dulak J. HIF-1: the knowns and unknowns of hypoxia sensing. Acta Biochim. Pol. 2004;51:563–585. [PubMed] [Google Scholar]


