

Abstract
Background
Evaluating trends in colorectal cancer (CRC) screening use is critical for understanding screening implementation, and whether population groups targeted for screening are receiving it, consistent with guidelines. This study examines recent national trends in CRC test use, including among vulnerable populations.
Methods
We used the 2000, 2003, 2005, and 2008 National Health Interview Survey to examine national trends in CRC screening use overall and for FOBT, sigmoidoscopy, and colonoscopy. We also assessed trends by race/ethnicity, educational attainment, income, time in the U.S., and access to health care.
Results
During 2000–2008, significant declines in FOBT and sigmoidoscopy use and significant increases in colonoscopy use and in the percentages of adults up-to-date with CRC screening occurred overall and for most population subgroups. Subgroups with consistently lower rates of colonoscopy use and being up-to-date included Hispanics; people with minimal education, low income, or no health insurance; recent immigrants; and those with no usual source of care or physician visits in the past year. Among up-to-date adults, there were few subgroup differences in the type of test by which they were up-to-date (i.e., FOBT, sigmoidoscopy, or colonoscopy).
Conclusions
Although use of CRC screening and of colonoscopy increased among U.S. adults, including those from vulnerable populations, 45% of adults aged 50–75—or nearly 35 million people—were not up-to-date with screening in 2008.
Impact
Continued monitoring of CRC screening rates among population subgroups with consistently low utilization is imperative. Improvement in CRC screening rates among all population groups in the U.S. is still needed.
Keywords: colorectal cancer, screening, trends, health disparities, National Health Interview Survey
INTRODUCTION
Since the mid-1990s, multiple expert groups in the U.S. have recommended screening asymptomatic, average-risk adults for colorectal cancer (CRC) (1–3). In its most recent guidance published in 2008, the U.S. Preventive Services Task Force (USPSTF) strongly recommends screening average-risk adults aged 50–75 for CRC with annual high-sensitivity FOBT, sigmoidoscopy every five years, or colonoscopy every ten years (4). Although CRC screening rates in the U.S. have increased from 20%–30% in 1997 to nearly 55% in 2008, millions of eligible adults are not screened (5). Moreover, certain population subgroups—including Hispanics, people with low income or low educational attainment, recent immigrants, and those without health insurance, a usual source of care, or recent physician contact—have shown especially low CRC screening rates (6–10). For purposes of this report, we have defined these seven subgroups as vulnerable populations.
Evaluating trends in the use of CRC screening is important for understanding how screening is being implemented in practice in the U.S.; to assess whether the population groups targeted for screening are receiving it, consistent with guidelines; and to identify potential problems with underuse, overuse, and misuse of screening (11). Although some prior studies have examined trends in use of CRC screening, their focus has been on the Medicare population, or they have not included more contemporaneous data or comprehensively assessed trends among vulnerable populations (12–18). Following implementation by the Medicare program in 2001 of coverage for CRC screening with colonoscopy for average-risk enrollees, colonoscopy use has increased rapidly (5); of particular interest but relatively unexplored is whether vulnerable populations use colonoscopy at rates comparable to non-vulnerable groups. In the present study, we aim to 1) describe recent national trends in CRC test use overall and among seven population subgroups that historically have demonstrated lower rates of cancer screening; 2) assess whether vulnerable subgroups are less likely to receive colonoscopy than their less vulnerable counterparts; 3) provide baseline data for assessing trends in CRC test use following implementation of health care reform measures.
METHODS
Data Source
We used data from the 2000, 2003, 2005, and 2008 National Health Interview Survey (NHIS) to examine national trends in the overall use of CRC screening and in use of FOBT, sigmoidoscopy, and colonoscopy. The NHIS is a multi-purpose health survey sponsored by the National Center for Health Statistics, Centers for Disease Control and Prevention. Conducted annually since 1957, the NHIS is the principal source of information on the health of the civilian, non-institutionalized household population of the U.S. The majority of NHIS interviews are conducted in person by trained personnel from the U.S. Census Bureau. Response rates for the NHIS survey years included in this analysis were 72% (2000), 74% (2003), 69% (2005), and 63% (2008); more information about response rates is available in the appendices for each year’s survey description (19–22). Survey responses were weighted to reflect the probability of selection into the sample and survey non-response.
Men and women aged 40 or older were asked whether they had ever had a sigmoidoscopy, colonoscopy, or proctoscopy, and when they had their most recent exam. They also were asked whether they ever had a blood stool test using a home test kit, and when they had their most recent test. Brief descriptions of each test were provided. Respondents were also asked to report their age, race/ethnicity, educational attainment, household income, time in the U.S., type of health care coverage, whether there was a place that they usually went when they were sick or needed advice about their health, and the number of times they saw a physician in the past year. Complete survey instrumentation for the NHIS is available from the National Center for Health Statistics (23).
Measures
CRC test use
Consistent with current USPSTF recommendations (4), we defined CRC test use as having had a home FOBT in the past year, sigmoidoscopy in the past five years, colonoscopy in the past ten years, or any of these (up-to-date with CRC screening). We included in this definition tests done for any reason, not just as part of a routine exam, because the reported reason for having the test may not be accurate, and having the test within the recommended time interval, regardless of the reason, essentially means that the individual has been screened.
Race/ethnicity
We used the racial/ethnic designations approved by the federal Office of Management and Budget (24) to categorize respondents as non-Hispanic white, non-Hispanic black, Hispanic, non-Hispanic Asian, and other race/ethnicity.
Education
Educational attainment was based on the highest level of education achieved by the respondent and categorized as more than high school, high school graduate, and not attaining a high school diploma.
Income
Annual income was recorded for each family and reported as a percentage of the federal poverty level (FPL). Families with a computed FPL at or below 100% are considered impoverished. We categorized respondents according to the FPL of their interview year, as follows: <200% FPL, 200%–<300% FPL, 300%–<400% FPL, 400%–<500% FPL, and ≥500% FPL and higher. Multiple imputation was used to impute missing data for NHIS income questions (25).
Time in the U.S
Time in the U.S. was measured as born in the U.S., immigrated to the U.S. ten or more years ago, and immigrated to the U.S. less than ten years ago.
Health Insurance
We developed separate categories for type of health insurance for respondents aged 50–64 and 65–75. For the 50–64 subgroup, respondents were categorized as having private HMO, private non-HMO, public (i.e., Medicaid, Medicare, other government-sponsored insurance), or no insurance. For the 65–75 subgroup, respondents were categorized as having Medicare HMO; Medicare plus private supplemental insurance; Medicare with no supplemental insurance; Medicaid, military, or other government-sponsored insurance; or no insurance or Medicare Part A only.
Usual Source of Care
Respondents who indicated that they had a place where they usually went when they were sick or needed advice about their health were defined as having a usual source of care. Those who either reported they did not have a place or the place they went to most often was an emergency room were defined as having no usual source of care.
Physician Visits
We used three categories to measure the respondent’s number of physician visits in the past year: none, one, and two or more.
Data Analysis
We used descriptive statistics to characterize overall use of CRC tests and use by specific test modality. Consistent with current USPSTF recommendations (4), we restricted the analysis to adults who were 50 to 75 years of age at the time of the interview. To approximate an average-risk screening population, we excluded individuals who reported a personal history of CRC (n=320). Respondents who reported being up-to-date for multiple tests were counted as receiving the test when calculating percentages for each test option reported. All percentages reported in the tables and figure were standardized to the 2000 U.S. population by five-year age groups. The statistical significance of overall trends and each subgroup category trend was tested using logistic regression modeling; separate models were estimated for each test modality and subgroup category. The models included respondent age in five-year categories to control for changes in the age structure of the U.S. population over time, and survey year for assessment of the statistical significance of the trend. Wald chi-square tests for association of independent variables with each dependent variable (i.e., had home FOBT in the past year vs. did not; had sigmoidoscopy in the past five years vs. did not; had colonoscopy in the past 10 years vs. did not; up-to-date with CRC screening vs. not) were computed. Statistical tests were two-sided, and a P-value of 0.05 was considered to be statistically significant.
We conducted a subsidiary analysis among respondents who were up-to-date with CRC screening to assess whether there were subgroup differences in the type of test by which they were up-to-date (i.e., FOBT only, sigmoidoscopy only, colonoscopy only, or up-to-date by multiple test modalities). We used the 2000 and 2008 NHIS data to calculate percentages and 95% confidence intervals for each type of test and compared them across the two time periods to assess trends in test use patterns.
Survey weights were applied in the analyses to reflect the probability of selection into the sample and adjust for nonresponse and poststratification; the weighted data yield national estimates of the prevalence of CRC test use overall, by test modality, and by population subgroup. SUDAAN version 9.0 was used to analyze the data; this statistical package accounts for the complex design of the NHIS and allows for calculation of accurate standard errors, from which 95% confidence intervals around point estimates were derived.
RESULTS
Sample and U.S. Population Estimates for Adults aged 50–75
Sample size and U.S. population estimates for each year and by population subgroup are shown in Table 1. The U.S. civilian, non-institutionalized population aged 50–75 grew from an estimated 60 million people in 2000 to nearly 77 million people in 2008. The population subgroups shown in the table also increased in size over this time period, except for people with less than a high school education, with private HMO or Medicare HMO health insurance, or who were aged 65–75 and uninsured or had only Medicare Part A coverage. The number of people aged 65–75 with Medicare plus private supplemental coverage remained essentially the same over the period 2000–2008.
Table 1.
Sample Size and U.S. Population Estimates* for Adults aged 50–75, National Health Interview Survey 2000–2008
| 2000 | 2003 | 2005 | 2008 | |||||
|---|---|---|---|---|---|---|---|---|
| n | N | n | N | n | N | n | N | |
| Overall | 10,041 | 60,120,556 | 9,928 | 66,367,948 | 10,733 | 70,151,788 | 7,776 | 76,763,249 |
| Race/Ethnicity | ||||||||
| NH White | 7,233 | 47,913,678 | 7,139 | 52,543,643 | 7,639 | 54,401,706 | 5,236 | 57,922,863 |
| NH Black | 1,305 | 5,569,419 | 1,258 | 6,391,692 | 1,429 | 6,957,214 | 1,165 | 7,957,136 |
| Hispanic | 1,186 | 4,399,116 | 1,218 | 5,151,211 | 1,237 | 5,654,680 | 911 | 6,728,265 |
| NH Asian | 205 | 1,547,048 | 202 | 1,589,687 | 283 | 2,210,807 | 329 | 2,949,205 |
| Education | ||||||||
| >High School | 4,392 | 27,615,842 | 4,734 | 33,165,278 | 5,442 | 36,643,584 | 4,127 | 42,405,243 |
| High School Graduate | 3.088 | 19,204,541 | 2,995 | 20,652,409 | 3,232 | 21,813,778 | 2,259 | 22,310,729 |
| <High School | 2,433 | 12,514,502 | 2,026 | 11,374,206 | 1,930 | 10,849,488 | 1,332 | 11,400,937 |
| Family Income (% FPL) | ||||||||
| 500%+ | 2,798 | 19,670,541 | 2,754 | 21,676,932 | 3,188 | 24,234,310 | 2,389 | 27,674,983 |
| 400% –<500% | 992 | 6,411,053 | 1,014 | 7,198,802 | 1,047 | 7,330,034 | 761 | 8,130,622 |
| 300% –<400% | 1,259 | 7,901,910 | 1,301 | 8,962,111 | 1,463 | 9,929,025 | 1,057 | 10,825,327 |
| 200% –<300% | 1,747 | 10,360,448 | 1,698 | 11,189,666 | 1,727 | 10,961,088 | 1,219 | 11,510,251 |
| <200% | 3,245 | 15,776,604 | 3,162 | 17,340,437 | 3,309 | 17,697,331 | 2,349 | 18,622,066 |
| Time in the U.S. | ||||||||
| Born in U.S. | 8,748 | 53,500,959 | 8,579 | 58,696,863 | 9,247 | 61,359,559 | 6,588 | 66,551,312 |
| Immigrant, in U.S. 10+ Years | 1,031 | 5,170,983 | 1,164 | 6,505,103 | 1,300 | 7,605,197 | 1,073 | 9,145,404 |
| Immigrant, in U.S. <10 Years | 134 | 776,187 | 137 | 892,854 | 142 | 928,520 | 90 | 835,973 |
| Health Insurance—Ages 50–64 | ||||||||
| Private non-HMO | 2,862 | 19,663,349 | 3,192 | 24,057,110 | 3,627 | 26,505,422 | 2,643 | 29,692,875 |
| Private HMO | 1,910 | 12,199,153 | 1,648 | 11,612,087 | 1,657 | 11,652,507 | 992 | 10,182,499 |
| Public | 813 | 3,947,810 | 975 | 5,429,748 | 1,046 | 5,734,111 | 915 | 8,149,749 |
| Uninsured | 886 | 4,627,743 | 940 | 5,486,960 | 1,041 | 6,126,622 | 718 | 6,930,625 |
| Health Insurance—Ages 65–75 | ||||||||
| Medicare + Private | 1,944 | 11,631,560 | 1,693 | 11,517,482 | 1,700 | 10,864,474 | 1,195 | 11,513,029 |
| Medicare HMO | 597 | 3,128,678 | 351 | 1,978,735 | 396 | 2,263,677 | 329 | 2,572,604 |
| Medicare, no Supplemental | 516 | 2,614,259 | 540 | 3,190,164 | 693 | 4,032,079 | 559 | 4,565,195 |
| Medicaid, Military, Other Government | 386 | 1,607,414 | 482 | 2,499,011 | 478 | 2,456,428 | 367 | 2,649,194 |
| Uninsured or Medicare Part A only | 87 | 458,553 | 69 | 359,875 | 62 | 365,189 | 47 | 345,054 |
| Has Usual Source of Care | ||||||||
| Yes (excluding E.R.) | 9,137 | 55,174,724 | 9,038 | 61,025,909 | 9,718 | 64,039,052 | 7,008 | 69,503,281 |
| No | 838 | 4,622,595 | 814 | 4,850,947 | 907 | 5,463,296 | 661 | 6,266,798 |
| # Physician Visits in Past Year | ||||||||
| Two or more | 7,249 | 43,606,924 | 7,272 | 48,865,333 | 7,788 | 51,105,829 | 5,669 | 55,837,224 |
| One | 1,334 | 8,357,917 | 1,236 | 8,586,391 | 1,478 | 9,896,285 | 1,042 | 10,766,323 |
| None | 1,296 | 7,276,414 | 1,236 | 7,770,913 | 1,246 | 7,869,436 | 888 | 8,583,344 |
for the U.S. civilian, non-institutionalized population
Note: n=sample size; N=U.S. population estimate
Trends in Home FOBT Use
Use of home FOBT among U.S. adults aged 50–75 declined during 2000–2008 by 6.5 percentage points; in 2008, eleven percent of adults reported that they had completed a home FOBT in the past year (Table 2). Statistically significant declines ranging from 3.6 to 13.6 percentage points occurred for non-Hispanic whites and non-Hispanic blacks; all education and income groups; people born in the U.S.; people with private health insurance or Medicare coverage; those reporting a usual source of health care; and those who had seen a physician at least once in the past year.
Table 2.
Reported Home FOBT in the Past Year, U.S. Adults aged 50–75, National Health Interview Survey 2000–2008*
| 2000 | 2003 | 2005 | 2008 | Percentage point change, 2000–2008 |
|
|---|---|---|---|---|---|
| % (95% CI) | % (95% CI) | % (95% CI) | % (95% CI) | ||
| Overall | 17.4 (16.4–18.3) | 14.8 (13.8–15.9) | 12.7 (11.8–13.6) | 10.9 (10.0–12.0) | −6.5 |
| Race/Ethnicity | |||||
| NH White | 18.3 (17.2–19.4) | 15.0 (13.9–16.2) | 13.4 (12.4–14.5) | 11.2 (10.0–12.4) | −7.1 |
| NH Black | 14.7 (12.0–17.8) | 15.2 (12.7–18.1) | 10.0 (8.0–12.4) | 10.3 (8.0–13.2) | −4.4 |
| Hispanic | 9.8 (7.5–12.5) | 11.2 (8.2–15.0) | 8.6 (6.4–11.5) | 8.9 (6.5–12.0) | −0.9** |
| NH Asian | 15.8 (8.2–28.4) | 11.3 (7.3–17.1) | 14.8 (8.3–25.2) | 12.2 (9.1–16.2) | −3.6** |
| Education | |||||
| >High School | 21.0 (19.4–22.6) | 16.9 (15.4–18.5) | 14.9 (13.6–16.4) | 12.7 (11.1–14.5) | −8.3 |
| High School Graduate | 16.2 (14.7–17.9) | 14.2 (12.6–15.9) | 11.7 (10.5–13.1) | 9.7 (8.2–11.5) | −6.5 |
| <High School | 11.6 (10.1–13.4) | 10.8 (9.1–12.8) | 9.7 (8.0–11.9) | 7.5 (6.0–9.3) | −4.1 |
| Time in the U.S. | |||||
| Born in U.S. | 18.0 (17.0–19.1) | 15.4 (14.3–16.5) | 13.1 (12.1–14.2) | 11.1 (10.0–12.3) | −6.9 |
| Immigrant, in U.S. 10+ Years | 13.9 (11.0–17.3) | 11.1 (8.7–14.0) | 10.4 (8.1–13.4) | 10.3 (8.0–13.1) | −3.6** |
| Immigrant, in U.S. <10 Years | 1.1 (0.2–5.2) | 5.8 (2.7–12.1) | 2.9 (1.1–7.4) | 4.8 (1.7–12.7) | +3.7** |
| Family Income (% FPL) | |||||
| 500%+ | 22.4 (20.0–25.1) | 18.5 (16.0–21.2) | 14.9 (13.0–17.0) | 14.0 (11.0–17.6) | −8.4 |
| 400% –<500% | 18.5 (14.7–23.0) | 15.2 (12.4–18.4) | 10.7 (8.1–14.1) | 9.9 (6.9–14.0) | −8.6 |
| 300% –<400% | 16.9 (14.0–20.2) | 15.8 (13.1–19.1) | 13.8 (11.2–17.0) | 10.8 (8.5–13.6) | −6.1 |
| 200% –<300% | 17.1 (14.7–19.7) | 12.9 (10.7–15.6) | 14.0 (11.5–16.9) | 9.9 (7.7–12.7) | −7.2 |
| 200% –<<200% | 12.8 (11.2–14.6) | 11.3 (9.7–13.0) | 10.2 (8.7–11.9) | 9.1 (7.7–10.9) | −3.6 |
| Health Insurance—Ages 50–64 | |||||
| Private non-HMO | 17.0 (15.5–18.6) | 14.4 (12.9–16.0) | 10.9 (9.7–12.3) | 9.1 (7.8–10.5) | −7.9 |
| Private HMO | 16.0 (14.1–18.0) | 14.7 (12.7–17.0) | 13.4 (11.6–15.3) | 11.6 (9.5–14.1) | −4.4 |
| Public | 13.8 (10.9–17.2) | 15.9 (13.2–19.0) | 14.0 (11.5–16.9) | 10.8 (8.7–13.4) | −3.0** |
| Uninsured | 7.0 (5.2–9.5) | 4.7 (3.5–6.4) | 4.0 (2.9–5.5) | 5.3 (3.4–8.0) | −1.7** |
| Health Insurance—Ages 65–75 | |||||
| Medicare + Private | 21.1 (18.7–23.7) | 16.8 (14.4–19.6) | 15.6 (13.3–18.1) | 15.7 (12.4–19.7) | −5.4 |
| Medicare HMO | 29.6 (24.6–35.2) | 22.7 (16.8–29.8) | 17.5 (12.3–24.4) | 15.9 (10.7–22.8) | −13.6 |
| Medicare, no Supplemental | 13.3 (10.0–17.7) | 15.4 (11.6–20.1) | 14.5 (11.1–18.8) | 8.2 (5.4–12.1) | −5.1 |
| Medicaid, Military, Other Government | 11.3 (6.7–18.3) | 15.4 (12.2–19.2) | 15.8 (11.3–21.6) | 11.4 (7.7–16.6) | +0.1** |
| Uninsured or Medicare Part A only | 28.1 (15.9–44.7) | 6.6 (2.9–14.5) | 4.2 (1.5–11.3) | 12.9 (5.8–26.4) | −15.2** |
| Has Usual Source of Care | |||||
| Yes (excluding E.R.) | 18.3 (17.3–19.3) | 15.6 (14.6–16.7) | 13.4 (12.5–14.3) | 11.5 (10.5–12.6) | −6.8 |
| No | 5.8 (3.7–9.1) | 3.5 (2.2–5.6) | 4.5 (2.2–9.0) | 2.6 (1.4–4.6) | −3.2** |
| # Physician Visits in Past Year | |||||
| Two or more | 20.1 (19.0–21.3) | 17.3 (16.1–18.5) | 14.8 (13.8–15.9) | 12.2 (11.1–13.5) | −7.9 |
| One | 15.9 (13.4–18.7) | 11.6 (9.5–14.1) | 8.9 (7.2–10.9) | 9.9 (7.7–12.7) | −6.0 |
| None | 2.2 (1.4–3.4) | 2.0 (1.3–3.3) | 2.7 (1.6–4.5) | 2.1 (1.3–3.4) | −0.1** |
Overall trend and subgroup trends are statistically significant at α = 0.05, unless otherwise noted.
Trend for this subgroup is not statistically significant at α = 0.05.
Trends in Sigmoidoscopy Use
Similar trends were observed for sigmoidoscopy (Table 3). The proportion of U.S. adults aged 50–75 who reported having a sigmoidoscopy in the past five years declined by seven percentage points during 2000–2008, to 2.4%. Statistically significant declines ranging from 1.9 to 10.9 percentage points occurred for all population subgroups, with the exception of non-Hispanic Asians, immigrants who had been in the U.S. less than 10 years, the uninsured, and people without a usual source of health care.
Table 3.
Reported Sigmoidoscopy in the past 5 Years, U.S. Adults aged 50–75, National Health Interview Survey 2000–2008*
| 2000 | 2003 | 2005 | 2008 | Percentage point change, 2000–2008 |
|
|---|---|---|---|---|---|
| % (95% CI) | % (95% CI) | % (95% CI) | % (95% CI) | ||
| Overall | 9.4 (8.7–10.2) | 6.6 (5.9–7.4) | 4.1 (3.6–4.7) | 2.4 (1.9–3.0) | −7.0 |
| Race/Ethnicity | |||||
| NH White | 10.1 (9.3–11.0) | 7.1 (6.3–8.0) | 4.3 (3.7–5.0) | 2.4 (1.8–3.1) | −7.7 |
| NH Black | 5.7 (4.3–7.5) | 5.7 (4.0–8.0) | 3.3 (2.1–5.1) | 1.4 (0.8 –2.5) | −4.3 |
| Hispanic | 5.5 (4.1–7.3) | 3.6 (2.4–5.5) | 2.73 (1.8–4.2) | 2.9 (1.5–5.3) | −2.6 |
| NH Asian | 8.7 (3.9–18.4) | 6.8 (3.2–13.7) | 3.3 (1.5–7.0) | 3.1 (1.6–6.1) | −5.6** |
| Education | |||||
| >High School | 12.4 (11.0–13.9) | 9.1 (8.0–10.3) | 5.5 (4.6–6.6) | 2.8 (2.2–3.7) | −9.6 |
| High School Graduate | 8.5 (7.2–10.0) | 5.7 (4.4–7.3) | 2.5 (1.9–3.3) | 1.7 (1.2–2.6) | −6.8 |
| <High School | 4.8 (3.8–6.1) | 2.2 (1.6–3.1) | 3.6 (2.6–4.9) | 1.7 (0.7–4.1) | −3.1 |
| Time in the U.S. | |||||
| Born in U.S. | 9.9 (9.1–10.7) | 7.1 (6.3–7.9) | 4.3 (3.7–4.9) | 2.5 (1.9–3.2) | −7.4 |
| Immigrant, in U.S. 10+ Years | 6.2 (4.2–8.9) | 3.4 (2.4–4.9) | 3.0 (2.1–4.3) | 1.8 (0.9–3.4) | −4.4 |
| Immigrant, in U.S. <10 Years | 1.2 (0.3–5.6) | 1.4 (0.4–5.4) | 1.9 (0.4–8.6) | 0.0 (0.0–0.0) | −1.2** |
| Family Income (% FPL) | |||||
| 500%+ | 14.5 (12.2–17.2) | 10.4 (8.5–12.7) | 6.2 (5.0–7.8) | 3.6 (2.5–5.2) | −10.9 |
| 400% –<500% | 8.5 (6.5–11.0) | 6.1 (4.3–8.7) | 3.7 (1.9–7.0) | 3.2 (1.7–5.8) | −5.3 |
| 300% –<400% | 9.5 (7.14–12.6) | 6.6 (4.8–9.1) | 3.6 (2.4–5.4) | 1.6 (0.8–3.2) | −7.9 |
| 200% –<300% | 7.9 (6.3–9.8) | 4.9 (3.6–6.7) | 2.9 (1.9–4.4) | 1.5 (0.4–5.3) | −6.4 |
| <200% | 5.8 (4.7–7.0) | 3.7 (2.7–5.0) | 2.9 (2.1–3.8) | 1.6 (0.7–3.5) | −4.2 |
| Health Insurance—Ages 50–64 | |||||
| Private non-HMO | 9.4 (8.2–10.7) | 6.9 (5.9–7.9) | 3.3 (2.7–4.0) | 2.0 (1.4–2.8) | −7.4 |
| Private HMO | 9.8 (8.3–11.4) | 7.4 (6.0–9.1) | 6.9 (5.5–8.7) | 3.5 (2.4–5.2) | −6.3 |
| Public | 4.8 (3.1–7.4) | 3.8 (2.6–5.6) | 3.0 (1.9–4.7) | 1.4 (0.7–3.0) | −3.4 |
| Uninsured | 2.2 (1.3–3.8) | 1.7 (1.0–3.0) | 1.2 (0.5–3.0) | 1.5 (0.6–3.6) | −0.7** |
| Health Insurance—Ages 65–75 | |||||
| Medicare + Private | 12.6 (10.4–15.2) | 7.6 (5.9–9.9) | 5.0 (3.5–7.1) | 2.0 (1.1–3.9) | −10.6 |
| Medicare HMO | 10.5 (7.9–13.7) | 15.7 (11.0–21.8) | 4.6 (3.1–6.8) | 5.1 (2.6–9.7) | −5.4 |
| Medicare, no Supplemental | 8.4 (5.4–13.0) | 3.6 (1.8–7.0) | 2.8 (1.3–5.7) | 3.7 (1.4–9.5) | −4.7 |
| Medicaid, Military, Other Government | 9.1 (4.9–16.5) | 5.2 (3.4–7.8) | 5.9 (3.6–9.5) | 2.6 (1.0–6.7) | −6.5 |
| Uninsured or Medicare Part A only | 8.7 (4.5–16.2) | 20.1 (7.6–43.5) | 2.4 (0.6–8.9) | 0.9 (0.1–6.3) | −7.8** |
| Has Usual Source of Care | |||||
| Yes (excluding E.R.) | 10.0 (9.2–10.8) | 7.0 (6.3–7.8) | 4.4 (3.8–5.0) | 2.4 (2.0–3.1) | −7.6 |
| No | 2.4 (1.4–4.3) | 1.3 (0.6–2.6) | 0.8 (0.4–1.7) | 1.1 (0.4–3.0) | −1.3** |
| # Physician Visits in Past Year | |||||
| Two or more | 10.5 (9.6–11.4) | 7.4 (6.6–8.3) | 4.6 (4.0–5.4) | 2.4 (1.8–3.1) | −8.1 |
| One | 8.6 (6.8–10.9) | 5.0 (3.7–6.6) | 3.5 (2.5–5.0) | 3.1 (1.9–4.9) | −5.6 |
| None | 3.3 (2.3–4.7) | 2.7 (1.8–4.0) | 1.1 (0.6–1.9) | 1.4 (0.8–2.5) | −1.9 |
Overall trend and subgroup trends are statistically significant at α = 0.05, unless otherwise noted.
Trend for this subgroup is not statistically significant at α = 0.05.
Trends in Colonoscopy Use
In contrast to the trends for home FOBT and sigmoidoscopy, use of colonoscopy increased markedly among U.S. adults aged 50–75: in 2000, 19.0% reported having a colonoscopy in the past 10 years, while in 2008, 47.5% indicated that they had undergone this procedure (Table 4). Statistically significant increases in colonoscopy use over the period 2000–2008 were seen for all population subgroups, with one exception: people aged 65–75 who were uninsured or reported having only Medicare Part A coverage. The sample size for this group, however, was small (n<90).
Table 4.
Reported Colonoscopy in the past 10 Years, U.S. Adults aged 50–75, National Health Interview Survey 2000–2008*
| 2000 | 2003 | 2005 | 2008 | Percentage point change, 2000–2008 |
|
|---|---|---|---|---|---|
| % (95% CI) | % (95% CI) | % (95% CI) | % (95% CI) | ||
| Overall | 19.0 (18.0–20.1) | 29.9 (28.6–31.2) | 39.4 (38.0–40.9) | 47.5 (45.9–49.0) | +28.5 |
| Race/Ethnicity | |||||
| NH White | 19.8 (18.6–21.0) | 31.3 (29.9–32.8) | 42.3 (40.7–43.9) | 50.0 (48.2–51.9) | +30.2 |
| NH Black | 18.3 (15.3–21.7) | 24.7 (21.7–27.9) | 30.3 (27.2–33.5) | 45.4 (41.0–49.9) | +27.1 |
| Hispanic | 13.9 (11.0–17.5) | 21.3 (17.5–25.7) | 25.3 (20.4–30.8) | 31.7 (27.4–36.3) | +17.8 |
| NH Asian | 12.5 (6.9–21.5) | 23.3 (16.1–32.3) | 25.3 (17.4–35.3) | 41.7 (34.8–48.9) | +29.2 |
| Education | |||||
| >High School | 22.4 (20.7–24.2) | 34.6 (32.7–36.6) | 44.5 (42.7–46.4) | 54.4 (52.1–56.8) | +32.0 |
| High School Graduate | 18.7 (16.9–20.6) | 29.5 (27.4–31.7) | 37.7 (35.3–40.2) | 44.1 (41.4–46.8) | +25.4 |
| <High School | 12.9 (11.2–14.7) | 19.6 (17.4–22.1) | 27.7 (25.1–30.6) | 31.3 (28.2–34.6) | +18.4 |
| Time in the U.S. | |||||
| Born in U.S. | 19.6 (18.5–20.8) | 30.5 (29.1–31.9) | 40.7 (39.2–42.3) | 49.2 (47.5–50.9) | +29.6 |
| Immigrant, in U.S. 10+ Years | 15.4 (12.8–18.5) | 26.9 (23.2–31.0) | 31.1 (27.1–35.4) | 36.8 (32.6–41.1) | +21.4 |
| Immigrant, in U.S. <10 Years | 8.0 (4.7–13.2) | 9.2 (4.6–17.7) | 12.0 (6.6–20.9) | 19.1 (11.9–29.2) | +11.1 |
| Family Income (% FPL) | |||||
| 500%+ | 23.0 (20.4–25.8) | 37.4 (34.4 40.5) | 47.0 (44.1–50.0) | 57.8 (54.2–61.3) | +34.8 |
| 400% –<500% | 20.2 (15.7–25.6) | 31.1 (26.2–36.5) | 45.7 (39.6–51.8) | 52.2 (46.8–57.5) | +32.0 |
| 300% –<400% | 18.1 (15.0–21.6) | 31.7 (28.3–35.3) | 40.0 (36.1–44.1) | 46.0 (42.3–49.9) | +27.9 |
| 200% –<300% | 17.5 (14.8–20.6) | 27.5 (24.6–30.5) | 36.5 (33.2–40.0) | 44.2 (39.3–49.2) | +26.7 |
| <200% | 15.8 (14.0–17.8) | 22.0 (20.0–24.2) | 28.8 (26.6–31.2) | 33.9 (31.1–36.8) | +18.1 |
| Health Insurance—Ages 50–64 | |||||
| Private non-HMO | 17.4 (16.0–19.0) | 28.2 (26.4–30.3) | 36.7 (34.8–38.5) | 49.2 (46.9–51.5) | +31.8 |
| Private HMO | 16.9 (14.9–19.2) | 29.0 (26.4–31.7) | 36.2 (33.4–39.1) | 47.5 (43.8–51.3) | +30.6 |
| Public | 17.2 (14.2–20.7) | 24.3 (21.1–27.9) | 32.1 (29.0–35.3) | 39.0 (35.4–42.7) | +21.8 |
| Uninsured | 7.2 (5.4–9.5) | 11.2 (8.8–14.1) | 13.2 (10.9–15.9) | 14.9 (11.7–18.9) | +7.7 |
| Health Insurance—Ages 65–75 | |||||
| Medicare + Private | 27.8 (25.0–30.9) | 40.0 (36.6–43.6) | 53.8 (49.9–57.6) | 59.4 (55.0–63.6) | +31.6 |
| Medicare HMO | 23.6 (18.9–29.1) | 35.0 (28.2–42.4) | 43.7 (35.9–51.9) | 50.7 (43.2–57.7) | +27.1 |
| Medicare, no Supplemental | 13.8 (10.1–18.4) | 26.8 (21.3–33.1) | 45.0 (39.8–50.3) | 45.8 (39.4–52.4) | +32.0 |
| Medicaid, Military, Other Government | 13.3 (9.7–18.0) | 34.3 (27.0–42.4) | 45.5 (37.6–53.6) | 49.6 (42.1–57.1) | +36.3 |
| Uninsured or Medicare Part A only | 13.7 (6.5–26.7) | 11.9 (6.4–21.1) | 34.9 (29.9–40.3) | 42.6 (29.7–56.7) | +28.9** |
| Has Usual Source of Care | |||||
| Yes (excluding E.R.) | 19.9 (18.8–21.0) | 31.2 (29.9–32.5) | 41.1 (39.7–42.6) | 50.0 (48.3–51.6) | +30.1 |
| No | 7.6 (5.4–10.5) | 12.1 (7.7–18.4) | 18.7 (14.4–24.0) | 14.3 (11.4–17.8) | +6.7 |
| # Physician Visits in Past Year | |||||
| Two or more | 22.3 (21.0–23.6) | 34.3 (32.8–35.9) | 44.4 (42.8–46.0) | 54.2 (52.5–55.9) | +31.9 |
| One | 11.6 (9.5–14.1) | 20.6 (17.1–24.5) | 31.9 (27.9–36.1) | 34.7 (31.2–38.3) | +23.1 |
| None | 5.8 (4.4–7.6) | 12.2 (8.5–17.3) | 15.4 (12.3–19.0) | 15.8 (12.3–20.2) | +10.0 |
Overall trend and subgroup trends are statistically significant at α = 0.05, unless otherwise noted.
Trend for this subgroup is not statistically significant at α = 0.05.
Although colonoscopy use increased significantly among nearly all population subgroups, there were differences in use rates (Table 4). The percentages of Hispanics reporting colonoscopy use were consistently lower than those of non-Hispanic whites, and the percentage point increase in use among Hispanics was less than that of non-Hispanic whites. Similar patterns were observed for people with less than a high school education (vs. those with more than a high school education); recent immigrants (vs. individuals born in the U.S.); people with family income <200% of FPL (vs. those with family income ≥500% of FPL); the uninsured (vs. people with health insurance coverage); those with no usual source of care (vs. individuals who reported having a usual source of care); and people who had no physician visits in the past year (vs. those with two or more visits).
Trends in being Up-to-Date with CRC Screening
The proportion of the U.S. population aged 50–75 that is up-to-date with CRC screening increased by nearly 16 percentage points over the period 2000–2008 (Table 5). In 2000, 38.6% were up-to-date; by 2008, nearly 55% reported being up-to-date. Statistically significant increases in the proportion up-to-date ranging from 1.8 to 28.3 percentage points occurred for all population subgroups, with the exception of people aged 65–75 who were uninsured or reported having only Medicare Part A coverage.
Table 5.
Up-to-Date1 with Colorectal Cancer Screening, U.S. Adults aged 50–75, National Health Interview Survey 2000–2008*
| 2000 | 2003 | 2005 | 2008 | Percentage point change, 2000–2008 |
|
|---|---|---|---|---|---|
| % (95% CI) | % (95% CI) | % (95% CI) | % (95% CI) | ||
| Overall | 38.6 (37.4–39.9) | 43.3 (41.9–44.7) | 48.6 (47.2–50.1) | 54.5 (52.9–56.2) | +15.9 |
| Race/Ethnicity | |||||
| NH White | 40.5 (39.1–41.8) | 45.3 (43.7–46.8) | 51.7 (50.0–53.3) | 57.0 (55.1–58.9) | +16.5 |
| NH Black | 33.0 (29.6–36.7) | 37.7 (34.0–41.6) | 38.7 (35.3–42.3) | 51.4 (47.1–55.6) | +18.4 |
| Hispanic | 26.4 (22.4–30.9) | 30.3 (25.9–35.0) | 32.4 (27.5–37.9) | 39.1 (34.8–43.6) | +12.7 |
| NH Asian | 32.2 (25.8–39.3) | 33.6 (25.6–42.5) | 40.7 (34.4–47.4) | 50.8 (43.2–58.4) | +18.6 |
| Education | |||||
| >High School | 45.3 (43.4–47.3) | 50.2 (48.3–52.1) | 55.3 (53.5–57.1) | 62.0 (60.0–64.0) | +16.7 |
| High School Graduate | 37.4 (35.1–39.8) | 42.2 (39.9–44.4) | 45.8 (43.4–48.2) | 50.5 (47.7–53.2) | +13.1 |
| <High School | 26.0 (24.0–28.2) | 28.4 (25.8–31.2) | 35.3 (32.3–38.5) | 37.5 (34.1–41.0) | +11.5 |
| Time in the U.S. | |||||
| Born in U.S. | 39.9 (38.5–41.2) | 44.5 (43.1–46.0) | 50.2 (48.6–51.8) | 56.5 (54.7–58.3) | +16.6 |
| Immigrant, in U.S. 10+ Years | 32.0 (28.2–35.9) | 35.5 (31.6–39.6) | 39.2 (35.3–43.3) | 42.4 (38.5–46.7) | +10.4 |
| Immigrant, in U.S. <10 Years | 10.0 (6.1–15.9) | 16.0 (10.0–24.7) | 16.6 (10.2–26.0) | 25.7 (17.2–36.6) | +15.7 |
| Family Income (% FPL) | |||||
| 500%+ | 49.1 (45.8–52.4) | 55.1 (52.5–57.6) | 58.3 (55.4–61.1) | 66.0 (63.2–68.8) | +16.9 |
| 400% –<500% | 39.8 (34.7–45.2) | 43.1 (38.4–48.0) | 53.7 (47.9–59.5) | 60.3 (55.1–65.3) | +20.5 |
| 300% –<400% | 37.5 (33.9–41.3) | 45.7 (42.1–49.4) | 48.5 (44.9–52.1) | 53.0 (49.0–56.8) | +15.5 |
| 200% –<300% | 36.2 (32.8–39.8) | 38.3 (35.3–41.4) | 45.5 (41.7–49.2) | 50.9 (47.0–54.9) | +14.7 |
| <200% | 29.8 (27.6–32.1) | 32.3 (30.0–34.6) | 37.1 (34.7–39.5) | 40.1 (37.2–43.1) | +10.3 |
| Health Insurance—Ages 50–64 | |||||
| Private non-HMO | 36.9 (34.9–38.9) | 41.8 (39.5–44.0) | 45.2 (43.3–47.2) | 55.2 (52.8–57.5) | +18.3 |
| Private HMO | 36.5 (34.1–39.1) | 43.1 (40.2–46.0) | 48.5 (45.5–51.5) | 55.9 (52.1–59.7) | +19.4 |
| Public | 30.7 (26.8–34.8) | 37.3 (33.5–41.2) | 42.1 (38.6–45.7) | 45.3 (41.4–49.2) | +14.6 |
| Uninsured | 14.7 (12.0–17.8) | 16.2 (13.5–19.3) | 17.2 (14.6–20.2) | 19.9 (16.1–24.3) | +5.2 |
| Health Insurance—Ages 65–75 | |||||
| Medicare + Private | 51.4 (48.1–54.7) | 54.6 (50.9–58.1) | 64.0 (60.2–67.6) | 67.5 (63.3–71.4) | +16.1 |
| Medicare HMO | 51.8 (45.6–57.9) | 57.3 (49.5–64.7) | 52.6 (44.8–60.4) | 62.9 (54.8–70.3) | +11.1 |
| Medicare, no Supplemental | 31.9 (26.1–38.3) | 36.9 (30.8–43.4) | 52.3 (47.0–57.6) | 52.9 (46.7–59.0) | +21.0 |
| Medicaid, Military, Other Government | 28.5 (22.2–35.9) | 49.0 (41.6–56.4) | 56.8 (48.3–64.9) | 56.8 (48.9–64.3) | +28.3 |
| Uninsured or Medicare Part A only | 41.3 (27.8–56.2) | 36.3 (19.6–57.2) | 39.3 (33.1–45.9) | 51.3 (36.4–66.0) | +10.0** |
| Has Usual Source of Care | |||||
| Yes (excluding E.R.) | 40.5 (39.2–41.8) | 45.4 (44.0–46.8) | 50.8 (49.3–52.3) | 57.4 (55.7–59.0) | +16.9 |
| No | 14.5 (11.4–18.2) | 14.9 (10.3–21.2) | 21.7 (17.2–27.0) | 16.3 (13.1–20.1) | +1.8 |
| # Physician Visits in Past Year | |||||
| Two or more | 44.6 (43.1–46.1) | 49.5 (47.9–51.2) | 54.8 (53.1–56.4) | 61.7 (59.9–63.4) | +17.1 |
| One | 29.2 (26.2–32.3) | 31.4 (27.6–35.6) | 40.1 (36.0–44.4) | 43.3 (39.4–47.3) | +14.1 |
| None | 10.6 (8.7–12.8) | 15.9 (11.9–21.0) | 17.9 (14.7–21.6) | 18.1 (14.5–22.4) | +7.5 |
Up-to-date is defined as having had a home FOBT in the past year, sigmoidoscopy in the past 5 years, and/or colonoscopy in the past 10 years
Overall trend and subgroup trends are statistically significant at α = 0.05, unless otherwise noted.
Trend for this subgroup is not statistically significant at α = 0.05.
While the percentages of people up-to-date with CRC screening increased significantly among nearly all population subgroups, there were subgroup differences (Table 5). The percentages of up-to-date Hispanics were consistently lower than those of non-Hispanic whites, and the percentage point increase in being up-to-date was lower for Hispanics than non-Hispanic whites. Similar patterns were evident for people with less than a high school education (vs. those with more than a high school education); people with family income <200% of FPL (vs. those with family income ≥500% of FPL); individuals aged 50–64 who are uninsured (vs. people with health insurance coverage); those with no usual source of care (vs. individuals who reported having a usual source of care); and people who had no physician visits in the past year (vs. those with one or more visits). The percentages of recent immigrants who were up-to-date were consistently lower than those of individuals born in the U.S., as were the percentages of individuals aged 65–75 who have Medicare but no supplemental coverage compared with those covered by Medicare plus private supplemental insurance.
Among those up-to-date with CRC screening, there were few subgroup differences in the type of test they reported using (Figure 1). In 2000 and in 2008, no significant differences were evident in the percentages of non-Hispanic whites, non-Hispanic blacks, Hispanics, and Asians who were up-to-date by FOBT, sigmoidoscopy, or colonoscopy (Figure 1, Panel A). By education subgroup, there were no significant differences in the percentages up-to-date by FOBT, sigmoidoscopy, or colonoscopy in 2000, although in 2008, people with less than a high school education were more likely than those having more education to be up-to-date by FOBT only (Panel B). For those aged 50–64, there were no significant differences in either year in the percentages up-to-date by FOBT, sigmoidoscopy, or colonoscopy by type of health care coverage (Panel C). Likewise, in 2000 and in 2008, there were no significant differences in the percentages of people with or without a usual source of health care who were up-to-date by FOBT, sigmoidoscopy, or colonoscopy (Panel D). Among those up-to-date, for all population subgroups, the most notable trend was the substantial increase in colonoscopy use.
Figure 1.
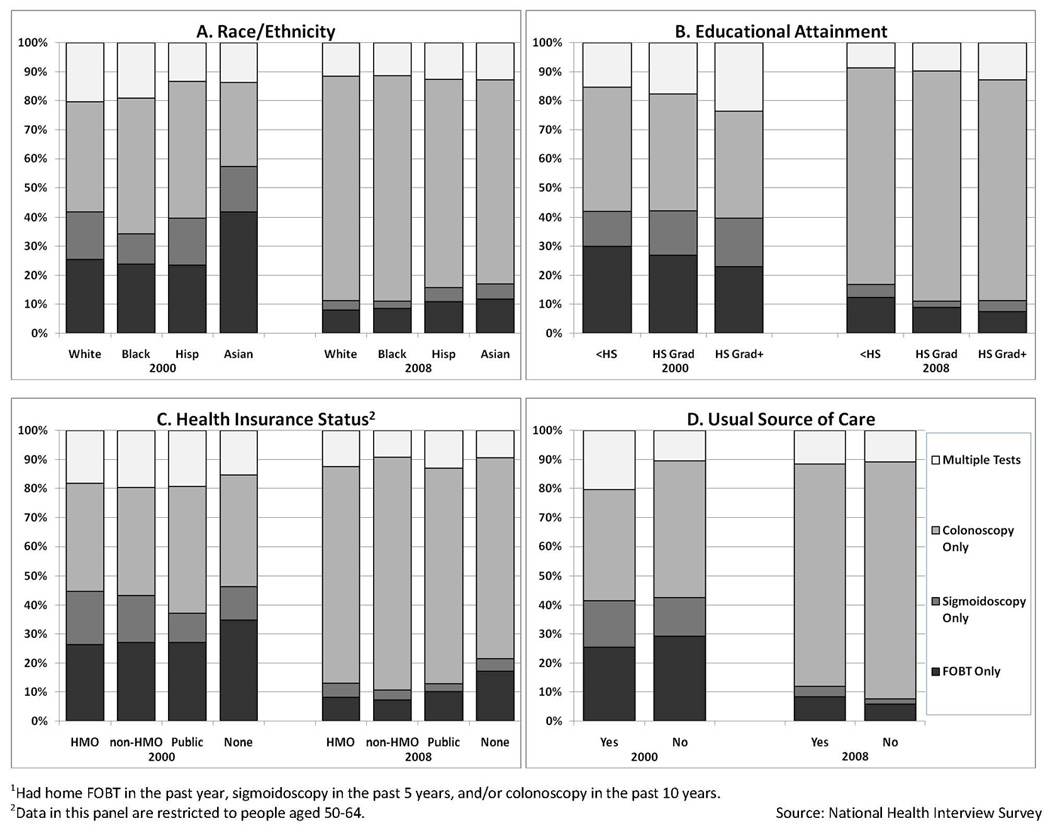
Type of Colorectal Cancer Test used by U.S. Adults 50–75 who met Colorectal Cancer Screening Guidelines1
1Had home FOBT in the past year, sigmoidoscopy in the past 5 years, and/or colonoscopy in the past 10 years.
2Data in this panel are restricted to people aged 50–64.
DISCUSSION
This analysis of nationally-representative data for adults aged 50–75, the age group targeted by the USPSTF as benefitting the most from CRC screening (4), showed that the proportion up-to-date with CRC screening recommendations increased from 39% in 2000 to 55% in 2008. Moreover, most CRC screening in the U.S. during 2000–2008 was undertaken with colonoscopy, while use of FOBT and sigmoidoscopy declined. Despite the 16 percentage point increase in the proportion of U.S. adults up-to-date with CRC screening, though, it is important to note that in 2008, 45% of the population aged 50–75—or nearly 35 million people—were not current with screening as recommended by the USPSTF.
A key aim of our study was to examine recent national trends in CRC test use among seven population groups that historically have had lower rates of cancer screening: Hispanics; people with low income or low educational attainment; recent immigrants; and those without health insurance, a usual source of health care, or recent physician contact. Over the period 2000–2008, we observed statistically significant increases in the proportions of people in these vulnerable populations who were up-to-date with CRC screening. The one exception was individuals aged 65–75 who were uninsured or reported having only Medicare Part A coverage. However, because of small sample sizes for this group, we may have lacked sufficient statistical power to detect a significant increase.
Nevertheless, it is important to highlight that there are still disparities in CRC screening rates. Among the seven vulnerable populations examined in our analysis, all showed lower rates of colonoscopy use as well as in being up-to-date with CRC screening, compared with more advantaged populations. For example, in 2008, 39% of Hispanics were up-to-date with CRC screening, compared with 57% of non-Hispanic whites; 32% of Hispanics reported having colonoscopy in the past 10 years, compared with 50% of non-Hispanic whites. Other groups with CRC screening rates lower than 40% in 2008 included people with less than a high school education (38% up-to-date), immigrants who had been in the U.S. less than 10 years (26% up-to-date), the uninsured (20% up-to-date), people with no physician visits in the past year (18% up-to-date), and those with no usual source of care (16% up-to-date).
Our analysis further revealed that, even among vulnerable subgroups, most CRC screening during 2000–2008 was undertaken with colonoscopy, while FOBT and sigmoidoscopy use declined. Although concerns have been raised that individuals from vulnerable populations might not have access to colonoscopy equivalent to that of more advantaged individuals (26), we found no significant subgroup differences in test use patterns among individuals who were up-to-date with CRC screening. In other words, in 2008, colonoscopy use predominated among all groups, including racial/ethnic minorities, people with low educational attainment, the uninsured, and those lacking a usual source of care.
Our study has limitations. Data are self-reported; validation studies have shown that adults may over-report screening behaviors in surveys (27). Institutionalized and noncivilian populations are not captured in the NHIS. American Indian, Alaska Native, and Pacific Islander samples were too small to analyze separately and therefore were excluded from the study.
Despite its limitations, our study provides important national benchmark data for monitoring progress toward improved delivery of CRC screening, particularly following the 2010 National Institutes of Health State of the Science Conference on Enhancing Use and Quality of CRC Screening (5, 28)—which outlined research and public health agendas for addressing underuse, overuse, and misuse of CRC screening—as well as implementation of national health care reform legislation, which includes provisions for reducing or removing barriers to preventive services, including CRC screening (29). Demonstration of improved rates of CRC screening among historically underserved groups will be a critical marker of success for public health efforts that target CRC screening. As our study documents, although CRC screening rates in the U.S. increased during 2000–2008, considerable improvement among all population groups is still needed.
ACKNOWLEDGEMENTS
The findings and conclusions in this report are those of the authors and do not necessarily represent the official position of the National Cancer Institute or the Centers for Disease Control and Prevention. This study was presented in part at the NIH State of the Science Conference: Enhancing Use and Quality of Colorectal Cancer Screening in Bethesda, MD, on February 2, 2010.
REFERENCES
- 1.Byers T, Levin B, Rothenberger D, et al. American Cancer Society guidelines for screening and surveillance for early detection of colorectal polyps and cancer: update 1997. American Cancer Society Detection and Treatment Advisory Group on Colorectal Cancer. CA Cancer J Clin. 1997;47:154–160. doi: 10.3322/canjclin.47.3.154. [DOI] [PubMed] [Google Scholar]
- 2.DiGuiseppi C, Atkins D, Woolf SH, editors. U.S. Preventive Services Task Force. Guide to clinical preventive services. Second edition. Baltimore, MD: Williams & Wilkins; 1996. [Google Scholar]
- 3.Winawer SJ, Fletcher RH, Miller L, et al. Colorectal cancer screening: clinical guidelines and rationale. Gastroenterology. 1997;112:594–642. doi: 10.1053/gast.1997.v112.agast970594. [DOI] [PubMed] [Google Scholar]
- 4.U.S. Preventive Services Task Force. Screening for colorectal cancer: U.S. Preventive Services Task Force Recommendation Statement. Ann Intern Med. 2008;149:627–637. doi: 10.7326/0003-4819-149-9-200811040-00243. [DOI] [PubMed] [Google Scholar]
- 5.Steinwachs D, Allen JD, Barlow WE, Duncan RP, Egede LE, Friedman LS, et al. National Institutes of Health State-of-the-Science Conference Statement: Enhancing Use and Quality of Colorectal Cancer Screening. Ann Intern Med. 2010;152:663–667. doi: 10.7326/0003-4819-152-10-201005180-00237. [DOI] [PubMed] [Google Scholar]
- 6.Swan J, Breen N, Graubard BI, McNeel TS, Blackman D, Tangka FK, et al. Data and trends in cancer screening in the United States. Cancer. 2010;116:4872–4881. doi: 10.1002/cncr.25215. [DOI] [PMC free article] [PubMed] [Google Scholar]
- 7.Centers for Disease Control and Prevention. Vital signs: colorectal cancer screening among adults aged 50–75 years—United States, 2008. MMWR. 2010;59:808–812. [PubMed] [Google Scholar]
- 8.Shapiro JA, Seeff LC, Thompson TD, Nadel MR, Klabunde CN, Vernon SW. Colorectal cancer test use from the 2005 National Health Interview Survey. Cancer Epidemiol Biomarkers Prev. 2008;17:1623–1630. doi: 10.1158/1055-9965.EPI-07-2838. [DOI] [PubMed] [Google Scholar]
- 9.Seeff LC, Nadel MR, Klabunde CN, Thompson T, Shapiro JA, Vernon SW, et al. Patterns and predictors of colorectal cancer test use in the adult U.S. population. Cancer. 2004;100:2093–2103. doi: 10.1002/cncr.20276. [DOI] [PubMed] [Google Scholar]
- 10.Swan J, Breen N, Coates RJ, Rimer BK, Lee NC. Progress in cancer screening practices in the United States: results from the 2000 National Health Interview Survey. Cancer. 2003;97:1528–1540. doi: 10.1002/cncr.11208. [DOI] [PubMed] [Google Scholar]
- 11.Institute of Medicine. Washington, D.C.: National Academy Press; 2001. Crossing the quality chasm: a new health system for the 21st century. [PubMed] [Google Scholar]
- 12.Doubeni CA, Laiyemo AO, Young AC, Klabunde CN, Reed G, Field TS, et al. Primary care, economic barriers to health care, and use of colorectal cancer screening tests among Medicare enrollees over time. Ann Fam Med. 2010;8:299–307. doi: 10.1370/afm.1112. [DOI] [PMC free article] [PubMed] [Google Scholar]
- 13.Doubeni CA, Laiyemo AO, Reed G, Field TS, Fletcher RH. Socioeconomic and racial patterns of colorectal cancer screening among Medicare enrollees in 2000 to 2005. Cancer Epidemiol Biomarkers Prev. 2009;18:2170–2175. doi: 10.1158/1055-9965.EPI-09-0104. [DOI] [PMC free article] [PubMed] [Google Scholar]
- 14.Schenck AP, Peacock SC, Klabunde CN, Lapin P, Coan JF, Brown ML. Trends in colorectal cancer test use in the Medicare population, 1998–2005. Am J Prev Med. 2009;37:1–7. doi: 10.1016/j.amepre.2009.03.009. [DOI] [PubMed] [Google Scholar]
- 15.Chen X, White MC, Peipins LA, Seeff LC. Increase in screening for colorectal cancer in older Americans: results from a national survey. J Am Geriatr Soc. 2008;56:1511–1516. doi: 10.1111/j.1532-5415.2008.01796.x. [DOI] [PubMed] [Google Scholar]
- 16.Nadel MR, Blackman DK, Shapiro JA, Seeff LC. Are people being screened for colorectal cancer as recommended? Results from the National Health Interview Survey. Prev Med. 2002;35:199–206. doi: 10.1006/pmed.2002.1070. [DOI] [PubMed] [Google Scholar]
- 17.Fenton JJ, Cai Y, Green P, Beckett LA, Franks P, Baldwin LM. Trends in colorectal cancer testing among Medicare subpopulations. Am J Prev Med. 2008;35:194–202. doi: 10.1016/j.amepre.2008.05.029. [DOI] [PubMed] [Google Scholar]
- 18.Phillips KA, Liang SY, Ladabaum U, Haas J, Kerlikowske K, Lieberman D, et al. Trends in colonoscopy for colorectal cancer screening. Med Care. 2007;45:160–167. doi: 10.1097/01.mlr.0000246612.35245.21. [DOI] [PubMed] [Google Scholar]
- 19.Centers for Disease Control and Prevention, National Center for Health Statistics. NHIS Public Use Data Release, NHIS Survey Description. 2000:65. Available at: ftp://ftp.cdc.gov/pub/Health_Statistics/NCHS/2000/srvydesc.pdf Appendix 1.
- 20.Centers for Disease Control and Prevention, National Center for Health Statistics. NHIS Public Use Data Release, NHIS Survey Description. 2003:65. Available at: ftp://ftp.cdc.gov/pub/Health_Statistics/NCHS/2003/srvydesc.pdf Appendix 1.
- 21.Centers for Disease Control and Prevention, National Center for Health Statistics. NHIS Public Use Data Release, NHIS Survey Description. 2005:72. Available at: ftp://ftp.cdc.gov/pub/Health_Statistics/NCHS/2005/srvydesc.pdf Appendix 1.
- 22.Centers for Disease Control and Prevention, National Center for Health Statistics. NHIS Public Use Data Release, NHIS Survey Description. 2008:78. Available at: ftp://ftp.cdc.gov/pub/Health_Statistics/NCHS/2008/srvydesc.pdf Appendix 1.
- 23.Centers for Disease Control and Prevention, National Center for Health Statistics. National Health Interview Survey: Questionnaires, Datasets, and Related Documentation. Available at: http://www.cdc.gov/nchs/nhis/nhis_questionnaires.htm.
- 24.The White House, Office of Management and Budget. Revisions to the Standards for the Classification of Federal Data on Race and Ethnicity. Available at: http://www.whitehouse.gov/omb/fedreg_1997standards/
- 25.Centers for Disease Control and Prevention, National Center for Health Statistics. National Health Interview Survey: 2008 Imputed Family Income/Personal Earnings Files. Available at: http://www.cdc.gov/nchs/nhis/2008imputedincome.htm.
- 26.Bastani R. Intervention strategies in diverse populations. NIH State-of-the-Science Conference: Enhancing Use and Quality of Colorectal Cancer Screening, Program and Abstracts. Available at: http://consensus.nih.gov/2010/images/colorectal/colorectal_abstracts.pdf.
- 27.Cronin KA, Miglioretti DL, Krapcho M, Yu B, Geller BM, Carney PA, et al. Bias associated with self-report of prior screening mammography. Cancer Epidemiol Biomarkers Prev. 2009;18:1699–1705. doi: 10.1158/1055-9965.EPI-09-0020. [DOI] [PMC free article] [PubMed] [Google Scholar]
- 28.Holden DJ, Jonas DE, Porterfield DS, Reuland D, Harris R. Systematic review: enhancing the use and quality of colorectal cancer screening. Ann Intern Med. 2010;152:668–676. doi: 10.7326/0003-4819-152-10-201005180-00239. [DOI] [PubMed] [Google Scholar]
- 29.Patient Protection and Affordable Care Act. 2010 March 23; Public Law 111–148 Available at: http://www.gpo.gov/fdsys/pkg/PLAW-111publ148.pdf.