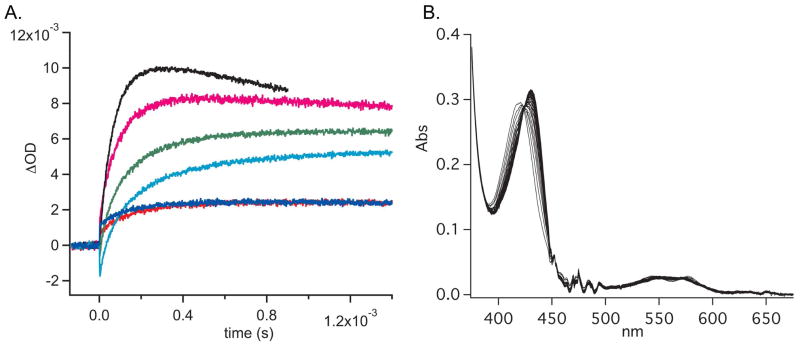
Figure 3.
Laser photolysis traces of the photolysis of the FeII-CO complex followed by binding of O2 (A) and representative stopped flow kinetic data (B). WT in red; I5L in blue; I5F/L144F in teal; I5F/I75F/L144F in green; I5F in magenta; I5F/I75F in black. Laser photolysis data were analyzed using Igor Pro. Stopped flow data were analyzed using SpecFit32.

