

Abstract
Background:
The systematic analysis of imaged pathology specimens often results in a vast amount of morphological information at both the cellular and sub-cellular scales. While microscopy scanners and computerized analysis are capable of capturing and analyzing data rapidly, microscopy image data remain underutilized in research and clinical settings. One major obstacle which tends to reduce wider adoption of these new technologies throughout the clinical and scientific communities is the challenge of managing, querying, and integrating the vast amounts of data resulting from the analysis of large digital pathology datasets. This paper presents a data model, which addresses these challenges, and demonstrates its implementation in a relational database system.
Context:
This paper describes a data model, referred to as Pathology Analytic Imaging Standards (PAIS), and a database implementation, which are designed to support the data management and query requirements of detailed characterization of micro-anatomic morphology through many interrelated analysis pipelines on whole-slide images and tissue microarrays (TMAs).
Aims:
(1) Development of a data model capable of efficiently representing and storing virtual slide related image, annotation, markup, and feature information. (2) Development of a database, based on the data model, capable of supporting queries for data retrieval based on analysis and image metadata, queries for comparison of results from different analyses, and spatial queries on segmented regions, features, and classified objects.
Settings and Design:
The work described in this paper is motivated by the challenges associated with characterization of micro-scale features for comparative and correlative analyses involving whole-slides tissue images and TMAs. Technologies for digitizing tissues have advanced significantly in the past decade. Slide scanners are capable of producing high-magnification, high-resolution images from whole slides and TMAs within several minutes. Hence, it is becoming increasingly feasible for basic, clinical, and translational research studies to produce thousands of whole-slide images. Systematic analysis of these large datasets requires efficient data management support for representing and indexing results from hundreds of interrelated analyses generating very large volumes of quantifications such as shape and texture and of classifications of the quantified features.
Materials and Methods:
We have designed a data model and a database to address the data management requirements of detailed characterization of micro-anatomic morphology through many interrelated analysis pipelines. The data model represents virtual slide related image, annotation, markup and feature information. The database supports a wide range of metadata and spatial queries on images, annotations, markups, and features.
Results:
We currently have three databases running on a Dell PowerEdge T410 server with CentOS 5.5 Linux operating system. The database server is IBM DB2 Enterprise Edition 9.7.2. The set of databases consists of 1) a TMA database containing image analysis results from 4740 cases of breast cancer, with 641 MB storage size; 2) an algorithm validation database, which stores markups and annotations from two segmentation algorithms and two parameter sets on 18 selected slides, with 66 GB storage size; and 3) an in silico brain tumor study database comprising results from 307 TCGA slides, with 365 GB storage size. The latter two databases also contain human-generated annotations and markups for regions and nuclei.
Conclusions:
Modeling and managing pathology image analysis results in a database provide immediate benefits on the value and usability of data in a research study. The database provides powerful query capabilities, which are otherwise difficult or cumbersome to support by other approaches such as programming languages. Standardized, semantic annotated data representation and interfaces also make it possible to more efficiently share image data and analysis results.
Keywords: Data models, databases, digitized slides, image analysis
INTRODUCTION
High-resolution digitized pathology images contain a wealth of spectral and morphologic features related to the microanatomy of the tissues under study. Examination of the subtle differences exhibited by diseased tissue at the cellular and sub-cellular levels has potential to improve characterization of the histologic type, stage, prognosis, and likely treatment response. Technologies for digitizing microscopy have advanced significantly in the past decade. Slide scanners are capable of producing high-magnification, high-resolution images from whole slides and tissue microarrays (TMAs) within several minutes. It is rapidly becoming feasible for even medium-scale studies to routinely generate thousands of whole-slide images. At this scale, the subjective process of manually capturing and classifying histopathologic features is both time-consuming and likely to increase observer variability and errors.[1]
Computerized image analysis offers a means of rapidly carrying out quantitative, reproducible measurements of micro-anatomical features in high-resolution pathology images and large image datasets. Nevertheless, image data is often an underutilized resource in biomedical research, since reliably analyzing even moderate numbers of virtual slides leads to a formidable information synthesis and management problem. As we shall describe in the next section, systematic analysis of large-scale image data can involve many interrelated analyses on hundreds or thousands of images, generating billions of quantifications such as shape and texture, as well as classifications of the quantified features.
In this paper, we describe a data model, referred to as Pathology Analytic Imaging Standards (PAIS), and a database implementation, which are designed to support the data management and query requirements of detailed characterization of micro-anatomic morphology through many interrelated analysis pipelines on whole-slide images and TMAs. The data model represents human-described and computer-generated annotation, markup and feature data on virtual slide images. The database supports a wide range of metadata and spatial queries on image annotations, markups, and features. We illustrate the use of the model and database using two biomedical research applications.
Background
We will use a research project underway at the In Silico Brain Tumor Research Center (ISBTRC)[2,3] as an example to illustrate data management challenges that arise from analyzing large numbers of high-resolution microscopy images. The example project is the characterization of micro-anatomic elements, such as cells and nuclei, in whole-slide tissue images. The morphology of these elements varies in shape and texture across different classes and grades of gliomas. For example, nuclei appear to be round shaped with smooth regular texture in oligodendrogliomas, whereas they are generally more elongated with rough and irregular texture in astrocytomas. However, there are also many nuclei that appear to be transitions and are difficult to classify. The project employs image analysis algorithms in whole-slide scans to provide a better quantitative description of such structures in order to improve the classification and grading of these diseases.
The project has already gathered over 700 whole-slide images of diffuse gliomas (219 images at 20× objective magnification and 517 at 40× magnification), derived from the TCGA repository, Henry Ford Hospital, and Emory University, with a long-term goal of expanding the studies to approximately 3500 slides from about 700 patients during the course of the project. Given the large number of slides, it is not feasible to manually examine each slide image, mark microscopic objects, and annotate them. Computerized analysis of the images is necessary to extract, quantify, and classify micro-anatomic features. The effectiveness of a computer analysis pipeline, however, depends on many factors including the nature of the histological structures being segmented, the classifications being performed, and sample preparation and staining. Thus, detailed computer-aided characterization of brain tumor morphology requires coordinated use of many interrelated analysis pipelines on a large number of images. Whole-slide brain images are roughly 5× 104 by 5×104 pixels at 20× objective magnification. Brain tumor image analysis algorithms segment and classify 105−107 cells in each virtual slide. Classification categories include a variety of classes of brain tumor cells, several categories of normal brain cells (astrocytes, oligodendrocytes, microglia and neurons), endothelial cells, red blood cells, and macrophages. Brain tumor tissue analyses can encompass discrimination from normal tissue, analysis of tumor cell density, classification of nuclei, quantification of mitotic figures, identification and classification of angiogenesis, and identification of differing types of necrosis, including the pseudopalisades that are often seen around necrosis in glioblastoma. A systematic analysis of datasets consisting of thousands of images, therefore, can result in classification of roughly tens of billions to trillions micro-anatomic structures. The process of classifying a given cell involves roughly 10-100 features describing morphometry, texture, and stain quantification. An in-depth analysis, even if limited to classifying the constituent cells of the specimens, can easily encompass a very large amount of features. These datasets need to be stored and indexed so that investigators can query and interrogate the results to search for patterns and correlations as well as validate and refine computer analysis algorithms.
Software systems and data models have been developed for managing and accessing digitized microscopy images and large image datasets. The virtual microscope system[4,5] is designed to support the storage, retrieval, and processing of very large microscopy images on high-performance systems. The Open Microscopy Environment (OME) project[6] has developed a data model and a database system that can be used to represent, exchange, and manage image data and metadata. The OME provides a data model of common specification for storing details of microscope setup and image acquisition. Cell Centered Database (CCDB)[7,8] is a system and data model developed to capture image analysis output, image data, and information on the specimen preparation and imaging conditions that generated the image data. The CCDB implements an ontology link to support semantic queries and data sources federation. The ImageMiner system[9] implements capabilities for content-based image retrieval for TMA datasets. DICOM Working Group 261 is developing a DICOM-based standard for storing microscopy images. However, the metadata in the model is limited and not easy to extend to efficiently represent and manage image analysis results. Similarly, DICOM Structured Report standard[10] has been used to model and store image annotations and markups in DICOM. The standard does not provide an approach for managing and querying data. Annotation and Image Markup (AIM)[11] is a data model developed in the caBIG® program. It is designed to facilitate standardization for image annotation and markup for radiology images. AIM is motivated by the characteristics and requirements of radiology imaging applications. Pathology images have characteristics that are not taken into account by the current AIM model.
Content-based image retrieval approaches and systems have also been implemented to support rich queries on image data.[12–17] One of the early systems with application in biomedicine employed methods to express the global characteristics of images as a measure of the Gleason grade of prostate tumors.[18,19] Another system[20] indexes image block segments at different scales and employs integrated region matching distances to characterize images. It allows users to browse the regions of a matched image at different scales. The use of high-performance computing systems for analysis has increased over the years to process image datasets quickly and generate large volumes of analysis results. Yang et al. have demonstrated a distributed system for computer-aided analysis of digitized breast tissue specimens.[21] Gurcan et al. employed parallel and distributed computing to efficiently support automated characterization of neuroblastoma using a multi-resolution grid-based framework.[22]
Most of the previous work in microscopy image data management was targeted at remote access to and sharing of microscopy images and annotations, and was not primarily designed to handle large volumes of analysis results and large images for correlative studies and algorithm validation. Our work, on the other hand, targets the following closely interrelated tasks: 1) to systematically manage, query and analyze results produced by data analyses composed from large numbers of interrelated algorithms, 2) to compare results produced by workflows consisting of cascades of multiple algorithms, 3) to efficiently manage resulting datasets that in aggregate can contain billions of imaging derived features, and 4) to support histological feature query and analysis patterns.
MATERIALS AND METHODS
Data Model
The Pathology Analytical and Imaging Standards (PAIS) model is designed to provide a flexible, efficient, and semantically enabled data model for pathology image analysis and characterization. The logical model of PAIS is defined in Unified Modeling Language (UML) and consists of 62 classes and associations between them. The major components of the model (main classes and relationships, not including attributes) are shown in Figure 1. These components capture and represent the following information:
Figure 1.

PAIS object model
Metadata that describes an image or a group of images, which have been used as the base for markups and annotations. This information can be used to identify and retrieve the relevant images from an image archive.
Identification of the area of interest from an image (e.g., a specific tile from a whole-slide image, or an area that contains a disk image in TMA image) for the purpose of markup and annotation. The relative zoom resolution of the region over the original image also is captured.
Information related to the study and analysis experiments. Results from the same algorithm but obtained using different input parameters applied on the same image can be grouped into the same collection.
Delineation of a spatial region in images and a set of values derived from pixels as image markups and features. Markups are associated with one or more images and can be in the form of geometric shapes, surfaces, and fields. Geometric shapes can be points, lines, polylines, polygons, rectangles, circles, and ellipses. Surfaces include finite element meshes as well as implicit surfaces. While both geometric shapes and surfaces represent boundaries in space, a field can be used to contain the actual data values within a spatial region. Examples of fields are pixel values, binary masks, gradient fields, and higher order derivatives.
Semantic metadata, referred to as annotations, about markup entities through coded or free text terms that provide explanatory or descriptive information. There are three types of annotations: observation, calculation, and inference. Observation holds information about interpretation of a markup or another annotation entity. Observations can be quantified based on different measure scales such as ordinal and nominal scales. Calculation stores information about the quantitative results from mathematical or computational calculations, such as Scalar, Array, Histogram, and Matrix. Inference is used to maintain information about disease diagnosis derived by observing imaging studies and/or medical history.
Derivation history of a markup or annotation, including algorithm information, parameters, and inputs. Such information is critical for validating analysis approaches and comparing algorithms.
Database Implementation
We have implemented a database infrastructure [Figure 2] to manage microscopy analysis results expressed in the PAIS model. The PAIS Data Repository component encapsulates the database and the data loading and query subcomponents. The database is designed to support queries on both metadata and spatial features for data retrieval, comparative data analysis, and algorithm validation. The types of queries include the following:
Figure 2.
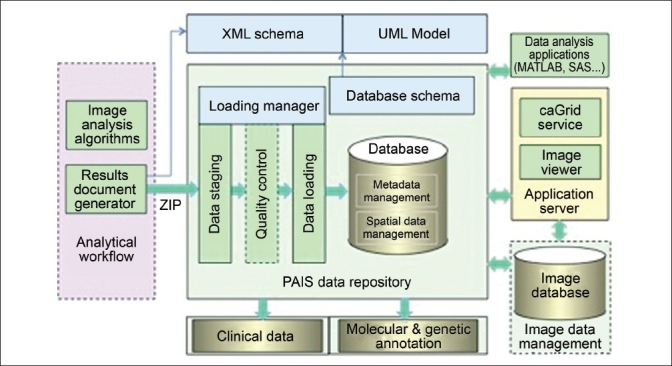
PAIS database implementation. The architecture includes analytical workflow, PAIS data repository, application server, image database, and data analysis applications
Queries involving combinations of image and algorithm metadata to retrieve analysis results. An example query is: Find all markups with area between 200 and 500 square pixels and eccentricity between 0 and 0.5 on image “astroII”.
Queries to compare results obtained from different algorithms and to compare computer-generated results with human annotations and markups. Examples are: Find the average glioma grades of nuclei segmented and calculated by algorithm “N SMORPH” for each human segmented region on image “OligoIII” grouped by human classification. Compare the average “Sum Canny Pixels” feature calculated from algorithms between the “Proneural” and “Mesenchymal” tumor subtypes.
Spatial queries, such as those used to assess relative prevalence of features or classified objects in various portions of slides or to assess spatial coincidence of combinations of features or objects. Examples of spatial queries are: Find all segmented nuclei from algorithm “NSMORPH” with parameter set 1 in the region segmented by human as “Astro grade II” on image “gbm0”. Find nuclei in region (100,100:1000,1000) that are detected by algorithm “NSMORPH-1” and that intersect with those detected by algorithm “NSMORPH-2” on image “OligoIII”.
We have used a relational database backend in our implementation, although results expressed in the PAIS model are exchanged as XML documents. Our performance evaluation has shown that the relational database approach is more efficient than a native XML-based approach in our case for a wide range of queries. The PAIS database comprises a set of tables mapped from the PAIS logical model. The database schema has 1) a data staging table for storing compressed PAIS documents submitted from clients and tracking jobs of data mapping; 2) metadata tables for storing metadata on images, subjects, projects, and experiments; 3) spatial tables for storing markup shape objects; 4) calculation tables for computed image features – multiple calculation tables provided for different feature sets; 5) observation tables (nominal or ordinal) for annotations; 6) vocabulary tables to define the common data elements used for calculations, observations and anatomic entities; 7) provenance tables for storing derivation history of markups and annotations; and 8) application tables such as validation tables for storing pre-computed markup intersection information between different methods. The database also provides a set of extended functions and stored procedures for manipulating data.
To enable convenient data exchanging between analysis programs and the PAIS database, we use XML-based representation for the PAIS model, based on an XML schema derived from the logical model. PAIS XML documents are generated via the PAIS document generator by each client application (image analysis applications and human markup and annotation applications). To reduce the size for processing, PAIS documents are often generated on partitioned regions such as tiles, and different PAIS document instances from different regions of the same image will share the same document unique identifier. For efficient data transportation, PAIS XML documents are further compressed into zip files.
RESULTS
We currently have three PAIS databases running on a Dell PowerEdge T410 server with CentOS 5.5 Linux operating system. The database server is IBM DB2 Enterprise Edition 9.7.2. We have chosen IBM DB2 since it is available free of charge for research and education and provides integrated support for spatial data types and queries through the spatial extender component. The set of databases consists of 1) a TMA database containing image analysis results from 4740 cases of breast cancer, with 641 MB storage size; 2) an algorithm validation database, which stores markups and annotations from two segmentation algorithms and two parameter sets on 18 selected slides, with 66 GB storage size; and 3) an in silico brain tumor study database comprising results from 307 TCGA slides, with 365 GB storage size. The latter two databases also contain human-generated annotations and markups for regions and nuclei.
Applications
We present two applications that demonstrate the use of PAIS for in silico research and correlative analysis. The first application employs the PAIS database to investigate whether glioma morphology correlates with gene expression data. The second application is a new project investigating relationships between microscopic and macroscopic features.
Application 1: In silico correlative morphometric study
A previous study of glioblastoma has defined four clinically relevant tumor subtypes by differences in gene expression and characteristic genomic alterations.[23] We have utilized the PAIS database in an effort to examine the morphological correlates of these tumor subtypes.[2] Computer algorithms were used to analyze diffuse glioma brain tumor images in a large-scale dataset consisting of 307 slides corresponding to 77 distinct patients. Each analysis computed 74 features for each segmented nucleus. The segmentation results and features were stored in the PAIS database. In order to correlate micro-anatomic morphometry with molecular profiles and clinical outcome, summary statistics on image features were computed for each image. This process involved calculating the mean feature vectors and the feature covariance values of all possible feature pairs over all nuclei in the image. The PAIS database was queried to search for feature pairs and retrieve corresponding feature values. The summary statistics for each image were then combined in a separate program to create a single-feature vector for the image. This allowed us to represent each image as a point in the summary statistics feature space – in our case it was a 2849-dimensional space, since a nucleus had 74 features.
Queries for mean, standard deviation, and covariance of feature calculations are supported through SQL queries with built-in aggregation functions in the database management system: the average, standard deviation, and covariance functions, respectively. With the PAIS database query support on morphological signature computation for whole-slide images, we were able to correlate nuclear morphometry with clinically relevant molecular characterizations and to produce preliminary results, suggesting a possible relationship between nuclear morphometry and the established clinically relevant molecular glioblastoma (GBM) tumor subtypes.
Application 2: Correlative study on liver biopsy
We are currently carrying out a study to quantify the relationship between the area of liver steatosis regions, clinical parameters such as liver functional studies, and radiology quantization measurements. This study involves a large set of liver biopsies with both microscopy and radiology images. The properties of the liver organs reflected in the radiology images, such as measurements of steatosis (i.e., fat content) and fibrosis (i.e., scarring), will be measured by experienced radiologists. The microscopy images will be analyzed by machine algorithms. Due to vast number of steatosis regions in each image, manual segmentation and annotation of images becomes very difficult. We are developing machine algorithms to identify all steatosis regions with certain constraints (e.g., constraints on size and shape). This information derived from microscopy imaging will then be integrated with the radiology readouts from the associated magnetic resonance imaging (MRI) images.
All numerical features derived from steatosis as well as the locations of the steatosis regions will be captured in the PAIS database. The radiology readouts will be stored in a database built on the AIM data model.[11] These two databases will be used to investigate how the measure of correlation between structures at different scales (e.g., microvesicular vs. macrovesicular steatosis) is varied as the cut-off values of properties used in machine algorithms are changed. This is particularly important because certain features such as the type of steatosis can be very crucial in predicting the functional status of the liver.[24] This will be done by generating queries on the PAIS database to search for and retrieve only the steatosis regions that satisfy a set of user-defined criteria on the properties and spatial locations of the regions, and by comparing the query results with the radiology readouts from the same images.
Database Performance
The PAIS database is designed to be fast for metadata and spatial queries and queries involving comparisons of results from different analyses. To undertake a performance evaluation of the database, we selected 18 slides and loaded image analysis results from two different algorithm parameter sets and human annotated results. The total volume of data amounts to about 18 million markups and 400 million features. We selected different types of queries that are typical in our use cases and ran them against the PAIS database and as MatrixLaboratory (MATLAB) programs. We chose MATLAB for comparison instead of a C/C++ implementation because MATLAB is a platform more commonly used for algorithm development and analysis by imaging researchers, although an implementation of the same operations in C/C++ could achieve lower execution times.
The queries selected for performance evaluation are: (Query 1) Count nuclei on each slide processed by a specific algorithm; (Query 2) Compute intersection ratio and distance between nuclei segmented by two different algorithms on the same slide. This query is important for algorithm validation studies, in which results obtained from different algorithms are compared to look for similarities and differences in the analysis outcome; and (Query 3) Retrieve the mean nuclear feature vector and covariance of features on nuclei segmented by an algorithm on a slide. This query is used to examine the relationship between nuclear morphology and tumor subtypes defined by molecular analyses.
The execution times for these queries are shown in Figure 3. The first query takes 18.4 seconds to execute for a single slide using MATLAB and only 0.068 second with the PAIS database. The execution times for the second and third queries are 545 and 24 seconds, respectively, using MATLAB, whereas the same queries take 19.5 and 4 seconds, respectively, with the PAIS database. Our results show that the PAIS implementation achieves significant speedup over the MATLAB-based implementation.
Figure 3.

Comparison of performance of PAIS versus MATLAB. PAIS database has significant performance advantage over programmatic approach (270, 28 and 5 times faster). Highly expressive query language: 5 lines versus 60 lines
Queries on multiple slides are generally linearly scalable in the PAIS database. Such scalability is ensured through data clustering on images and tiles at the data loading stage. Since most query operations are tile or slide based, such clustering will minimize the number of disk reads during query execution. The PAIS database loading tool is also optimized for efficiency. We use an efficient event-based XML document parsing approach to process XML documents. The approach only needs a single scan of a document and requires minimal resource. We also optimize insertions through batch transactions. We are able to load results from a singe whole-slide image (~0.5 million objects) into the PAIS database within 10 minutes.
Another significant advantage of the PAIS database, compared to accessing and retrieving data through MATLAB, is the highly expressive power of queries. SQL query language, with the spatial capabilities through the use of spatial data types and spatial functions, makes it very easy to express such queries. For example, Query 2 is expressed as a single SQL statement with five lines of SQL code. With MATLAB, the same query is written as 30 lines of computation code plus another 30 lines of code for handling disk read/write operations.
Spatial queries are common in our use cases. They are used for retrieving contained markup objects, the density of markup objects, comparisons between different algorithm results, or between human-generated and algorithmic results. Spatial queries are also used for constraining analysis on certain regions, such as human annotated regions (e.g., tumor regions) or regions classified by an analysis algorithm. The spatial database engine in DB2 Spatial Extender provides automatic query optimization on spatial predicate-based queries through its grid-based spatial index. We take advantage of this index to speed up queries. Instead of comparing a markup with all markups across the whole image from the other dataset, the grid-based index can be invoked to retrieve markups that intersect the same grid as the query markup. In this way, the set of comparisons is reduced significantly and linear scalability can be achieved.
DISCUSSION AND CONCLUSIONS
Effective use of large microscopy image datasets in basic, clinical, and translational research requires the application of many interrelated analyses for the detection and detailed classification of morphological characteristics. Our experience with the in silico study of brain tumors has shown that datasets resulting from these analyses can be extremely large. Modeling and managing pathology image analysis results in databases provides immediate benefits on the value and usability of data through standardized data representation, data normalization, and semantic annotation. The database provides powerful query capabilities, which are otherwise difficult or cumbersome to support by other approaches such as programming languages. Advanced database access methods can be employed to make queries efficient. Besides, all query interfaces are through standardized SQL query language, which is highly expressive and natural for data retrieval and comparison operations. Standardized, semantic annotated data representation and expressive interfaces also make it possible to more efficiently share image data and analysis results.
However, moving data from unstructured representation to a structured one is challenging. The first major challenge is the big gap between researchers who work on imaging algorithms and database researchers and developers. Image algorithm researchers focus on algorithms and programming languages, whereas database developers tend to look at the problem from the point of view of data models, query languages, and query optimization methods. This project has been made possible through extensive collaboration as a team of multidisciplinary people to map imaging questions into database questions. The second major challenge is to generate valid structural data. Databases have rigid requirements on data validity, such as integrity constraints and data types, especially complex spatial data types. Human-generated annotations such as freehand drawing boundaries are often invalid polygons (e.g., unclosed or self-crossing polygons). We have detected in our studies more than a dozen scenarios of invalid polygons. We have developed a set of computational geometry algorithms and validation tools to fix such scenarios and transform them into valid spatial data types acceptable by the spatial database engine. The third challenge is to provide a generic and user-friendly document generator that can be used in diverse applications. Applications oftentimes have their own proprietary data representations and naming conventions, for example, format on encoding patient ID in file names. To let application users develop their own document generation tool is difficult. Instead, we have developed a customizable PAIS document generator framework, which takes a simple plain file-based representation of results and annotates the data with additional metadata conventions defined in an XML-based customization file. This approach significantly simplifies users' effort for document generation. They only need to convert their algorithms' results into this simple plain file format, and documents are then automatically generated.
In our current implementation, we have chosen a relation database implementation of the PAIS model. XML native databases are becoming mature technologies and have many advantages on managing XML documents. In this approach, XML documents are managed as they are, and no mapping between data models and query languages is needed. Besides, XML databases provide XML query languages such as XQuery and SQL/XML to express powerful queries. One immediate benefit of XML-based approach is that data exchanging is made easy. XML databases are also much tolerant to schema evolutions. Another significant benefit is that application development is simplified because no mapping from the XML schema to the relational schema is needed. However, native XML-based approach is more suitable for managing small-sized XML documents such as those generated from TMA image analyses. The relational database-based implementation, on the other hand, is highly efficient on both storage and query performance for managing and querying large-scale result data. The side effect is major effort needed on developing efficient tools for mapping XML documents into relational and spatial tables.
We plan to extend our current work in several ways: The current PAIS database server runs on a single node machine where no parallel I/O is provided. We are working on scaling up database with parallel I/O capabilities and data partitioning through parallel database infrastructure. Another ongoing work is the investigation of MapReduce-based25 query processing capability. We are investigating the use of the MapReduce approach for scalable query execution and data processing on commodity clusters.
Acknowledgments
This research is funded, in part, by a grant from the NIH through contracts 5R01LM009239-04 and 3R01LM009239-03S2 from the National Library of Medicine and contracts 9R01CA156386-05A1 and SAIC/NCI Contract No. HHSN261200800001E from the National Cancer Institute. This work also received support, in part, from NCI caBIG grants 79077CBS10, 94995NBS23, and 85983CBS43, the NIH 1RC4MD005964-01 grant, the NHLBI 2R24HL075343-05 grant, the NIH U54 CA113001, P20 EB000591 by the BISTI program, the NSF grants CNS-0403342 and CNS-0615155, by the NCI and NIH under contract no. N01-CO-12400, by PHS Grant UL1RR025008 from the Clinical and Translational Science Award Program and by the US Dept. of Energy under contract DE-AC02-06CH11357. UMDNJ also wants to thank and acknowledge IBM for providing free computational power and technical support for this research through World Community Grid and for the Shared University Research (SUR) Project Award (#W0853412) and gift from the IBM International Foundation. The content of this publication does not necessarily reflect the views or policies of the Department of Health and Human Services, nor does mention of trade names, commercial products, or organizations imply endorsement by the US Government.
Footnotes
Available FREE in open access from: http://www.jpathinformatics.org/text.asp?2011/2/1/32/83192
REFERENCES
- 1.Furness PN, Taub N, Assmann KJ, Banfi G, Cosyns JP, Dorman AM, et al. International variation in histologic grading is large, and persistent feedback does not improve reproducibility. Am J Surg Pathol. 2003;27:805–10. doi: 10.1097/00000478-200306000-00012. [DOI] [PubMed] [Google Scholar]
- 2.Cooper LA, Kong J, Gutman DA, Wang F, Cholleti SR, Pan TC, et al. An integrative approach for in silico glioma research. IEEE Trans Biomed Eng. 2010;57:2617–21. doi: 10.1109/TBME.2010.2060338. [DOI] [PMC free article] [PubMed] [Google Scholar]
- 3.Saltz J, Kurc T, Cholleti S, Kong J, Moreno C, Sharma A, et al. Proceedings of the Annual Symposium of American Medical Informatics Association Summit on Translational Bioinformatics (AMIA-TBI 2010) San Francisco, LA: 2010. Mar, Multi-scale, integrative study of brain tumor: In silico brain tumor research center. [Google Scholar]
- 4.Catalyurek UV, Beynon MD, Chang C, Kurc TM, Sussman A, Saltz JH. The virtual microscope. IEEE Trans Inf Technol Biomed. 2003;7:230–48. doi: 10.1109/titb.2004.823952. [DOI] [PubMed] [Google Scholar]
- 5.Afework A, Beynon MD, Bustamante F, Cho SH, Demarzo A, Ferreira R, et al. Digital dynamic telepathology – the virtual microscope. J Am Med Inform Assoc. 1998:912–6. [PMC free article] [PubMed] [Google Scholar]
- 6.Goldberg I, Allan C, Burel JM, Creager D, Falconi A, Hochheiser H, et al. The open microscopy environment (OME) data model and XML file: Open tools for informatics and quantitative analysis in biological imaging. Genome Biol. 2005;6:R47. doi: 10.1186/gb-2005-6-5-r47. [DOI] [PMC free article] [PubMed] [Google Scholar]
- 7.Martone ME, Tran J, Wong WW, Sargis J, Fong L, Larson S, et al. The cell centered database project: An update on building community resources for managing and sharing 3D imaging data. J Struct Biol. 2008;161:220–31. doi: 10.1016/j.jsb.2007.10.003. [DOI] [PMC free article] [PubMed] [Google Scholar]
- 8.Martone ME, Zhang S, Gupta A, Qian X, He H, Price DL, et al. The cell-centered database: A database for multiscale structural and protein localization data from light and electron microscopy. Neuroinformatics. 2003;1:379–95. doi: 10.1385/NI:1:4:379. [DOI] [PubMed] [Google Scholar]
- 9.Chen W, Chu V, Hu J, Yang L, Wang F, Kurc T, et al. Advancing Practice, Instruction and Innovation Through Informatics. Pittsburgh, PA: APIII; 2009. ImageMiner: a medical image analysis and image management UML data model. [Google Scholar]
- 10.Clunie DA. DICOM structured reporting and cancer clinical trials results. Cancer Inform. 2007;4:33–56. doi: 10.4137/cin.s37032. [DOI] [PMC free article] [PubMed] [Google Scholar]
- 11.Channin DS, Mongkolwat P, Kleper V, Sepukar K, Rubin DL. The caBIG annotation and image markup project. J Digit Imaging. 2010;23:217–25. doi: 10.1007/s10278-009-9193-9. [DOI] [PMC free article] [PubMed] [Google Scholar]
- 12.Wang J, Wiederhold G, Firschein O, Wei S. Content-based image indexing and searching using daubechies' wavelets. Int J Digital Librar. 1998;1:311–28. [Google Scholar]
- 13.Carson C, Thomas S, Belongie S, Hellerstein J, Makik J. Third Int Conf Vis Inf Sys. 1999. Jun, Blobworld: A system for region-based image indexing and retrieval. [Google Scholar]
- 14.Schnorrenberg F, Pattichis C, Schizas C, Kyriacou K. Content-based retrieval of breast cancer biopsy slides. Technol Health Care. 2000;8:291–7. [PubMed] [Google Scholar]
- 15.Guld MO, Thies C, Fischer B, Lehmann TM. A generic concept for the implementation of medical image retrieval systems. Stud Health Technol Inform. 2005;116:459–64. [PubMed] [Google Scholar]
- 16.Chen W, Foran DJ, Reiss M. Unsupervised imaging, registration and archiving of tissue microarrays. Proc AMIA Symp. 2002:136–9. [PMC free article] [PubMed] [Google Scholar]
- 17.Hadida-Hassan M, Young SJ, Peltier ST, Wong M, Lamont S, Ellisman MH. Web-based telemicroscopy. J Struct Biol. 1999;125:235–45. doi: 10.1006/jsbi.1999.4095. [DOI] [PubMed] [Google Scholar]
- 18.Wetzel A, Andrews P, Becich M, Gilbertson J. Computational aspects of pathology image classification and retrieval. J Supercomputing. 1997;11:279–93. [Google Scholar]
- 19.Zheng L, Wetzel AW, Gilbertson J, Becich MJ. Design and analysis of a content-based pathology image retrieval system. IEEE Trans Inf Technol Biomed. 2003;7:249–55. doi: 10.1109/titb.2003.822952. [DOI] [PubMed] [Google Scholar]
- 20.Wang JZ, Nguyen J, Lo KK, Law C, Regula D. Multiresolution browsing of pathology images using wavelets. Proc AMIA Symp. 1999:430–4. [PMC free article] [PubMed] [Google Scholar]
- 21.Yang L, Chen W, Meer P, Salaru G, Feldman MD, Foran DJ. High throughput analysis of breast cancer specimens on the grid. Med Image Comput Comput Assist Interv. 2007;10(Pt 1):617–25. doi: 10.1007/978-3-540-75757-3_75. [DOI] [PMC free article] [PubMed] [Google Scholar]
- 22.Gurcan MN, Kong J, Sertel O, Cambazoglu BB, Saltz J, Catalyurek U. Computerized pathological image analysis for neuroblastoma prognosis. AMIA Annu Symp Proc. 2007:304–8. [PMC free article] [PubMed] [Google Scholar]
- 23.Verhaak RG, Hoadley KA, Purdom E, Wang V, Qi Y, Wilkerson MD, et al. Integrated genomic analysis identifies clinically relevant subtypes of glioblastoma characterized by abnormalities in PDGFRA, IDH1, EGFR, and NF1. Cancer Cell. 2010;17:98–110. doi: 10.1016/j.ccr.2009.12.020. [DOI] [PMC free article] [PubMed] [Google Scholar]
- 24.Marsman H, Matsushita T, Dierkhising R, Kremers W, Rosen C, Burgart L, et al. Assessment of donor liver steatosis: Pathologist or automated software? Hum Pathol. 2004;35:430–5. doi: 10.1016/j.humpath.2003.10.029. [DOI] [PubMed] [Google Scholar]
- 25.Dean J, Ghemawat S. Mapreduce: Simplified data processing on large clusters. Communications of the ACM. 2008;51:107–13. [Google Scholar]