

Abstract
A simulation study was performed to determine the feasibility and performance of imaging nanoparticles as contrast agents in dual energy computed tomography. An analytical simulation model was used to model the relevant signal to noise ratio (SNR) in dual energy imaging for the specific case of a three material patient phantom consisting of water, calcium hydroxyapatite and contrast agent. Elemental gold and iodine were both considered as contrast agents. Simulations were performed for a range of monenergetic (20 - 150 keV) and polyenergetic (20-150 kVp) beam spectra. A reference configuration was defined with beam energies of 80 kVp and 140 kVp to match current clinical practice. The effect of adding a silver filter to the high energy beam was also studied. A figure of merit (FOM) which normalized the dual energy SNR to the square root of patient integral dose, was calculated for all cases. The units of the FOM were keV−1/2. A simple Rose model of detectability was used to estimate the minimum concentration of either elements needed to be detected (SNR>5). For monoenergetic beams, the peak FOM of gold was 6.4 × 10⁻⁶ keV−1/2while the peak FOM of iodine was 3.1 × 10⁻⁶ keV−1/2, a factor of approximately 2 greater for gold. For polyenergetic spectra, at the reference energies of 80 kVp and 140 kVp, the FOM for gold and iodine was 1.65 × 10⁻⁶ keV−1/2 and 5.0 × 10⁻⁷ keV−1/2, respectively, a factor of approximately 3.3 greater. Also at these energies, the minimum detectable concentration of gold was estimated to be 58.5 mg/mL while iodine was estimated to be 117.5 mg/mL. The results suggest that the imaging of a gold nanoparticle contrast agent is well suited to current conditions used in clinical imaging. The addition of a silver filter of 800 μm further increased the image quality of the gold signal by approximately 50% for the same absorbed dose to the patient.
Keywords: Dual-energy, Contrast Imaging, CT, CAC, Functional Imaging
1. INTRODUCTION
The characterization of coronary plaque is an important clinical question. Most coronary plaques that lead to fatal and non-fatal myocardial infarction are less than 70% stenosed and vulnerable to rupture(Casscells et al., 2003). These plaques have a large lipid core and a thin fibrous cap which easily ruptures and lodges into downstream blood vessels, causing morbidity(Fayad and Fuster, 2001). In contrast, severely stenotic plaques contain more smooth muscle cells and collagen, but fewer lipids, and are less prone to rupture. The identification of vulnerable plaques is an important step in the risk assessment of patients with suspected coronary artery disease. Attempts to distinguish unstable plaques include techniques such as intravascular ultrasound (IVUS), angioscopy, optical coherence tomography (OCT), spectroscopy, intravascular magnetic resonance imaging, and, computed tomography (CT)(MacNeill et al., 2003).
In the context of cardiac imaging, contrast agents circulating in the blood pool can provide anatomical information only about the lumen anatomy. Recently, however, the use of gold and iodine based nanoparticle contrast agents have recently been proposed for x-ray imaging to visualize atherosclerotic lesions due to their uptake in macrophages, especially when attached to targeting peptides or antibodies which concentrate in stable and unstable plaque(Hyafil et al., 2007; Boote et al., 2010). Dual energy imaging could possibly be used to visualize a nanoparticle contrast agent. However a recent study showed similar detectability, in terms of receiver operating characteristic (ROC) performance, for the imaging of lung lesions when compared to standard digital radiography(Kashani et al., 2009). Also, it is likely that calcium hydroxyapatite would be present at the site of a coronary plaque(Feuerlein et al., 2008). A method is needed to distinguish whether a signal of interest is due to the presence of a nanoparticle contrast agent, calcium hydroxyaptite, or both. One possibility for enhanced detection is the use of dual energy methods in CT(Alvarez and Macovski, 1976; Sidky et al., 2004; Johnson et al., 2007; Liu et al., 2009). Here, the enhanced contrast resolution inherent to CT could be combined with the quantitative abilities of dual energy methods. A recent publication reported on the ability of dual energy CT to resolve a three material mixture consisting of water, calcium hydroxyapatite and iron nitrate in a single voxel(Liu et al., 2009). As to the selection of either gold or iodine as a contrast agent in dual energy CT, mass attenuation curves for each element can be seen in figure 1. Values were obtained from previously reported data(Boone and Chavez, 1996). The mean attenuation of iodine is higher than that of gold for much of the diagnostic energy range (~ 33-80 keV) due the presence of a k-edge at 33.1 keV. However, the absorption k-edge of gold is 80.7 keV and might be better suited with the relatively high mean beam energies used in dual energy CT. Already the use of gold nanoparticles as a contrast agent has been studied in simulation for use in radiotherapy applications(McMahon et al., 2008). Other considerations for gold include increased circulation times as compared to iodine, up to 15 hours(Cai et al., 2007), and ease of fabrication into nanoparticles for a variety of shapes and sizes(Kattumuri et al., 2007; Turkevich et al., 1951; Kim et al., 2007). They have also been reported by several groups to be non toxic(Kattumuri et al., 2007; Boote et al., 2010; Cai et al., 2007). It would be useful to see how well these two contrast agents would perform under clinically relevant conditions.
Figure 1.

A logarithmic plot of the mass attenuation coefficient for the four materials considered in this study for the diagnostic energy range.
The purpose of this study is to simulate the performance of these two elements as contrast agents for use in dual energy dual kVp CT, specifically in the case where the voxel of interest is assumed to be a three material mixture, and to relate their performance to conditions which are clinically relevant for dual energy CT. This indicates that dual energy CT would allow the simultaneous detection and quantification of three materials in a single voxel. Also, as the use of a filter has been suggested for both dual energy projection imaging(Ducote et al., 2006; Shkumat et al., 2007; Kashani et al., 2009) and CT(Primak et al., 2009), its effect was also considered. What follows is a description of the analytical simulation model, and the selected criteria for performance and detectability.
2. MATERIALS AND METHODS
2.1. The analytical simulation model
The analytical model described here has been previously reported(Ducote and Molloi, 2008). It was modified here for the specific case of three material imaging. The simulation traces the emission of photons from the x-ray source, their attenuation through the patient and subsequent absorption in the detector. From this ray tracing, the low and high energy attenuation coefficients for each material in the study were calculated as were the recorded detector signals and their uncertainties due to statistical x-ray noise. These quantities were used to further calculate quantities relevant to dual energy imaging, namely the dual energy signal and uncertainty for each basis material (i.e. water,calcium, and gold) image.
A reference configuration was selected where parameters of beam energy and half value layer (HVL) were chosen to be similar to a currently available dual energy CT system(Johnson et al., 2007). The reference configuration is described in section 2.2. Two cases were considered. The first was monoenergetic x-ray beams with an ideal detector, which predict the peak performance which can be achieved. The second was polyenergetic beams and a charge integrating detector with quantum and geometric detection efficiencies chosen to be similar to the clinical reference system.
2.2. X-ray spectra
Monoenergetic x-rays were simulated within the range of 20 – 150 keV. Polyenergetic x-ray beams were simulated within the range of 20 – 150 kVp. Spectra were provided by the XCOMP5R code of Nowotny and Hoofer(Nowotny and Höfer, 1985). The aluminum pre-filtration of the low and high energy beams was chosen in order to match the mean beam energies, in keV, of the clinical reference system at tube voltages of 80 kVp and 140 kVp, respectively(Johnson et al., 2007). This was accomplished by incrementally increasing the thickness of aluminum until the mean beam energies were equal to 53.3 and 71.0 keV for the low and high energy beams, respectively. This was achieved with 14.50 mm aluminum; no other pre-filtration was added to the low or high energy beams. The aluminum half value layer of each reference beam was determined to be approximately 6.4 mm Al and 9.8 mm Al for the 80 kVp beam and the 140 kVp beam, respectively. The amount of aluminum filtration was kept constant throughout the study regardless of the kVp. For completeness, the simulation considered every combination of low and high energy polyenergetic spectra between 20 – 150 kVp. However for clinical systems, tube loading constraints and photon transmission requirements would limit the choice of tube voltage for the low energy beam and a cut off of 70 kVp was selected as the lower limit of what would be achievable in actual practice.
2.2.1. The use of a high atomic number filter
The effect of a silver filter (Z=47) was also studied. While keeping the beam energies fixed at the reference settings of 80 kVp and 140 kVp, the effect of an added silver filter on image quality was tested as a function of thickness from 0 to 2000 μm in increments of 100 μm.
2.3. Phantom and contrast elements
The anatomy of the chest was modeled with 30 cm of water. In order to simulate the presence of three materials, two contrast elements were modeled with each displacing a small thickness of water. The first contrast element was calcium hydroxyapatite, Ca5(PO4)3(OH). A concentration of 50 mg/mL occupying 1.0 mm3 was chosen designed to simulate the presence of a small calcification in plaque. The second element was either elemental gold or iodine depending on which contrast agent was being considered. For each energy, and depending on which contrast element was being simulated, the detector signal was calculated by tracking the x-ray attenuation of all photons through the thicknesses of water, calcium and gold or water, calcium and iodine.
For the case of gold, elemental gold with a concentration of 2.0 mg/mL occupying 1.0 mm3 was selected as it was expected to yield the same signal as 50 mg/mL of calcium hydroxyapatite from a preliminary comparison of the detected signals from the simulation model. In order to determine the concentration of elemental iodine, one possibility was to select the same concentration as that of gold. However, the assumption here was that the total number of nanoparticles ingested by the macrophages was constant implying that the number of molecules should instead be matched. This was accomplished by scaling the concentration of gold by the ratio of the molecular masses of iodine (126.91 g/mol) to gold (196.97g/mol), equal to 0.644. This yielded an elemental iodine concentration of approximately 1.3 mg/mL in order to match an equal number of molecules between the two contrast agents.
2.4. Detected signal
For the ideal detector, all photons were assumed to be detected (QDE=1.0). For the clinical detector, the quantum detection efficiency was calculated by considering the photon absorption in a 1.4 mm thickness of a Gd2O2S scintillator of density 7.44 g/cm3(Kalender and Kyriakou, 2007). The geometrical detection efficiency was estimated to be 0.9(Kalender, 2005). As these detectors are considered very low noise(Bushberg J.T. , 2002), the effect of additive electronics noise was ignored.
Combining the parameters in sections 3.2, 3.3, and 3.4, the total detected signal can be expressed as:
| > | (1) |
Where N0(E) is the incident photons calculated from the x-ray spectral model after aluminum pre-filtration, μf(E)tf is the attenuation due to the presence of a silver filter, when present. μw(E)tw, μb(E)tb, and μc(E)tc are the attenuations due to the patient thickness, calcium hydroxyapatite, and contrast element, respectively. W(E) is a weighting factor which describes the detection process. For the ideal photon counting detector, this value was equal to 1. For the charge integrating detector, whose signal is proportional to the detected energy, it was equal to E. Likewise, Q(E) is the energy dependent quantum detection efficiency and calculated as described above. G is the geometric detection efficiency, equal to 1.0 for the ideal detector and 0.9 for the charge integrating detector. The total signal is the integral over all energies, E.
2.5. Patient dose estimation and optimization
One method of estimating patient dose is through the use of entrance skin air kerma (ESAK) as a surrogate measure. However, as a wide range of beam energies were considered in this study as was the effect of beam filtration, the correspondence between patient dose to ESAK is less strong. Instead, the measure selected in this study was the integral dose, which is the total energy absorbed by the patient. This can be estimated by taking the difference between the energy of the incident beam and the energy of the beam after attenuation through the patient. In order to account for the energy loss due to x-rays which scatter outside the patient, and therefore do not contribute to patient dose, a parameterized model of integral dose generated with data from Monte Carlo simulations was used(Boone, 1992). A reference dose was calculated for a 140 kVp reference beam (mean beam energy of 71.0 keV) with a total ESAK of 10.0 mGy and patient thickness of 30.0 cm. This dose was determined to be 1.51 × 10¹⁰ keV. For dual energy simulations, this dose was then divided between the low and high energy beams. The allocation of dose between the low and high energy beams is a determining factor in signal quality(Van Lysel, 1994; Ducote and Molloi, 2008). The detected signal is directly proportion to the amount of allocated dose. This relationship between the detected low and high energy signals and dual energy SNR is further described in the following section. For each tested beam pair, the ratio of dose between the low and high energies was varied from 0.0 to 1.0 in increments of 0.1. The ratio of dose which optimized the SNR (described in section 3.6) was recorded.
2.6. Calculation of dual energy signal to noise ratio and figure of merit
The dual energy signal-to-noise ratio (SNR) was calculated from the uncertainty in the basis material thickness measurement for the contrast element under consideration. The variance in thickness for either contrast element can be written as:
| (2) |
Where tc is the thickness of the contrast element under consideration with subscript c referring to either gold or iodine. is the energy dependent attenuation coefficient, with subscript i referring to water (w), calcium hydroxyapatite (b), or the contrast agent (c) at an energy E with the subscript j referring to either the low (l) or high (h) energy beam. is the squared signal to noise ratio with subscript i referring to the low or high energy detector signal. Similarly, the dual energy SNR is defined as . Although the simulation was dependent on all materials in the phantom, the results are explicitly reported only for the gold and iodine contrast elements.
Details on the derivation of the dual energy basis material measurement uncertainty in equation two is provided in the appendix.
A figure of merit (FOM) was chosen in order to optimize the dual energy SNR with respect to patient dose and was defined as . This definition permits easy comparison of image quality between different configurations by taking the ratio of any two FOM’s of interest.
2.7. Effect of patient thickness
As the majority of simulations were carried out with a patient thickness of 30.0 cm, several additional simulations were performed at the reference beam energies of 80 kVp and 140 kVp for additional patient thicknesses of 15.0, 20.0, 25.0, and, 35.0 cm to assess changes in the FOM as a function of thickness.
2.8. Rose model estimate of minimum detectable contrast agent concentration
In order to address questions about the detectability of either contrast agent in a dual energy configuration as a function of concentration, a simple criteria, described by the Rose model was implemented(Hasegawa, 1991; Johns and Yaffe, 1985). The model is based on the differentiation of a target region from a background region. The basis for this differentiation is the differential number of detected photons between the two regions. This difference is expressed as the signal or signal difference to noise ratio. A low contrast target is considered detectable when this value is greater than or equal to five(Hasegawa, 1991). The equation for the Rose model is expressed as follows:
| (3) |
Where K2 was defined as the squared signal to noise ratio in the original description and is equal to the product of the square of image contrast (C), the photon fluence per unit area φ and the total area of the target region, A.. The image contrast is the relative difference in the target signal above the background region. In dual energy imaging, where the background is presumed to be completely suppressed, the contrast C can be taken as 1.0. As the signal to noise ratio is related to the square root of the total number of detected photons, φ A , can be expressed simply as the square of the dual energy image is SNRtc. In dual energy imaging, the SNR of the Rose model, K, then, is seen to be the dual energy SNR. A range of concentrations were simulated up to 200 mg/mL. The signal was defined as “detectable” when the value of K was greater than or equal to 5. Previously, the FOM was defined with the assumption that the same numbers of molecules were ingested by the macrophage. That assumption was used as a means to compare the SNR of one contrast agent relative to the other. Here, that assumption was relaxed in order to estimate the minimum amount of each contrast agent needed for detection as a function of absolute concentrations. The specific parameters for this simulation were at the reference beam energies of 80 kV and 140 kV, an aperture of 1.0 mm2, and a total integral dose of 1.21 × 10¹⁰ keV, equivalent to 8.0 mGy ESAK(Zhou, 2010), which was divided between the low and high energy beams
3. RESULTS
Shown in figure 2 are the results from monoenergetic simulations with an ideal detector in the form of 2D contour plots. The values shown on the contour plots correspond to the FOM of which the unit is keV−1/2. On the axes are the beam energies corresponding to the low energy on the x axis, and the high energy on the y axis. The optimal combination of low and high beam energies for the imaging of gold occurred at 46 keV and 81 keV with an FOM value of 6.4 × 10⁻⁶ keV−1/2. For the imaging of iodine, the optimal combination occurred at 33 keV and 44 keV with an FOM value of 3.1 × 10⁻⁶ keV−1/2.
Figure 2.

A plot of the figure-of-merit in keV−1/2for imaging a gold signal (a) and iodine signal (b) on a 30 cm water and calcium background with two monoenergetic beams. The optimal FOM value for gold was 6.4 × 10⁻⁶ keV−1/2 and the optimal value for iodine was 3.1 × 10⁻⁶ keV−1/2.
For polyenergetic beams with a charge integrating detector, results are presented in Figure 3. Here, the optimal combination of beam energies for the imaging of gold occurred at 80 kVp, and 139 kVp with an FOM value of 1.6 × 10⁻⁶ keV−1/2. For the imaging of iodine, the optimal combination occurred at 33 kVp and 52 kVp with an FOM value of 2.2 × 10⁻⁶ keV−1/2. However, the optimal combination above the low energy cutoff was 70 kVp and 150 kVp with an FOM value of 6.6 × 10⁻⁷ keV−1/2.
Figure 3.

A plot of the figure-of-merit for imaging a gold signal (a) and iodine signal (b) on a 30 cm water and calcium background with two polyenergetic beams. The optimal FOM value for gold was 1.6 × 10⁻⁶ keV−1/2 and occurred at beam energies of 80 kVp and 139 kVp. The optimal value for iodine was 2.2 × 10⁻⁶ keV−1/2 and occurred at energies of 33 kVp and 52 kVp. However, for gold, the optimal combination above the low energy cutoff was 70 kVp and 150 kVp with an FOM value of 6.6 × 10⁻⁷ keV−1/2.
FOM values at the reference beam energies of 80 kVp and 140 kVp for gold and iodine were 1.7 × 10⁻⁶ and 2.2 × 10⁻⁶ keV−1/2, respectively To assess the sensitivity of changes in kVp near the reference beam energies, the FOM is presented in Figure 4 as a function of the low energy kVp (while holding the high energy fixed at 140 kVp) and as a function of the high energy kVp (while holding the low energy fixed at 80 kVp). When the high energy was held fixed at 140 kVp, the optimal low beam energy for gold was at 80 kVp, while that for iodine showed two local maxima, one at 33 kVp and one at 52 kVp below the low energy cutoff, but showed no local maxima at or above 70 kVp. Likewise for the case of holding the low energy fixed at 80 kVp, the optimal high energy for gold was 139 kVp, while the optimal energy for iodine was 150 kVp, the highest simulated energy.
Figure 4.

A plot of the FOM when varying the low energy beam (a) or high energy beam (b) while holding the other beam constant at the reference energy. Maxima are marked on the figures showing where the FOM was highest.
Presented in Figure 5 are the results showing the effects of added silver filtration and the effect of changing patient thickness on FOM at the reference beam energies of 80 kVp and 140 kVp. For gold, the FOM was optimized after the inclusion of 800 μm of added silver with a peak FOM of 2.54 × 10⁻⁶ keV−1/2. While for iodine, the FOM continued to increase with added filtration, and was equal to 1.0 × 10⁻⁶ keV−1/2 after the inclusion of 2000 μm of added silver. The FOM was highest for the smallest patient thickness of 15 cm and decreased with the latter in an exponential manner, as expected. This trend appears as a line due to the logarithmic scale on the y axis.
Figure 5.

A plot of the figure-of-merit as a function of silver filter thickness for the reference case and 30 cm patient thickness(a) or patient thickness (b) at the reference beam energies of 80 kVp and 140 kVp.
Presented in figure 6 is the predicted signal to noise ratio from the Rose model as a function of contrast concentration. At an SNR of 5, the concentration of gold was determined to be 58.5 mg/mL while the concentration of iodine was determined to be 117.5 mg/mL.
Figure 6.
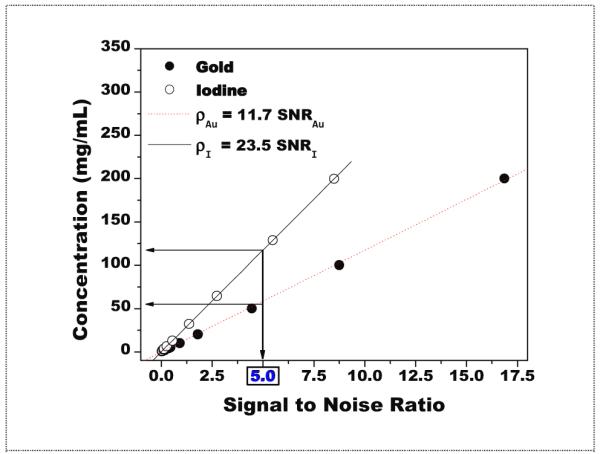
Rose model predictions of concentrations vs. signal to noise ratio. For an SNR of 5, the concentration of gold was determined to be 58.5 mg/mL while the concentration of iodine was determined to be 117.5 mg/mL. These values were estimated from the linear fitting of each data set.
FOM and dose allocation data from the study for several relevant beam combinations and configurations was tabulated and shown in Table 1. Presented in figure 7 are the polyenergetic spectra for both gold and iodine after optimization with the silver filter.
Table 1. Summary data for several relevant configurations. Also shown with FOM is the optimal dose allocation at which the optimal value occurred. For the case of gold and beam energies of 139 kVp and 140 kVp, higher precision was used in order to resolve differences in the FOM.
| Contrast Element |
Beam Energy (low, high) |
Optimal Dose Allocation (low:high) |
FOM (keV−1/2) |
Notes on Configuration |
|---|---|---|---|---|
| GOLD | 46 , 81 keV | 0.4 , 0.6 | 6.4 × 10⁻⁶ | Monoenergetic beams with ideal detector |
| 80 , 139 kVp | 1.6523 × 10⁻⁶ | Optimal polyenergetic configuration |
||
| 80 , 140 kVp | 1.6522 × 10⁻⁶ | Reference configuration | ||
| 2.54 × 10⁻⁶ | Reference configuration w/ optimal filter thickness |
|||
| IODINE | 33 , 44 keV | 0.6 , 0.4 | 3.1 × 10⁻⁶ | Monoenergetic beams with ideal detector |
| 33 , 52 kVp | 2.2 × 10⁻⁶ | Optimal polyenergetic configuration |
||
| 70 , 150 kVp | 0.4 , 0.6 | 6.6 × 10⁻⁷ | Optimal polyenergetic configuration above the low energy cutoff. |
|
| 80 , 140 kVp | 5.0 × 10⁻⁷ | Reference configuration | ||
| 0.3 , 0.7 | 1.0 × 10⁻⁶ | Reference configuration w/ optimal filter thickness |
Figure 7.
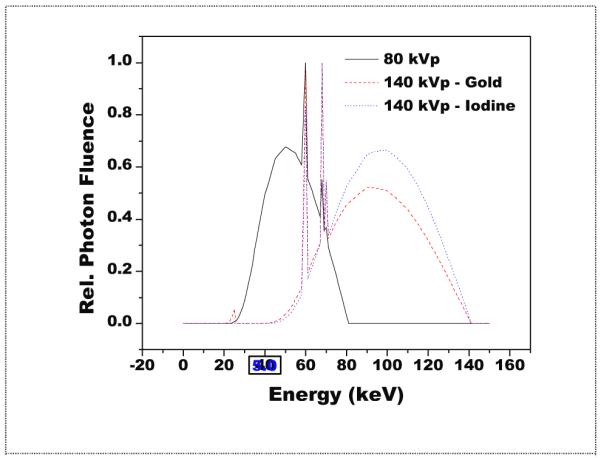
Polyenergetic spectra after optimization with a silver filter. Shown in relative units, the mean energy of the iodine spectra is seen to be higher than gold due to its larger silver filter (2000 μm) as compared to gold (800 μm).
4. DISCUSSION
For the case of monoenergetic beams, the peak FOM of gold was approximately two times higher than that of iodine. The case is somewhat reversed when considering polyenergetic beams where the FOM of iodine was slightly higher than the FOM of gold. However, the optimal spectra of iodine were predicted to be 33 kVp and 52 kVp. Imaging at these energies is not achievable due to considerations of the extremely high attenuation and resulting low flux which would emerge from the patient. When considering a more realistic scenario by applying a low energy cutoff of 70 kVp, the FOM of gold rises to 2.5 times the FOM of iodine as seen in table 1. For imaging gold, the optimal spectra were predicted to be 80 kVp and 139 kVp, and these are nearly identical to the reference protocol energies of 80 kVp and 140 kVp. As seen in the table, the difference in FOM between imaging at the predicted optimal energy of 139 kVp and the reference energy of 140 kVp was a small fraction of a percent. When comparing the FOM of iodine to that of gold at the reference energies, the FOM of gold was now seen to be approximately 3.3 times greater, and this difference was relatively constant over several patient thicknesses as seen from the data in Figure 5(b). For imaging iodine, even reducing the low beam energy to 70 kVp, the cutoff value, seen in figure 4(a), the FOM would increase by just 24%. Already, the difference in tube output, in terms of photon quanta, between 80 kVp and 140 kVp is approximately a factor of 4.5(Johnson, 2009). Reducing the low energy beam to 70 kVp would further increase this factor by approximately 30%. Furthermore, raising the high energy beam from 140 kVp to 150 kVp, as seen in figure 4(b), resulted in only a 10% increase in FOM. For both gold and iodine, the determining factor influencing the optimal spectra was the presence of the k absorption edge after which the photon attenuation substantially increased. As mentioned for gold, this value was 80.7 keV while only 33.1 keV for iodine. The benefits from the much higher absorption edge for gold only appear with the use of higher energy beam spectra. The combined results indicate that gold is much better suited to dual energy imaging than iodine with the current clinical protocol.
As for the effectiveness of adding a silver filter, the FOM of gold increased an additional 50% for a filter thickness of 800 μm, and was seen to decrease with further filtration. The FOM of iodine displayed no local maximum and increased 100% for the maximum filter thickness of 2000 μm. The increase in tube loading required for the addition of 800 μm of silver would be approximately 10 times, where for the addition of 2000 μm of silver would be approximately 100 times. A tube loading of 10 times is high while the tube loading of 100 times would not be realistic. Another report recently discussed the advantage of a tin filter for use in dual energy CT(Primak et al., 2009). Their conclusion was that the addition of 800 μm of tin would have a significant improvement in image quality. Silver and tin have similar x-ray attenuation characteristics as their atomic numbers are close, 47 vs 50. The mass density of silver is about 40% greater than tin, 10.5 g/cm3 vs. 7.4 g/cm3. So while silver has a slightly greater density, tin has a slightly greater atomic number. It would be expected they could be used almost interchangeably; the conclusions here are in general agreement with the results from the previous report.
As for figure 6, and the Rose model predictions, the results show the SNR of gold to be approximately double that of iodine for the same concentration, indicating that twice the amount of iodine would need to be present to ensure a detectable signal (SNR>5). The results in figure 6 are general and do not depend on the constraints of an equal number of molecules present in the macrophage. The total number of nanoparticles ingested into a macrophage is reported to depend on factors such as size, shape, and labeling(Wang et al., 2009; Chithrani et al., 2006; Aydogan et al., 2010). In our simulations we assumed an equal number of nanoparticles of the same size and shape for both gold and iodine (therefore, the same number of molecules in a macrophage). We feel this is a reasonable assumption given that the atomic radii of gold and iodine are equal within a difference of 4%(Slater, 1964). One open question though is how much contrast element could be expected to be present in arterial vulnerable plaque? A simple estimate of the expected concentration can be made as follows. One study found that 3.5 × 10⁴ nanoparticles coated with plasma fibronectin were ingested by each macrophage(MacNeill et al., 2003). The number of macrophages was increased threefold in unstable plaques, compared to stable ones(Lendon et al., 1991), as a distinguishing property of vulnerable plaque is the infiltration of macrophages, which secrete enzymes that degrade the fibrous materials of the plaque. It was reported that the number of macrophages in stable and unstable plaques were 446 cell/cm2 and 153 cell/cm2 per unit area, respectively(Casscells et al., 2003). Based on this information and assuming the diameter of a macrophage to be 21 μm, the concentration of accumulated gold in the unstable plaques can be estimated to be 1.75 g/cm3 and 0.6 g/cm3, respectively. Likewise, the concentration of accumulated iodine in unstable and stable plaques can be estimated to be 1.13 g/cm3 and 0.4 g/cm3, respectively based on the earlier assumption of scaling by the molecular masses. Based on these estimates, either contrast agent would be expected to be seen in a dual energy image as all quantities are far above the minimum detectable concentrations. These estimates also suggest the possibility of differentiating between stable and unstable plaques from dual energy images by quantifying the amount of contrast agent present in the plaque. Notwithstanding this estimate, a previous study reported the uptake of gold nanoparticles in a cancerous tumor for a mouse model at concentrations of only 7 mg/cm3 {Hainfeld, 2004 #4052.This open question regarding the expected concentration of gold nanoparticles in vulnerable atherosclerotic plaque will need to be tested experimentally in future studies.
ACKNOWLEDGEMENTS
The authors would like to thank Huy Le for his help in estimating the quantity of nanoparticle contrast agents in stable and unstable plaque.
This research was supported in part by Grant R01 HL89941 awarded by the NHLBI, DHHS.
Appendix: extension of the dual energy measurement uncertainty for three materials
In order to derive the variance in dual energy thickness for a combination of three materials, it is first necessary to impose a condition of fixed thickness, say T, to which all objects sum. The formula for the detected signal in equation 1 can be re-written as follows:
| (1) |
The thickness for water which was previously a variable, tw has been replaced by the fixed constant T. In dual energy imaging, it is primarily the log signal which is of interest and can be written as:
| (2) |
The difference in writing the log signal for a three material configuration is that the signal for water appears as a reference signal in the denominator. From our previous derivation(Ducote and Molloi, 2008), the variance in dual energy thickness for a contrast element in a two material configuration was written as:
| (3) |
The mean attenuation coefficient of the ‘opposing’ material in the numerator, in this case water, is in fact the partial derivative of the log signal with respect to thickness of water, tb. Noting this, the partial derivative of the log signal of equation 2 with respect to the opposing material, calcium hydroxyapatite, can now be written as:
| (4) |
The mean attenuation is now the difference between the attenuation of the opposing material and the water reference material. Substituting this change in equation 4 back into equation 3, the variance in dual energy thickness for a contrast element in three material configuration can be written as:
| (5) |
A similar derivation was previously used for dual energy mammography, where the three materials of interest were the thickness of microcalcifications in a breast composed of adipose and glandular tissues(Lemacks et al., 2002).
Footnotes
PACS #: 87
REFERENCES
- Alvarez RE, Macovski A. Energy-selective reconstructions in X-ray computerized tomography. Phys Med Biol. 1976;21:733–44. doi: 10.1088/0031-9155/21/5/002. [DOI] [PubMed] [Google Scholar]
- Aydogan B, Li J, Rajh T, Chaudhary A, Chmura SJ, Pelizzari C, Wietholt C, Kurtoglu M, Redmond P. AuNP-DG: deoxyglucose-labeled gold nanoparticles as X-ray computed tomography contrast agents for cancer imaging. Mol Imaging Biol. 2010;12:463–7. doi: 10.1007/s11307-010-0299-8. [DOI] [PubMed] [Google Scholar]
- Boone JM. Parametrized x-ray absorption in diagnostic radiology from Monte Carlo calculations: implications for x-ray detector design. Med Phys. 1992;19:1467–73. doi: 10.1118/1.596803. [DOI] [PubMed] [Google Scholar]
- Boone JM, Chavez AE. Comparison of x-ray cross sections for diagnostic and therapeutic medical physics. Medical Physics. 1996;23:1997–2005. doi: 10.1118/1.597899. [DOI] [PubMed] [Google Scholar]
- Boote E, Fent G, Kattumuri V, Casteel S, Katti K, Chanda N, Kannan R, Churchill R. Gold nanoparticle contrast in a phantom and juvenile swine: models for molecular imaging of human organs using x-ray computed tomography. Acad Radiol. 2010;17:410–7. doi: 10.1016/j.acra.2010.01.006. [DOI] [PMC free article] [PubMed] [Google Scholar]
- Bushberg JTSJA, Leidholdt EM, Jr., Boone JM. LIPPINCOTT WILLIAMS & WILKINS; Philadelphia: 2002. pp. 278–9. [Google Scholar]
- Cai QY, Kim SH, Choi KS, Kim SY, Byun SJ, Kim KW, Park SH, Juhng SK, Yoon KH. Colloidal gold nanoparticles as a blood-pool contrast agent for X-ray computed tomography in mice. Invest Radiol. 2007;42:797–806. doi: 10.1097/RLI.0b013e31811ecdcd. [DOI] [PubMed] [Google Scholar]
- Casscells W, Naghavi M, Willerson JT. Vulnerable atherosclerotic plaque: a multifocal disease. Circulation. 2003;107:2072–5. doi: 10.1161/01.CIR.0000069329.70061.68. [DOI] [PubMed] [Google Scholar]
- Chithrani BD, Ghazani AA, Chan WC. Determining the size and shape dependence of gold nanoparticle uptake into mammalian cells. Nano Lett. 2006;6:662–8. doi: 10.1021/nl052396o. [DOI] [PubMed] [Google Scholar]
- Ducote JL, Molloi S. Quantification of breast density with dual energy mammography: a simulation study. Med Phys. 2008;35:5411–8. doi: 10.1118/1.3002308. [DOI] [PMC free article] [PubMed] [Google Scholar]
- Ducote JL, Xu T, Molloi S. Optimization of a flat-panel based real time dual-energy system for cardiac imaging. Med Phys. 2006;33:1562–8. doi: 10.1118/1.2174131. [DOI] [PubMed] [Google Scholar]
- Fayad ZA, Fuster V. Clinical imaging of the high-risk or vulnerable atherosclerotic plaque. Circ Res. 2001;89:305–16. doi: 10.1161/hh1601.095596. [DOI] [PubMed] [Google Scholar]
- Feuerlein S, Roessl E, Proksa R, Martens G, Klass O, Jeltsch M, Rasche V, Brambs HJ, Hoffmann MH, Schlomka JP. Multienergy photon-counting K-edge imaging: potential for improved luminal depiction in vascular imaging. Radiology. 2008;249:1010–6. doi: 10.1148/radiol.2492080560. [DOI] [PubMed] [Google Scholar]
- Hasegawa B. The Physics of Medical X-Ray Imaging. Medical Physics Publishing Company; Madison, Wisconsin: 1991. [Google Scholar]
- Hyafil F, Cornily JC, Feig JE, Gordon R, Vucic E, Amirbekian V, Fisher EA, Fuster V, Feldman LJ, Fayad ZA. Noninvasive detection of macrophages using a nanoparticulate contrast agent for computed tomography. Nat Med. 2007;13:636–41. doi: 10.1038/nm1571. [DOI] [PubMed] [Google Scholar]
- Johns PC, Yaffe MJ. Theoretical optimization of dual-energy x-ray imaging with application to mammography. Med Phys. 1985;12:289–96. doi: 10.1118/1.595766. [DOI] [PubMed] [Google Scholar]
- Johnson TR, Krauss B, Sedlmair M, Grasruck M, Bruder H, Morhard D, Fink C, Weckbach S, Lenhard M, Schmidt B, Flohr T, Reiser MF, Becker CR. Material differentiation by dual energy CT: initial experience. Eur Radiol. 2007;17:1510–7. doi: 10.1007/s00330-006-0517-6. [DOI] [PubMed] [Google Scholar]
- Johnson TRC, Multislice CT, Reiser MF, et al. Springer Berlin Heidelberg; 2009. Dual-Energy CT Technical Background; pp. 65–73. [Google Scholar]
- Kalender WA. Fundamentals, System Technology, Image Quality, Applications. Wiley-VCH; 2005. Computed Tomography. [Google Scholar]
- Kalender WA, Kyriakou Y. Flat-detector computed tomography (FD-CT) Eur Radiol. 2007;17:2767–79. doi: 10.1007/s00330-007-0651-9. [DOI] [PubMed] [Google Scholar]
- Kashani H, Varon CA, Paul NS, Gang GJ, Van Metter R, Yorkston J, Siewerdsen JH. Diagnostic performance of a prototype dual-energy chest imaging system ROC analysis. Acad Radiol. 2009;17:298–308. doi: 10.1016/j.acra.2009.10.012. [DOI] [PubMed] [Google Scholar]
- Kattumuri V, Katti K, Bhaskaran S, Boote EJ, Casteel SW, Fent GM, Robertson DJ, Chandrasekhar M, Kannan R, Katti KV. Gum arabic as a phytochemical construct for the stabilization of gold nanoparticles: In vivo pharmacokinetics and X-ray-contrast-imaging studies. Small. 2007;3:333–41. doi: 10.1002/smll.200600427. [DOI] [PubMed] [Google Scholar]
- Kim D, Park S, Lee JH, Jeong YY, Jon S. Antibiofouling polymer-coated gold nanoparticles as a contrast agent for in vivo X-ray computed tomography imaging. Journal of the American Chemical Society. 2007;129:12585. doi: 10.1021/ja071471p. vol 129, pg 7661, 2007. [DOI] [PubMed] [Google Scholar]
- Lemacks MR, Kappadath SC, Shaw CC, Liu X, Whitman GJ. A dual-energy subtraction technique for microcalcification imaging in digital mammography--a signalto-noise analysis. Med Phys. 2002;29:1739–51. doi: 10.1118/1.1494832. [DOI] [PubMed] [Google Scholar]
- Lendon CL, Davies MJ, Born GV, Richardson PD. Atherosclerotic plaque caps are locally weakened when macrophages density is increased. Atherosclerosis. 1991;87:87–90. doi: 10.1016/0021-9150(91)90235-u. [DOI] [PubMed] [Google Scholar]
- Liu X, Yu L, Primak AN, McCollough CH. Quantitative imaging of element composition and mass fraction using dual-energy CT: three-material decomposition. Med Phys. 2009;36:1602–9. doi: 10.1118/1.3097632. [DOI] [PMC free article] [PubMed] [Google Scholar]
- MacNeill BD, Lowe HC, Takano M, Fuster V, Jang IK. Intravascular modalities for detection of vulnerable plaque: current status Arterioscler. Thromb Vasc Biol. 2003;23:1333–42. doi: 10.1161/01.ATV.0000080948.08888.BF. [DOI] [PubMed] [Google Scholar]
- McMahon SJ, Mendenhall MH, Jain S, Currell F. Radiotherapy in the presence of contrast agents: a general figure of merit and its application to gold nanoparticles. Physics in Medicine and Biology. 2008;53:5635–51. doi: 10.1088/0031-9155/53/20/005. [DOI] [PubMed] [Google Scholar]
- Nowotny R, Höfer A. Ein Programm f̈ur die Berechnung von diagnostischen Röntgenspektren. Fortschr Röntgenstr. 1985;142:685–9. doi: 10.1055/s-2008-1052738. [DOI] [PubMed] [Google Scholar]
- Primak AN, Ramirez Giraldo JC, Liu X, Yu L, McCollough CH. Improved dual-energy material discrimination for dual-source CT by means of additional spectral filtration. Med Phys. 2009;36:1359–69. doi: 10.1118/1.3083567. [DOI] [PMC free article] [PubMed] [Google Scholar]
- Shkumat NA, Siewerdsen JH, Dhanantwari AC, Williams DB, Richard S, Paul NS, Yorkston J, Van Metter R. Optimization of image acquisition techniques for dual-energy imaging of the chest. Med Phys. 2007;34:3904–15. doi: 10.1118/1.2777278. [DOI] [PubMed] [Google Scholar]
- Sidky EY, Zou Y, Pan X. Impact of polychromatic x-ray sources on helical, cone-beam computed tomography and dual-energy methods. Phys Med Biol. 2004;49:2293–303. doi: 10.1088/0031-9155/49/11/012. [DOI] [PubMed] [Google Scholar]
- Slater JC. Atomic Radii in Crystals. J Chem Phys. 1964;41:3199. [Google Scholar]
- Turkevich J, Stevenson PC, Hillier J. A Study of the Nucleation and Growth Processes in the Synthesis of Colloidal. Gold Discussions of the Faraday Society. 1951:55. [Google Scholar]
- Van Lysel MS. Optimization of beam parameters for dual-energy digital subtraction angiography. Med Phys. 1994;21:219–26. doi: 10.1118/1.597376. [DOI] [PubMed] [Google Scholar]
- Wang B, Yantsen E, Larson T, Karpiouk AB, Sethuraman S, Su JL, Sokolov K, Emelianov SY. Plasmonic intravascular photoacoustic imaging for detection of macrophages in atherosclerotic plaques. Nano Lett. 2009;9:2212–7. doi: 10.1021/nl801852e. [DOI] [PubMed] [Google Scholar]
- Zhou Y. Personal communication. 2010 Personal communication. [Google Scholar]